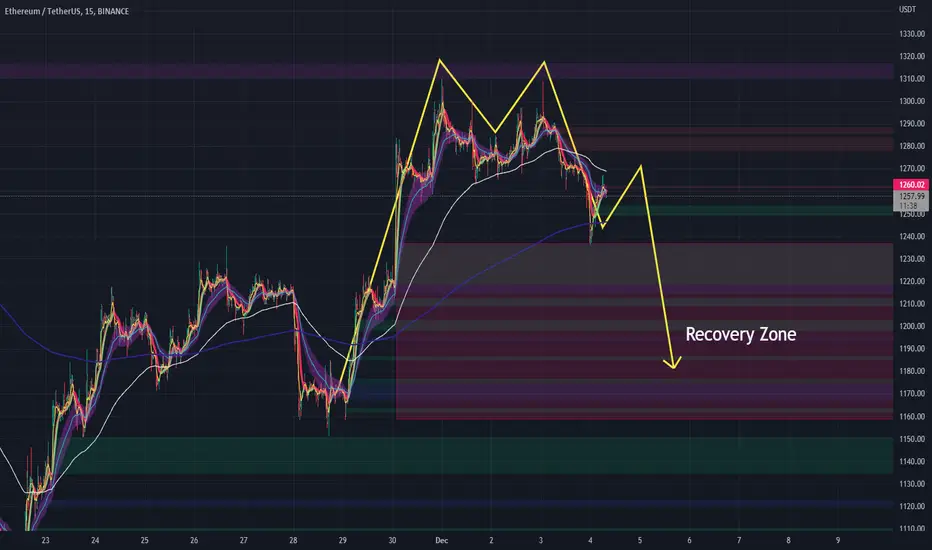
ETH Short SignalWe got a clear M formation and lots of zones to recover marked as "Recovery Zone".
A SHORT Entry would be between 1250 and 1270USD on ETH/USDT.
Monday we will see the play when markets are open.
Until then, keep your feet on the ground an prepare.
Have a great Sunday
Bottom
Has Bitcoin bottomed yet? December 2022 is where the decider,14KIn my opinion the bears are still in control. A break above 20K could be a sign that the market is preparing for a reversal back up. On the flip side a drop below the 15K low is very likely in December, only time will tell. This is my analysis. It may look a little bit chaotic but it's realistic.😎

Diamond bottom breakout in XHBDiamond bottoms are a strong indicator. I believe there is a high probability of the breakout from this diamond will lead to its target around $76. As it gets closer, I think trailing stop losses on stocks would be a good strategy considering inflation continuing and monetary policy temporarily easing. More tightening will likely be necessary as a result of inflation continuing to be a problem.

KDA capitulation bottom 2022-2023Could the $0.30 cent plus range be the absolute capitulation scenario for KDA? The blu line is the absolute recorded low for KDA. We may pay this price a visit depending on the capitulation event with Bitcoin bottoming out at or below $9500. We could follow this descending channel if price points are correct. The other horizontal lines are Fibonacci lines that could come into play. I would think that crypto is getting closer to a bottom than we think. I have used a bars pattern as a fractal as visual.


Bottom is in?Possible Bitcoin (BTC) bottom scenario
* This is just an idea, NFA
* High change we will drop straight down from here to 14K or less
* Even if we complete the expansion phase shown on the chart, we can stil make new lows, nothing is guaranteed

Fly BTC! My body is ready!I excluded a lot of details on this BTC chart to get back to basics and drew only long-term trendline.
There are a lot of other signs of BTC bottoming or very close:
1. BULL DIV RSI
2. BULL DIVS MACD
3. FEAR INDEX - EXTREME FEAR LAST WEEK
4. WHOLE MARKET UBER BEARSIH
5. PITCHFORK 2 EXTENSION SUPPORT
6. BTC CREATED A HIGHER HIGH ON A SMALLER TIME FRAMES.
7. DAILY ICHIMOKU ABOVE THE CLOUD
8. ...

Bitcoin bottom prediction: $8,100Bitcoin`s 40% correction will be complete in roughly 9 months. We should see a bottom around 8K if it hasn`t already bottomed out based on this trendline. Great opportunity for shorts.
None of this should be considered as financial advice, ultimately DCA is the best approach after a major red candle.

SPDR Bottom Support bendImportant:
****** With INTRS symbol added to compare and find points of bottoming, please enable AUTO and % to the chart) ********
I added the Interest rate line to check how long will it take to the market to start climbing out from bottom Pivot (once reached there), while comparing it to other yearly crises
When Interest rate gets to the highest point during a down trend period (Bear market), it will stay there for quite a while (about 3-5 months) before the fed starts decreasing interest rates again
2000 Dot-Com Crisis
Interest rates peaked at 6.5%
5/2000-12/2000 7 months interest rate stayed at peak
8/2000 Market peaked at 152
9/2002 - Market hit bottom (Pivot)
5/2000- 9/2002 From first time market hit highest Interest rate till bear market bottomed
8/2000 - 6/2007 Market took almost 7 years to go back to highest peak from 2000
2008 house market crisis
Interest rates peaked at 5.25%
6/2006-8/2007 (1 year and 2 months stayed at peak)
10/2007 Market peaked at 154 (***** ONLY 2 POINTS HIGHER THAN 2000 PEAK ******)
2/2009 Market hit bottom (Pivot)
6/2006- 2/2009 From first time market hit highest Interest rate till bear market bottomed
10/2007-03/2013 Market took 5.5 years to go back to highest peak from 2007

Why I took a 2x Trade on $ETH to 1450When all your signals line up in a systematic quant world, you take the trade as the statistics tell you to on ETH/USD $ETH. We have a few beautiful bottom signals that confirmed last week, with FloFi X, and Flux both firing quick bottoms that sometimes will act as springs to the nearest resistance/liquidity level. Willing to lose 16% on this trade based on the past results, with a 60% upside. Onward and Upward!

Using FloFi Trend, and FloFi X to call the BOTTOM on $ETHTwo of our most used tools FloFi Trend, and FloFi X helped call this bottom via the double bottom patterns on both PRICE + FloFi X.
We should channel walk up to 1400 or so, and then another bear flag created for a drop again as you've seen us do over the last year consistently. There are so many ways to use these tools together - powerful!
Throw me a boost if you want to see these tools on other assets.

S2F BTC 2WHaving kept a close eye this last 2 years on the Stock to Flow for BTC, I had noticed each time the S2F spiked on the 2W chart, a large move in price action shortly follows.
As BTC broke the recent 17.5 bottom and formed a lower bottom at 15.5, there was a significant spike in the S2F data as shown on the chart.
Awaiting more data with the S2F Model Value to spike as it has many times previously.
This could be seen as some relief and good news for the miners.
Happy Trading!

Bitcoins bottom is not in yet? Possible H&S formingWhile many investors are hopeful and cheerful about this somewhat positive price movement, be aware.
This could very well morph into a classic head and shoulder pattern. Bitcoin can test the lower blue trendline, to consequently get rejected by the upper trendline making the H&S pattern complete. Also, there are quite some important levels to break for BTC.
BTC is nevertheless still trading in a very important triangle (see upper and lower trendline), take into account that it can breakout in both directions.
Let's see if this H&S will become reality.

Bottom is in! Bitcoin hitting 50k in April 2023If we look in the previous bull run, there are few main points:
After the breakout of the falling price and weekly RSI resistance, it took BTC approximately 160 days to make a second peak at 0.618 fibo level
Such a movement would take us to about 50k at around April 2023
There are actually many similarities - mainly the big channel that the btc stays in the whole time, breaking out only around halving
Also, in the previous run, breakout of the falling price and RSI weekly resistance accured at the same time, same as now

DOTUSD SHOULD BE BOTTOMED NOW Dip under 5$ ended up with a bullish dragonfly doji.
And we are up up.
We are bottomed.. buy and hold.
Target is over 100$ for ATH

BTC T.A: Possible Bottoms and Deep Value OpportunitiesSome BTC technical analysis attempting to forecast possible bottom prices, as well as identify deep value buying opportunities

W Bottom to Momentum Run Example: CATWeekly Chart of CAT: this is one of the Dow components that is nearing its previous all-time high resistance levels. It is one of the first few Dow 30 stocks to challenge prior all-time high prices.
Caterpillar Inc. has been running with momentum that will now pause or stall at this level. Now, watch to see which support level holds as profit-taking continues.
This is NOT a trading range but an intermediate-term correction ending with a W bottom. Important to note the differences. A bottom after a correction tends to set up for momentum runs that can sustain longer than they do within a trading range.

HAS BTC BOTTOMED?Sentiment exactly the same as in 2018 when BTC dropped from $6000 to $3000. Everyone was expecting lower prices, sentiment was very negative, and the fear factor was at extreme fear. Same as this year.
That is exactly what institutions want you to think, and force you to sell so they can buy BTC at lower prices. These conditions are perfect for a bottom at 78,6 retrace from the previous high.
Fractal is very similar although there is one thing that is a bit of scale. ABC drop (capitulation) could be over, but when you are looking the fractal on a bigger time frame as daily, you can compare these fractals and see that ABC from this drop is significantly smaller. so that could be a fractal inside the fractal, meaning that we could still be in ABC, but BTC haven't finished C wave to the downside and maybe C is only starting, and we could see one more wave down.

Bitcoin possible bottomBTC price chart analysis on the 3Day time frame (Heikin-Ashi candles, wicks removed, log).
BTC appears to be completing a 5 wave down:
-I could go long layering in, if the price hits near these levels of -.23 fibonacci extension.
IMPORTANT
If the 3day 13 SMA crosses the 48 SMA up and both turn up, I default back to trend analysis
I could also add other indicators such as custom buy sell signals and or MACD , Stochastic , RSI , to assist my decisions but this is a simple projection.
None of this should be interpreted as financial advice, I am not a professional or certified financial adviser! all charts, and or analysis' are my personal opinions and observations only!

SOLANA still holds… what if it doesn’t?12.80 support zone had been bullish dip 3 times !!
11.55 just once.
If it’s still holds the bulls should be able to accumulate and then recover hard non-stop until bullish breaks out.
If that ever happens then y’all better buy and hold.
If the holds never happens then we are going down to the beginning of the year low since solana had been released and started down to 2-3$ area.
In my opinion is .. only if still holds and bulls are playing well then we are up and up non-stop. Again if holds are getting weak then we are making and create a new low for 2023.

COVID crash anomaly = BTC 2021 double top anomalyThe 2021 BTC double top anomaly is in my opinion a result of the covid crash in 2020.
Double tops are rare.
This one was the first of its kind for BTC. (gladly correct me if I am wrong)
The double top of BTC on 2021 ended on an almost clean close at the 2.272 fib level.
Most of people in the space know what this fib level represents.
The next bull cycle top is shown on the chart, that said IF we bottom at the current levels.
-Hall

SOL price action is not looking good right now BINANCE:SOLUSDT
So it's been while after ftx collapse Sol was in pressure due to alameda research holding of 300+ million worth of usd. people were afraid to hold solana so people dump their Sol holdings.
after that initial dump Sol formed another decending bearish triangle which isn't looking good for now.
the price is going much much lower, i think the sol bottom is going between $4-8. so investing in sol at this point is really dangrous at this point. initially i thought the Sol bottom was 23 but after ftx everything changed.
Note: in the long term sol is still in the good position. buying sol below 10$ is dream of many. it will give us atleast 20x return in the next bull run. which is not bad if you think like that.
p.s only invest what you can afford to lose.

VGXUSDT: Has it reached it's bottom?This is my 3rd publishment.
I had received a signal from my indicator that suggests that VGX / TETHERUS has potentially reached a bottom, and it may have room to move up. Even with the recent catalysts, it may be a bold prediction, but I suppose we shall see in the coming days/and weeks.
