Bitcoin Price AnalysisWelcome back,
Disclaimer: This is NOT trading advice. These are solely my opinions that I have posted for educational purposes only. I hope you make tons of money, I am not responsible for any financial losses. Thanks for reading!
Bitcoin has been in an overall downtrend since early November highs just under $65,000. Interestingly, Bitcoin has completed two 6 point cycles drawn out above on the weekly chart. The "1" starting points of each cycle began on the same bitcoin logarithmic growth curve each time; we appear to be finding support at the very same curve where we see the "1?" currently, and with the weekly RSI at lows we have not seen since March of 2020, coupled with possible inflection on the momentum indicators: it is possible we could be entering into the next accumulation phase.
4H
As we zoom in, the pattern suggests a bottom of $39,600. If we look at the growth curve however, a bottom of $40,269.36 is suggested. The local low of $40,571.23 is within 0.01% of this figure. Trend support/resistance lines are drawn at $52,100 ; $49,600 ; $48,000 ; $45,500 ; $39,600 ; and $28,750.
1H
On the hourly chart, Bitcoin is trading far below the 180h(blue) and 500h(orange) simple moving averages. Given the pattern drawn in red, it will be interesting to see how this one ages.
Do you think Bitcoin has found a bottom?
Bottom


Alibaba signaling a reversal?BABA has spent the last year in a bear market. It's down about 60% from it's highs. Based on the charts, the sellers look exhausted and most of the downward momentum has been spent. There's bullish divergence on the daily and 4hr charts. It may take a couple months for bullish momentum to return in force, but it looks like we are at, or near the floor. I'm anticipating short-term bullishness followed by perhaps one more low, and then solid growth.
----------------------------------------------------------------
These are my personal views and not financial advice. Please do your own research before investing.
I'd love to hear your thoughts, ideas and feedback. Feel free to Comment and I'll try and get back to you quickly.
If you appreciated this analysis, consider Liking or Following . Thanks!


SNDL BOTTOM??Check it out, let me know what you think. SNDL look like a double bottom with a couple and handle formation under way.
What is the short % on this right now?

USDCAD: 3 BOTTOMHey There!
This looks like 3 bottom. The Price shows bullish behavior, maybe 1:3 is modest but let's stick to "rules".

1 INCH is hitting the bottomRecently I've been looking for metaverse projects so I haven't covered much DeFi, however 1INCH is bottoming if it hasn't already bottomed (and not just 1INCH, new signals will follow).
I assumed the worst case scenario which is that bottom of possible retracement was that of last July's dump, in that case current price is currently passing below 0.786 Fib and hitting a strong support area (purple rectangle) which has already worked in the past with volumes similar or bigger of the current one. Assuming price plummets through this area next stop is 1 Fib line. However various indicators presents bullish DIV although here I show you only the SMI.
If you wanna enter 1INCH I think this is the moment at which you've to pay attention (and looking at my signals :D ), keep an eye on price, if we don't go below that support zone you can buy at this level. If we go below wait until we touch 1 Fib retracement's line. If we do go down split your buys because once we touch the lower support you never know if there's a capitulation behind the corner.
Good Luck

TOMOUSDT - Bottom in?Bullish Divergenve on the daily TOMOUSDT chart on the 2D Demandzone
Also small Stop Hunt at the bottom.
Probably another Stop Hunt within the 2D Demandzone + a Double Bullish Divergence into a Long Position.

$SE extreme oversold levels, strong bounce in next few days $SE extremely oversold, looking for a long out of demand around this 200 level for a mean reversion to 250 in the short term. Strong growth stock backed with fundamentals, short covering rally is coming. Also to mention we are directly at the 100MA on this weekly chart, green day in the market will send this thing up quickly.

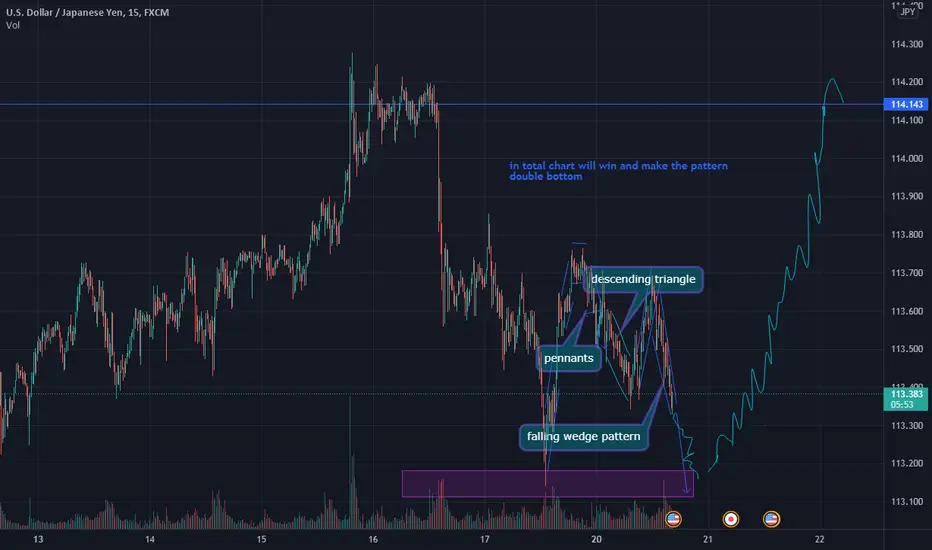
double bottom in total chart will win and make the pattern
double bottom as usual but we will see huge sell after 7 days
$PTON - Caught At Demand$PTON has started to look spicy after catching a bid at the supply zone from nearly a year back. This zone may finally mark a stable bottom for this freefalling ticker.
A strong breakout from our descending channel could likely catapult us over our overhead resistance.
This will be come of my top watches going into the new year.

Eth/USDT Binance +Elliot Wave and TargetsBINANCE:ETHUSDT
4 Hr Chart:
Trade Management:
Trade Entry: 123.90
Stop Loss: 122
Targets:
Target 1: 143.28
Target 2: 158.32
Target 3: 169.94
Risk/Reward ratio: 28.72

$UPST - Gap Fill SuccessfulOver the past couple of days, $UPST has regressed heavily and filled the gap it made back in August.
With Fed meetings over, and the newly bullish momentum in the markets, this name is primed to make a hefty reversal.
We have a small handful of resistances overhead, but I'm confident we'll be able to surpass them given enough bullish volume .
If we run hot enough, we even have a huge gap to fill above 270! I'll be keeping a close eye on this one heading into the new year.
ONG swingtrading swing support Supply Zone gap gapfill reversal bottom

EURJPYThe short may have already left without me, but i am more interested in buying from 127.500 area
Possible double bottom with plenty of liquidity for anyone who is currently long from that price area..

EURGBP Elliott Wave Analysis: Ending Diagonal Causes A ReversalHello traders!
EURGBP is coming higher for the last few weeks, after the pair moved to the lower side of a big 2016-2020 range. Notice that pair is coming higher after a five-wave drop on a daily chart where we see a bottom formation because of a wedge pattern in a fifth wave. Wedge, or ending diagonal, is a special type of a pattern that has a slow and choppy price action, with slow momentum and volume, which is normally indication that opposite move will occur, usually very strongly.
Notice that so far, we can see a price coming nicely out of a wedge so we should be aware of a higher prices, but possibly after intraday set-backs. Many times you will also notice that after an ending diagonal is finished, price will retrace back to the starting point of the pattern which in our case is at 0.8720.
Trade well!
Disclosure: Please be informed that information we provide is NOT a trading recommendation or investment advice. All of our work is for educational purposes only.

WOOUSDT - Long term entryHad a very long consolidation period with lower highs and higher lows, now almost back to the consolidation (order block) from before the move up.
A lower low in that consolidation zone with a divergence could give me a very nice (long-term) entry.
This consolidation zone also contains the POC (Point of Control) of the consolidation. This is where the most volume has been traded and thus is a place where historically bulls and bears fight for control.
Would be even more interesting in combination with a Bullish Divergence on the RSI.
Invalidation would be below 0.45.

ANKR possible breakoutHey everyone, welcome back.
I was checking out random coins and I saw this one, seems like we have made a double bottom and its ready to breakout.
as you know there are lots of random coins being pumped each day for 20 30 percent, they all have the same pattern, making a bottom and breaking a trend line.
Anyways, all the info available on chart, good luck.
* This is not a financial advice *

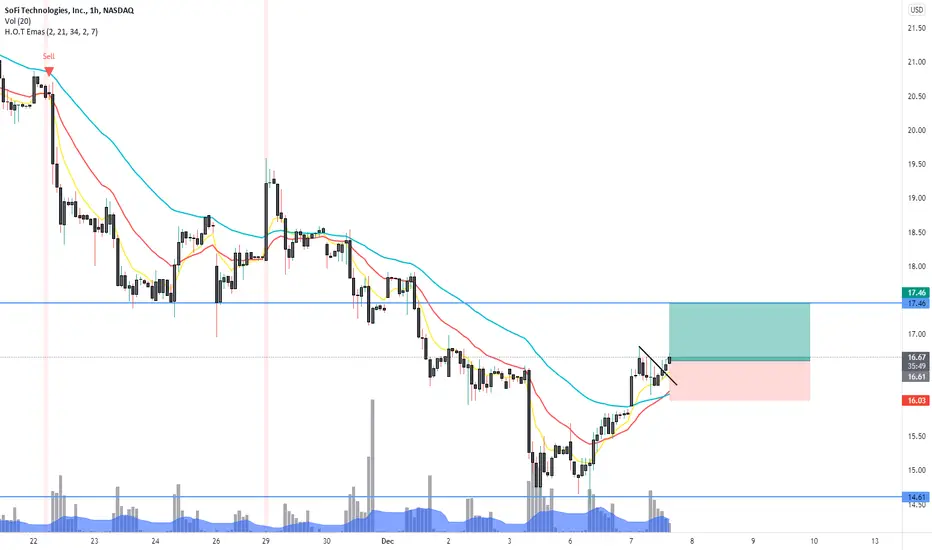
SOFI moving from bottomMassive flow coming into 07/15
Could have found a bottom
R:R is great and worth getting in at any pullback
CRSP Possible BottomCRSP is currently at key support and the 200 week moving average. This may be a possible bottom, however it is best to look for an entry on a lower time frame (4hr or 1hr chart) before entering. Bottoming patterns to look out for are inverted head and shoulders, double bottoms, and/or higher highs with higher lows.

PGR DailyNYSE:PGR may be ready to make a move.
Tested the bottom four times around $89.50 and it wouldn't break.
MACD just turned positive
Today's bar broke a trend line and closed above all the congestion from Nov
20 EMA crossed above the 50 EMA and they are both positive and accelerating.

When to buy LOTS of BitcoinPretty simple; when the price of BTC hits the 200 wk moving average, that has historically been the very bottom of each cycle. Buying the bottom is easier, more important, and more profitable that selling the exact top. Let me know what you think.

$ADA Bottom? #TraderSnek #Ada #CardanoBottom showing on 4hr and Daily. Hitting fib levels perfect, too. Looks spicy. Last time RSI was this low on both time frames = rocketship. Lots of FUD to this point, too.

Double Bottom on AUD/CAD @ W1This double bottom pattern has formed on the weekly chart of the AUD/CAD currency pair, signaling a potential reversal from the preceding downtrend. The two bottoms are marked with the yellow arcs; the neckline is marked with the yellow horizontal line. My potential entry level is at the cyan line. My potential take-profit level is at the green line. A stop-loss (not shown on the chart) can be set to the low of the breakout candle or to the low of the preceding candle if the breakout candle trades mostly outside of the pattern's borders.
