BTC BOTTOM $ - 100% Never Fails (2013 - Today)Bitcoin Weekly Chart Going Back To 10+ Years
We are looking at the BitStamp Green Support Line here that has Marked the bottom correctly before 100% of the time for each each bull cycle pump on bitcoin going 3/3 without fail.
We are now looking to see if we can go 4/4 and mark the new bottom buy with a quick wick down to the green support currently around 73K+ this week, but as each week closes the bitcoin bottom number will rise as the green support line rises over time.
Good luck. Let's see if the 4th time is also the charm.
Bottomfinder

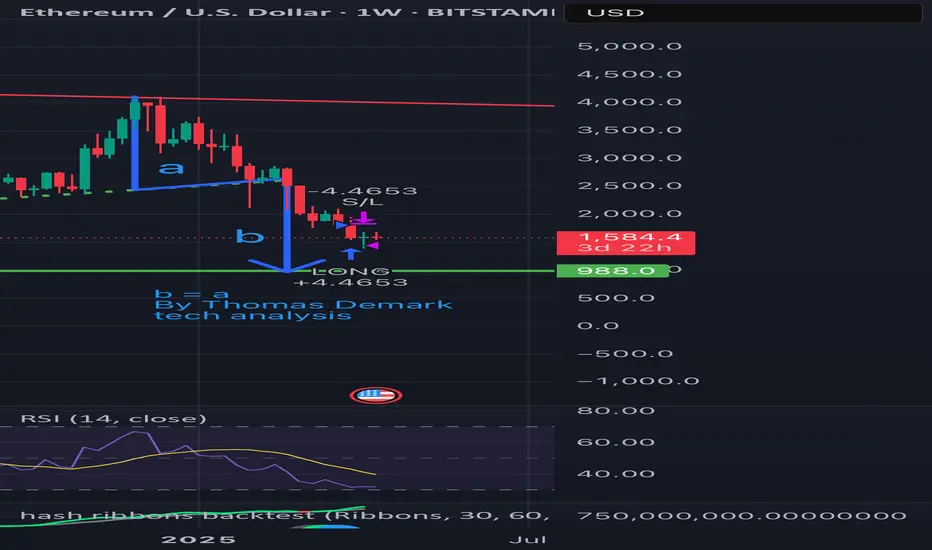
ETH is falling per Demark’s technical analysis: Target at $988?According to Thomas Demark’s method — when b = a, the next target for ETH is around $988.
📉 Price broke the ascending support
🔻 Wave “a” from $4000 to $2500 has already played out
📏 Wave “b” is projected downward — target aligns with a strong historical support zone
📊 Weekly RSI is nearing oversold territory
Conclusion: The $988 area is critical. A reversal may occur there if selling pressure weakens.
Stay sharp.
#ETH #Demark #CryptoAnalysis #TechnicalAnalysis #Ethereum
Bullish Outlook going forward for NQNQ has pulled back and taken Feb. Monthly low as well as grabbing some additional liquidity from Nov. last year. I shorted NQ on Thursday for 473 points to my anticipated level of support. I nearly caught the bottom of the market, followed by an aggressive back move up to equilibrium to end the week. Going forward, with the high impact news coming up in the first 2 weeks of March, I see a bullish outlook and the potential for new ATH. Here is an idea of what I see playing out over the short-term.

HONEY won't fall down the WELL! Bottom is nearNASDAQ:HON - HoneyWell
- Uptrend since COVID (2020)
- At the bottom of the channel
- Massive Volume Shelf
- Key Support/ Resistance Area (S/R)
- Wr% at Green Support Beam
To me the downside looks limited here. When this ship turns it probably goes to $300🎯
Not financial advice

NQ: Hit the first Supply Zonethe Impulse Master indicator for TradingView printed a bottoming green Demand Zone on Tuesday. Today this post CPI spike hits the first Supply Zone.

We caught the morning top and midday lowMy Impulse Master indicator for @TradingView produced a winning short setup in the morning and then nicely caught the midday low

ES - intraday reversalsThe Impulse Master Indicator nailed both, the morning bottom and the afternoon top.
Read more at:

$CELH HAS BOTTOMED, YOU'VE BEEN WARNED! BIG MOVE INBOUND!NASDAQ:CELH HAS BOTTOMED!
3 reasons why:
1.) Breakout of the consolidation box on the Williams R% to the upside.
2.) MACD bullish cross upward after bottoming
3.) Trend has already crossed to bullish and pushing higher (Trend moves faster than MACD.
Get ready!
They report on Wed. and in my opinion the only thing to stop this BULL from running would be dog 💩#earnings
NFA
AMEX:IWM #tradingstrategy #TradingInsights

Celsius ($CELH) is FINALLY BOTTOMING. NOW IS THE TIME TO BUY! NASDAQ:CELH is FINALLY BOTTOMING?! NOW IS THE TIME TO BUY!
5 REASONS WHY:
1⃣ We have DIVERGENCE on the Weekly Chart
2⃣ It's a "High Five Setup"
3⃣ It's a BUY according to my Valuation Metric Tool (4/6 score)
4⃣ Growth Beast! Beaten down over 40% this year
5⃣ Find out by watching. 👇
Video analysis 5/5. Stay tuned for more!🔔
Like ❤️ Follow 🤳 Share 🔂
Will Celsius finally get back on track with their growth or be defeated by the Goliath Monster?!
Sorry for the pauses in the middle of the video; my dog came in and was about to start howling 🐶🤣
Not financial advice.

RUNE - It Can't Get Any Better!Testing a Macro support for the first time after almost a year (October 23')
Enough htf confluence to take the trade.
Long here all the way down to $2.7

SOLUSDT : BULLISH W-Bottom PatternThe daily timeframe for Solana has revealed a key pattern - the W Bottom pattern.
If this pattern plays out, a healthy correction of around 16% is likely before another impulse wave(s) up.
It's important to note that according to this pattern, for the immediate/short term we will likely go lower to retest the key support zone, which is the W Neckline. But for the near/long term, this is a bullish pattern.
The one condition for this pattern, is that the daily candle cannot CLOSE underneath the support zone / neckline of the W .
Don't miss yesterday's update on why ALTSEASON 2.0 is upon us:
____________________________
COINBASE:SOLUSD

RAMCOINDUSTRIES Bullish for 1 year termEntry cmp 165
1 Target 315- 355 Rs ..Almost double
Strong Sl at 149Rs
Hold it for next one year and sit relax.
Downside limited and upper side open sky.

ADAUSDT Elliott wave countCardano may find support into 0.618 fib retracement of wave ((1)) ending a complex correction started from 0.8104.
Price must clear 0.49 level before we may declare an end of the correction at 0.3575.
Also oscillators are showing bullish divergence that may signal a potential shift of the trend.

DOTUSD Elliott wave countWatching fore evidences for and end of wave (ii)).
Key support levels 0.618 fib retracement and 1.618 fib extension wave (a) vs (c).
We see also oscillators divergence that may signal a trend change to the upside.

MATICUSD Elliott wave countPolygon must not break below 0.4926 level to keep this count valid with a 4th wave triangle or a more bullish count with 12 12 and both wave 2 flat corrections.
Above 0.4926 and clearing 0.7587 we are looking to the upside with target above 5 USD.
Also we see divergence on oscillators that may signal a shift to the upside.

KNCUSD Elliott wave countKyber network looking good with a lot of accumulation, more than 1.6 years, above 0.618 fib retracement.
You see here how good are Fibonacci levels acting like support and resistance.
Above 0.4644 and clearing 0.8157 we are looking to the upside.
We will post updates soon with an intraday count.
Hit the like button if you like my analysis and follow me for future updates and intraday count!
Good luck!

Oatly Whats likely, More Price Decline or Bottom reached?Hi Guys. This is a Technical Analysis Update on Oatly, (OTLY). On the 1 Week Timeframe.
We are in a critical area for OTLY.
We have continued our DECLINE from the REJECTION area
With last weeks candle close, We have CLOSED BELOW the "MAJOR SUPPORT" Area.
This candle close isn't enough information to assess what comes next. The next week or the next couple weeks we need CONFIRMATION.
So its important to observe what happens next.
So couple of scenarios can occur:
1. We confirm back ABOVE the MAJOR SUPPORT line. Leading to the formation of a DOUBLE BOTTOM pattern. This would confirm our bottom for OTLY, and we start to move back up to Resistance levels.
2. We CONFIRM our break BELOW the MAJOR SUPPORT.
Leading to not only ALL TIME LOWS, but the potential for the DESCENDING Triangle to play out.
If thats the case, we can go as LOW as $0.40 cents.
But without data points, its hard to assess if we do go down that far or stop before.
Notice also the "Bullish Divergence Trendline" on Price action. This line coincides with our "Measured Target".
Could be an area where we bounce from and be a potential Bottom area.
3. Ideal scenario would be we come down a bit lower from the Major SUPPORT Line and start our way back up ABOVE "Major Support". This would form a "Head" and play into a potential bottoming pattern, the Inverse Head & Shoulders pattern. The First green circle indicating our 1st bottom of potential double bottom, would be our left shoulder.
Watch also the RSI. We are nearing a Support test on the "Bullish DIVERGENCE" trendline. We want this to stay as support. We don't want a break and confirmation BELOW the RED dashed line. It could negate our Bullish Divergence Trend.
The STOCH RSI is also something to watch. We have traveled BELOW the 20 level. Extended stay below here, would indicate further Price DECLINES. We would like to see a BUllish cross back ABOVE 20 level for Bullish Momentum to come in and push prices back up. If we do get a cross, then Double bottom is likely.
We need to stay level headed as OTLY bottoms out. Take it one step at a time with an objective mindset.
__________________________________________________________________________________
Thank you for taking the time to read my analysis. Hope it helped keep you informed. Please do support my ideas by boosting, following me and commenting. Thanks again.
Stay tuned for more updates on OTLY in the near future.
If you have any questions, do reach out. Thank you again.
DISCLAIMER: This is not financial advice, i am not a financial advisor. The thoughts expressed in the posts are my opinion and for educational purposes. Do not use my ideas for the basis of your trading strategy, make sure to work out your own strategy and when trading always spend majority of your time on risk management strategy.

HDFCLIFE NEAR ENTRY LEVELSHDFCLIFE is currently trading near an Good Quality Hourly Demand Zone which is again close to an Weekly Demand Zone ( making the entry zone even more reliable).
The Opposing / Target zones T1 and T2 (both previously tested) have been marked in the image with levels and price movement should be observed around those levels.
Stop loss has not been mentioned but should be 3% from the lower level of the entry zone i.e. 562 - 3% = 545 (on closing basis in Hourly tf)
Note - Please do your own analysis before taking any kind of positions

The Future is Electric and $BLNK is poised soar The Technicals: We have seen NASDAQ:BLNK bounce off the $2.22 support level and indicating it has bottomed and ready to start making positive momentum on the upside.
The bullish case for EV and Blink Charging Co.
For starters, the demand for EVs is skyrocketing. In 2023, global EV sales reached 10 million units, and this number is expected to double by 2025. This is due to a number of factors, including government incentives, increased environmental awareness, and the fact that EVs are just plain cool.
With the world going green and governments pushing for a transition to electric vehicles (EVs), the demand for charging infrastructure is set to skyrocket. Blink Charging, being a leading provider of EV charging equipment and services, is well-positioned to ride this electrifying wave.
Expanding Network: Blink Charging has been busy expanding its charging network across the US, Europe, and the Middle East. This expansion could lead to increased revenue and a stronger market position, making it an attractive investment option for those looking to charge up their portfolios.
Strategic Partnerships: Blink Charging has been making friends in high places, forming strategic partnerships with major companies like Whole Foods and the Los Angeles Department of Transportation. These alliances could lead to increased visibility and adoption of Blink's charging solutions, further boosting its growth potential.
The Short Squeeze Potential: With a high short interest of 33%, a positive news catalyst could lead to a short squeeze, sending NASDAQ:BLNK stock soaring to the moon. This could be an opportunity for brave investors to capitalize on the potential upside.

NIO: Breaking Through Important Resistance Levels - but beware!We see a strong bullish reaction in NIO's shares, which have been rising steadily since last week, when they approached their bottom at $7.
Around $7, we see a region of multiple support, present since June, but which has suffered several attempts to be breached during November and December, without success.
Now, the price has made a strong enough reaction to break through some important medium-term resistance points, such as the 21 EMA, and more recently, the previous top at $8.51.
In doing so, NIO's shares are sending a clear message that the medium-term trend is now upwards, as it is operating above various supports, and breaking through previous resistances.
In theory, the next resistances are NIO's next targets, such as $9.22, or even the gap open at $10.22. Remember, gaps act as magnets when the price reverses a trend.
Although this is a reading for the medium term, it's important to point out that NIO shares still face some problems in the long term, as seen in the weekly chart below:
Clearly, the area around $7 is the most important support here too, but since November 2021, the price has been in a persistent downtrend. We don't see rising tops and bottoms, and the 21 EMA could still be a resistance point, although the price is above it this week.
So, while buying with a focus on the medium term is technically plausible, caution is advised as the weekly chart is still in a downtrend.
I'll keep you updated on this, so remember to follow me to keep in touch with my daily analyses, and if you liked the post, remember to support the idea.
All the best,
Nathan.

Bottom fishing in Aavas finance!Aavas finance is a Nifty500 stock which has been taking a support on trendline.
Recently the stock has shown good volume accumulation near the trendline and jumped from the same.
The stock looks good technically as a buy on dip candidate uptil 1450 with a SL of below 1355 DCB.
The targets are 1750,2000++.
Idea is shared for educational purposes and should not be considered as a recommendation.

Spot A Reliable Bottom Pattern 👀Hi Traders, Investors and Speculators 📉📈
Ev here. Been trading crypto since 2017 and later got into stocks. I have 3 board exams on financial markets and studied economics from a top tier university for a year. Daytime job - Math Teacher. 👩🏫
Are we there yet? Are we THERE YET? Now? How about NOW ??
We can't help it - towards the end of a bearish cycle, we're all wondering - when are we bottoming? In today's chart, I've pulled up a few of my favorite candlestick patterns and chart patters. I find these especially useful in higher timeframes. And yes, there are MANY MORE. These are just some of my favorites.
These patterns are what I will be looking for in this part of the cycle (accumulation phase). During this part, there can be lot's of foul play, noise, shakeouts etc. I personally won't be convinced of a reversal until a clear pattern can be observed.
While you're here 🖐 Want to know a little more on how to do distributed entry's / dollar-cost-average? See HERE:
_________________
👀 Follow us here on TradingView for daily updates and trade ideas on crypto , stocks and commodities 💎
👍Hit like & Follow 🔔
We thank you for your support !
CryptoCheck

NYKAA - Swing Long - T@ 200NYKAA appears to be bottoming out.
Opportunity to Swing Long.
Target 1 @ 200
