Bottoms

An overlooked rule: Wait for the gamblers to have their funMarkets in general sort of always manage to find the nobs breaking point.
After big rallies, some may say bubbles, what is known as "dumb money" is attracted, and you might hear that "oh they don't mean dumb in that sense" if you believe this bs you know you are one of them. Where does this experession come from then? They used the word dumb but without meaning it? "They meant you didn't take the time to think" ye that's right, dumb money didn't take the time to think before buying, or before doing anything, which is also known as "being dumb period".
Serious investors know these creatures, these "emotionals", are morons. They don't want to get all unpopular so they don't just say the truth directly.
The market is not a separate entity, it moves because its participants move it.
Those nobs that get all excited, the gamblers and the breakeven idiots, they prevent the price from going up for 2 reasons:
- Gamblers buy & sell randomly, 1 because they are gamblers, 2 because they are stupid enough to be gamblers therefore are unable to make any correct prediction, if they try they'll be the kind to get excited twice a day and change their mind based on the latest fractal or magical secret indicator they saw (often accompanied by "I am a legend").
- Breakeven idiots love to breakeven. They buy randomly the latest hyped thing, might be a ponzi, might not, they are full random, if they only bought scams there would be some value to them obviously, but nope, full random. They are bad, they look to get rich quick, and hold bags. They hold to zero on the way down, and to nothing at all on the way up. After bagholding they get desperate to breakeven (see the GME clowns that bought at $350 and above), same with dotcoms.
How many idiots were relieved they could finally sell their Amazon shares at $30? Congrats man you got me you get last word well done you were right to hold your bag. You got your $30 a share back. Now Amazon is $3000.
So it's obvious what I'm getting at. Once these clowns get wiped out by a scary red candle after bagholding for years (Bitcoin first half of 2020) there basically is no more resistance, the few bagholders left will breakeven at key levels but it won't stop the uptrend, the majority of the breakeven bagholder herd got ripped to pieces by crocs when they crossed the river.
Nasdaq, Bitcoin, etc. The more gamblers and breakeven bagholders get attracted to something, the more vertically it goes up after they get wiped out.
And until they get wiped out the market never bottoms. They will never win. They are the ultimate illustration of what being BAD at something is.
Fun fact you will always hear from the 1% of this herd that got lucky, the ones with survivor bias "ye sure this river is safe to cross for wildebeests just look at me".
Wildebeests are the dumbest creatures I have ever seen, after weekend "investors" of course. The behavior, not sarcasm I am serious, the behavior is the same.
Do you want to be on the side of wildebeests or the side of crocodiles?
The survivor bias ones celebrate their "gains" showing their extreme ignorance, they act like the herd made money, but data says otherwise.
We used to have robintrack for example, also the UK regulator which banned BTC in the UK but even in Europe because too many people were losing too much money.
We could see visually the data directly. GME, Tesla... (GME from Citadel among others). With Tesla when they buy "the dip" and the price bounces they ALL end up selling on the way up, "breakeven", oh gosh myfxbook is mindblowing for this it's absolutely insane, the 95% on the wrong side of a trend, the average winner size and loser, the awful entries and exits etc.
And while TSLA goes up no retailer buys UNTIL THE TOP, and you know exactly what happens: THIS TIME THEY HOLD. Get rid of winners, hold losers. Brilliant.
They have this ability to buy at the very top, absolute genius. Hear some news then "sidelines" like they aren't late enough, then crack "OK NOW IS THE RIGHT TIME TO BUY"!
The vast majority of crypto bagholders and "dip" buyers that were desperate to catch the bottom ended up missing out. Isn't that amazing?
> Do not trade corrections in general
> When the gambling bagholding herd joins, get ready to exit and then stay away
> Let the gamblers have their fun, and get back into a market after they leave
It has always worked this way and it will keep working this way. Gamblers will ALWAYS lose.
Bottoms will ALWAYS happen once they get wiped out and never before that, no matter how hard they try to "HODL".
If it's not clear enough, if a Tesla or GME or BTC baggy is reading, it's not just about value investors: TREND FOLLOWERS FOLLOW TRENDS. TREND FOLLOWERS CREATE TRENDS. THE PRICEY NO GOY UP IF NO TREND HAPPEN BECAUSE BREAKEVEN TRADERS ARE SELLING. TREND START AFTER BREAKEVENERS AND RANDOM GAMBLERS GET OUT AND SELLING PRESSURE GO GO HOME. THEN PRICE GO GO UP NATURALLY THEN TREND FOLLOWERS FOLLOW TREND AND PRICEY GO GO UP MORE. IF NO TREND THEN TREND FOLLOWERS NO SEE TREND AND NO BUY AND NO PUSH PRICEY UP.
I'll make another idea where I get into this, more clean, and without using the word idiot every sentence :D
Funny how bagholders try so hard to get everyone else to hold when this is precisely what is holding them back, ignorance and stupidity are cruel jokes.

USD/JPY BEARISH D1-Bearish Signs
-Well consolidated channel, with respectives tops and bottoms as seen on the chart
-On the last Top we could see a well formed candle pattern BEARISH ENGULFING
- It's possible to see that the pair is on fight zone, where is possible to watch a lot of new support and resistance zones , so, i hope the pair to go down, but it's possible that buyers would give some fight signs.

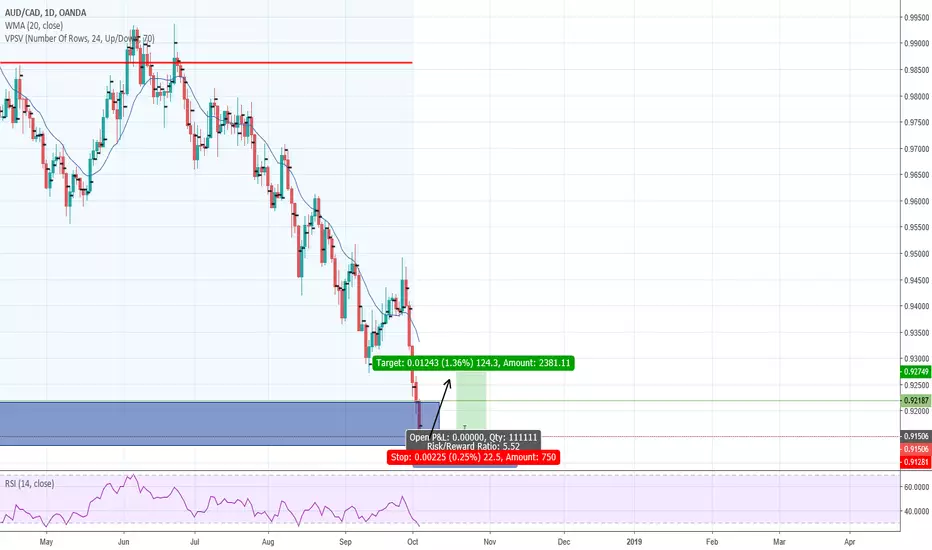
MULTIPLE BOTTOMS.Here we have a great example of MULTIPLE BOTTOMS.
In this pattern the market gave you the chance to re-entry the market
with the re-test pullback and the it gave the big move.
--> Very good Risk To Reward (1:5.5 = 550 pips).
WATCH OUT TO CATCH THIS PATTERN THE NEXT TIME ! ! !

GBP/NZD buy (week)Clues: Trendline breakthrough, 50 ema crosses the 200, tweezer bottoms on weekly TF, W formation.
We are at level 1 expecting level 2 to form this week. Look out the news for GBP this week!
Note: Please do YOUR OWN analysis before you enter any trade!
Good luck fellow traders ...!!

Adani Power - Don't Miss Power in the Cup- Portfolio Stock at 40Disclaimer
-----------------------------
All investments involve risk, and the past performance of a security, industry, sector, market, financial product, trading strategy, or individual’s trading does not guarantee future results or returns. Investors are fully responsible for any investment decisions they make. Such decisions should be based solely on an evaluation of their financial circumstances, investment objectives, risk tolerance, and liquidity needs.
----------------------------------------------------------------------------------------------------------------------------------------------------------------------------
(Last Price - 42.10 - 11:52 Hrs / 11th March 2020)
Doing it from the vacation spot. Another portfolio stock which one should not miss. Stay classy until next update.
Adani Power forming a traditional cup & handle pattern whose handle is running or almost completed at recent low @ 40's - Don't miss the power if you get it specially in the cup.
Kindly consult your financial advisor before considering this stock as part of your portfolio.
------------------------------------------------------------------------------------------------------------------------------------------------------------------------
2nd July 2019 -Waiting for handle to complete close to 40-45 zone from the tops of 70's
-----------------------------------------------------------------------------------------------------------------------------------------------------------------------
------------------------------------------------------------------------------------------------------------------------------------------------------------------------
Is the handle completed at 40's ? Ask the question to your self
------------------------------------------------------------------------------------------------------------------------------------------------------------------------
What Is A Cup And Handle?
A cup and handle price pattern on charts is a old school pattern (traditional chart patterns) that resembles a cup and handle where the cup is in the shape of a "U" and the handle has a slight downward drift.

your mum uses these productsok anyone with half a brain can see this bad boy is in a strong uptrend. red hollow momo hammer bouncing at the bottom of the channel.
i circled a very strong pattern looks like it needed to close above 149 to confirm it (which it did) very strongly
they also are working on a corona virus vax. so lots of plays in store for this bad boy
if it breaks ath it can see a serious run here. short term target 153.20 long term 170

XRP Horn bottomXRPUSD has experienced a large drop recently, this has lead to the formation of a horn bottom which may lead to a short term bullish reversal. (6/29, in a bearish market. According to Encyclopedia of chart patterns)

How many bottoms before reversal?One bottom, two bottom, three bottom, four. Five bottom six bottom..Do dooo doo dooo...
BTS could be about to pop. Who knows?
Good luck.


Finding Bitcoin Cycle Bottom Using Fibonacci ToolIn this post, i'll share a tool which helps you find Bitcoin's market cycles bottoms, it is the Trend Based Fibonacci extension.
You don't need to understand what this tool is to know how to use it, but if you want an explanation here is a video.
www.youtube.com
First start by laying the trend at the market top, then count from there the next 3-4 lower lows, lay the trend, and extend the fibonacci tool part to the next closest lower high.
That's it! Now you just keep an eye out on those levels.
An important Note
These levels are to be used as areas to determine where to buy or sell and not specific price point . This is too help you find a better entry on average and potentially not miss the next run up.

Trading styles. Part 4/5. Countertrend trading.There are 2 types of people that do countertrend:
- Those at the very bottom
- Those at the very top
(For those that did not learn maths post high school or is it in high school and didn't learn by themselves either: this does not mean that ALL people at the bottom or at the top do this... I think the majority of bottom feeders go for this, but for those at the top it is the minority like people that play noob champions in video games, bottom 10% perma pick them but they are rare at top 1% level - rare but not non existant).
I have a correction to make on this series, I messed up.
Trading styles. Part 1/5. The 4 different kinds of bottoms. ==> This does not fit in the list.
It should be:
1/4 Pullbacks
2/4 Continuation
3/4 Countertrend
4/4 Ranging
Bonus - Exotic strategies
Bottom buying and top selling is an element of pullbacks and countertrend but should not get its separate thing.
Countertrend can be going against the short term trend with the higher TF trend but this is rather buying pullbacks.
Here I am talking about going against the high TF trend and getting out on a lower TF.
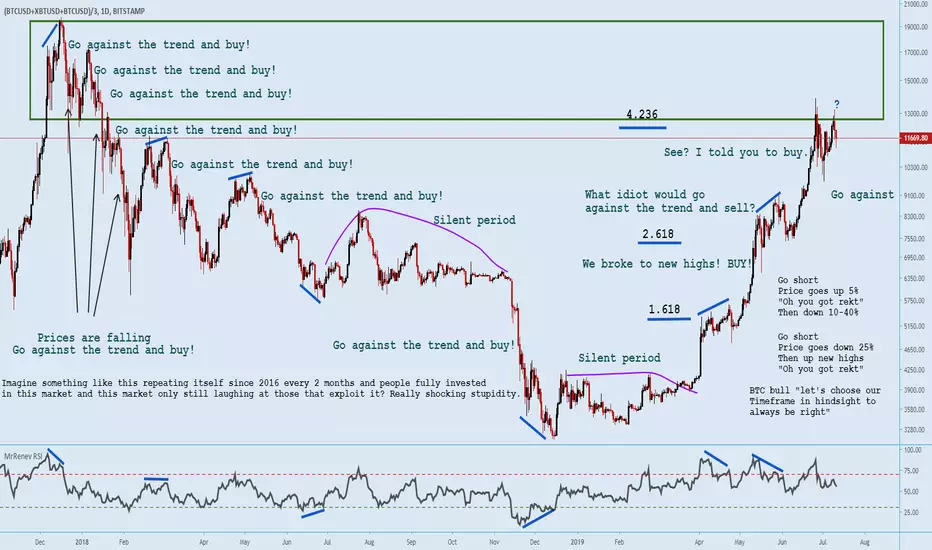
As I have shown clearly on BTC this works. But as alot of bears that got decimated on the way up have clearly shown this is not that easy.
You had to be really picky, enter as close to the top as possible based on many factors (and risk missing out obviously), and then babysit that trade closely.
Most noobs still have not figured out how anyone that kept shorting could possibly have made money so... Clearly this is advanced.
The problem here is that the bottom 10 or maybe even 33% really think they are at the top. They are completely delusional. Ego takes over or something.
Just look at Robinhood casual investors... All going against trends.
The OGs/pros keep repeating to go with the trend but they think they can outsmart everyone.
Jesse Lauriston Livermore said around 100 years ago "I never buy on reactions... I never go short on rallies..." and "In my method of trading... I BUY after a stock makes a new HIGH".
There have been people consistently profitable picking tops and bottoms (both pullbacks and countertrend) so it is not impossible, still, there are a microscopic minority and most people should not try going for this.
The thing is, this is what I do ... Pullbacks and Countertrend. tried continuation and ranging too but it is too much I just do not want to lose my focus go do too much.
I did not choose this it chose me. I have always been nitty picky and careful and "seeing things". Since I started, at the very start, I saw crypto alts pullback and give huge RR and high probability bottoms. Also going for breaks and such is annoying to me, have to be close to the PC, never goes how I want etc...
Most people have clearly shown that they hate missing out! They keep repeating it they made it really clear! So why even consider going agaisnt trends? How stupid!
You have to miss out all the time for it to work. If you follow the trend like most people and easiest way to make money, you get rewarded the more you FOMO, the faster you FOMO (as long as you know when to get out).
More examples of predictable countertrend things:
At the very first few times it happens ignore but after a certain amounts of times the patterns repeat itself the exact same way... Got to take risks to get gains.
At some point probably stops working...
With BTC there was also a period where someone dumped every day at the same exact time last year. Was easy to hop on and short just before it happened regardless of the trend, as long as the whale kept dumping. I think it lasted a good 2 weeks.
I have a rule it is usually do not short anything at all time high (or buy all time low) unless you have very solid reasons for it... This sounds subjective. This is why only the best can go for it. The not best will find anything and count it as a very solid reason.
Price can go up 150% before going down. So precision is necessary too.
Actually my countertrend strategy is not even pure countertrend it is a mix somewhere between countertrend ranging and pullback.
My other main strategy (got 2 main ones) is really going with the trend on a pullback.
Do not trade corrections. And looking for the end of a trend sucks too but resistance + extension + momentum can probably work.
Entering at the end of an ABC is cool it is what I do all the time, and and ABC might be a 12345 cannot always tell.
This is a pullback trade not countertrade, even thought I think the new dominant trend is a bear one:
Ah yes, most noobs buy something when it is "overbought", it is truly the most idiotic thing. Had to be somethign started as a prank there is no way.
Unless you have insider info or saw a pattern repeat over and over going agaisnt strong momentum is idiotic.
I do not even understand how those that do this are able to survive. They have help... No way they survive on their own. Mum perhaps?
I also think people look at chart patterns that are only for continuation and apply them to go against the trend.
There are those that incorrectly identify the trend thought... somehow...
So I guess biggest dificulties:

Bitcoin Bottoming from Mining Revenue PerspectiveToday I want to focus on 2 fundamental metrics that aim to call Cycle Tops and Cycle Bottoms in Bitcoin:
Daily Mining Income (USD)
Puell Multiple
Calling Bottoms
Through the analysis of the USD equivalent Bitcoin Mining Revenue, we can forecast future bottoming areas.
When Bitcoin topped in 2013 at $1163, it set the bar for the mining income level around $5.1M a day. And it's meant to be expected that the next BTC cycle 2017-2019 should bottom around a price range that generates this kind of daily mining revenue. This rule has been fulfilled during all the cycles since 2011 with no exception.
Well, we know that a bottom between $2500-$3000 would fulfill that condition.
Does it mean that BTC cannot move beyond that? Not at all, but certainly it hints that a move below might happen quickly because we would be trading at zones below value.
Looking at the Puell Multiple, one might think that the bottoming already happened. Certainly, we're missing significant volume, a significant bounce and the institutional blueprint. But looking at the facts, this indicator has a 100% track record at calling cycle bottoms. Is this time different?
Calling Tops
The Puell Multiple also works as a proxy for calling Bitcoin Cycle Tops. The metric is pretty simple:
Looking forward we'll know that we are about to top, once we exceed 5x-10x the average mining revenue from the last 365 days.

AMD Stock: Inverted V Top at Strong SupportAdvanced Micro Devices has a huge V Top formation that is now hovering above the support level of the sideways range from 2017. The Top is a Severe Inverted V Top created by irrational exuberance from a speculative buying frenzy that was not supported by the company’s fundamentals.
AMD stock has peeled off about 50% of its value, which is the typical level at which technical patterns and fundamental values for 2019 coalesce. There may be another sell short run, but this stock now has higher risk for selling short against the potential net run down gains possible. The support from 2017 is strong support. However, many stocks will dig deep into this level of support before any Dark Pool automated orders begin triggering to create bottoms.

Go Long! This is the third time price has reached this area, RSI suggests its overbought and we are at an unfair low on the volume profile. Enter around .91506 STP at .91513 although you could go out a bit further, Target at .92749.
Good luck and happy trading. If you like my suggestions please Like, subscribe and share.
Bitcoin (BTCUSD) bottom? DowJones key take aways (2008)Hello all,
I'm trying to analyse several bottom formations of different asset classes in order to find key take-aways that could be useful for the BTCUSD bottom formation.
On my profile page you can find the BTCUSD analysis based on the same principles.
The Dow Jones bottom formation after 2008 financial crisis:
- Top 200 MA: 13 300
- Bottom 200MA: 8 300
- Draw a fibonacci retracement from top to bottom:
Findings:
- V-bottom formation (different then BTC '14, Nikkei '08 -'09)
- Before V formation price was trading with a very high volatility in the 85 - 100 - 115 retrace channel from 200MA top
- After parabolic selloffs (3); 130% retrace from 200MA top served as support.
- Price levels below 130% got bought up linear (V-shape)
- Price found support at 100% retrace from 200 MA where it confirmed the bottom
- 200 MA in uptrend ever since
Link BTC 2014 Crash:
- parabolic selloffs
- 85 - 100 - 115 % retrace from 200MA top plays still important role during bottom formation
shortcommings:
- Prediction of 200MA trendline
- Empirical analysis
I'm looking forward to your feedback.
Best,
Bavo

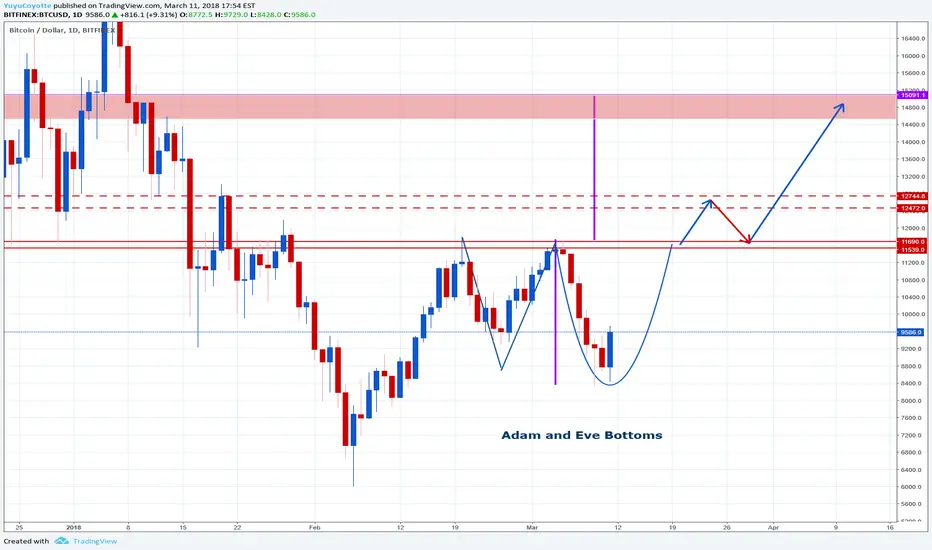
Look and wait the formation of this pattern...Adam and Eve ate the Apple and the lady moon had called to take the lambo on the moon.
Adam and Eve Bottoms
www.chartsecret.com
Investing in Boring BusinessesVLGEA is a boring business. It operates a chain of ShopRite groceries stores across PA, NJ, and MD. The company averages a modest 6% sales growth CAGR and has paid a dividend every year since its inception in 1965. I like investing in boring businesses. Stable, consistent returns on shareholder capital can have tremendous compounding effects.
VLGEA sits on a ton of cash, has stable, consistent free cash flows with an unlevered FCF 10Y CAGR of 29%. Although the company faces stiff competition in an industry that already deals with narrow margins, they have flexibility and potential to get to their intrinsic business value of around $31 - $36/share.
I wrote a blog piece about them where I go into more detail, give it a read here: rockvuecapital.wordpress.com
From a technical standpoint, if the stock can hold at this current support level of 22.50 - 23, I would venture to initiate a starter position with a stop loss right below that support. Any price acceleration from the bottom I would add on to my position.
Please let me know if I missed anything, or if I have any blind spots in my analysis, it really helps!
Thanks,
Brandon

Bitcoin Hidden Bullish DivergenceAs myself and many others on here predicted ~8k would be support and a possible bottom. Now that we have confirmation it is support... the only question left is whether it is also the bottom!
We have hidden Bullish divergence on OBV and RSI indicating this level as a possible bottom.
This is reason enough for me to start accumulating bitcoin again to hold, but I am not convinced we will not go lower so I saving most of my cash for lower levels.
The next stop is ~5k if 7.6k Fails.

IOTA IOTUSD No interest in buying this rally yetIOTA IOTUSD
Iota is testing important support at 3.229 with a low at 3.20.
this latter level must continue to hold (and will do so long as
Bitcoin holds up, which will not be for much longer now, it's
just completing its own counter-rally now). Any failure to hold
3.20 will force Iota lower still to 3.03 and then should this
level fail to 2.73 at least if not back to 2.47.
Even though it's on support and rallying now, have no interest
in buying here until Bitcoin makes a clear bottom. We can
pick it up cheaper still urther down the line.

$COCO Breakout. Does it have the legs to go past 2.49?Breakout from 2.34, but does it have the legs to go past 2.49?
Looks like a bottom is in place but will the trend reverse now or much later?

Is BTCUSD topping at every $1K in this bullish channel???Couple observations from this channel that I am seeing.
1. the top of each rally in this channel is exactly $1K from the bottom.
2. First retrace was $700.
3. Second retrace was $700.
I am keeping an eye on this pattern for entry points and targets for getting out.
This is my first TA. Please feel free to roast my chart, but I would rather hear some good feedback.
