MEGAPHONE ALERT! BTC 1H Outlook🧩 Megaphone Formation (Broadening Wedge)
Volatility expanding inside a widening range
Price now testing the Fib cluster (0.66–0.618) between 105,568–105,987
RSI at 66.3, nearing overbought — pressure is building
Volume surging above 20-period MA → breakout imminent
🎯 Key Confluences:
Upper Bollinger Band: 105,950
Mid BB (Basis): 105,110
Lower BB: 104,342
55 SMA: 104,500
SL Zone (Invalidation): Above 106,500 (upper wick resistance)
🔻 Bearish Breakdown Scenario:
Loss of 105,100 and breakdown from lower wedge line
RSI drops < 45 + volume spike → hedge confirmation
Targets: 104,000 → 102,500
🔺 Bullish Breakout Scenario:
Close above 106,000–106,500 with volume
Targets: 107,800 → 108,900
Manage with trailing stops — things will be quick!
⚠️ Summary:
Megaphone = Volatility Bomb
Stay nimble. If BTC fails at this Fib zone, the breakdown will be fast and decisive. If it breaks out, bulls might squeeze higher but need volume to sustain it.
Bounce

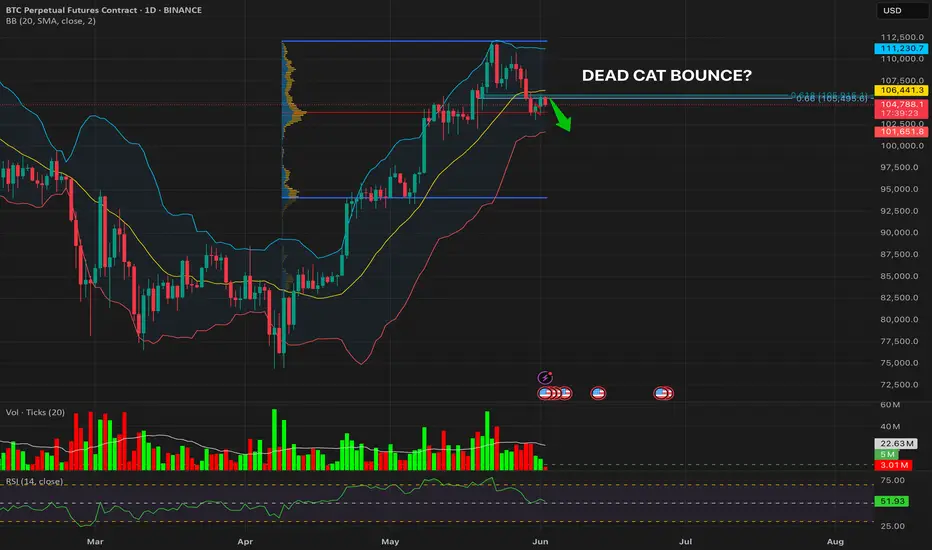
DEAD CAT BOUNCE? | BTC/USDT Daily + 4H Breakdown📉 Daily Chart – Rejection from Mid-BB & Fib Cluster
BTC bounced into the 0.618–0.66 retracement zone (105,495–106,443)
Price failed to close above the mid-Bollinger Band (106,443)
Volume declining on the bounce → lack of buying conviction
RSI barely holding above 50 (52.05) → weak momentum
Price is now rejecting from the underside of broken support → classic S/R flip
Possible Dead Cat Bounce forming below structure
🕵️♂️ 4H Chart – Short Hedge Retest Opportunity
Breakdown confirmed below 104,472 HL
RSI still below 45 on the 4H → bearish momentum intact
Retest of breakdown zone with weak volume
Price capped by mid-BB + 55 SMA (105,400–106,000 region)
Structure confirms a potential LPSY (Last Point of Supply) in Wyckoff markdown
🎯 Trade Plan (RTP-Compliant Short Hedge)
Entry: ~104,800 (confirmed breakdown zone)
SL: Just above 106,443 (Fib + BB basis + 55 SMA)
TP1: 103,300 (Lower BB)
TP2: 101,500 (Lower channel bound)
TP3: Trailing 1.0% below 101,400
⚠️ Summary
BTC's bounce lacks volume, RSI strength, and structural reclaim. Unless bulls close above 106,443 with force, this setup favors a continuation lower.
EURNZD Analysis: Bounce & BreakoutHello traders!
EURNZD is in a 1h range and is offering two trading scenarios.
The first scenario suggests the pair may react bearishly from the resistance zone, setting up a bounce opportunity that could drive price lower toward the 1.90000 area.
The second scenario anticipates a breakout above the resistance zone, followed by a retest, which could present a strong opportunity for continuation toward the 1.92000 area.
Discretionary Trading: Where Experience Becomes the Edge
Discretionary trading is all about making decisions based on what you see, what you feel, and what you've learned through experience. Unlike systematic strategies that rely on fixed rules or algorithms, discretionary traders use their judgment to read the market in real time. It's a skill that can't be rushed, because it's built on screen time, pattern recognition, and the ability to stay calm under pressure.
There's no shortcut here. You need to see enough market conditions, wins, and losses to build that intuition—the kind that tells you when to pull the trigger or sit on your hands. Charts might look the same, but context changes everything, and that's something only experience can teach you.
At the end of the day, discretionary trading is an art, refined over time, sharpened through mistakes, and driven by instinct. It's not for everyone, but for those who've put in the work, it can be a powerful way to trade.

Are you shorting the bounce or waiting for confirmation?Japan’s Q1 GDP came in worse than expected: -0.2% QoQ (-0.7% annualized). Weak consumption, soft exports, and a fading external boost despite a weak yen isn't a great combo for Asia’s largest export economy.
The Nikkei 225 reacted immediately, and the H4 chart is starting to reflect deeper structural pressure.
🔍 Technical Outlook:
- Price reversed from the high of 38,745.
- Price is testing the 50 SMA and could enter the Ichimoku cloud.
- The cloud is signalling a twist, which could be a sign of momentum fading and the trend weakening or reversing.
📊 Projection:
If the price closes below the 50 SMA and breaks through the cloud, further downside could be expected, with the target levels at
- 36,800 (last consolidation zone), and
- 35,570 (38.2% fibonacci retracement level and 200 SMA).
Alternatively, if the bulls defend the cloud, we could see the price climb to the resistance level of 40,500
This is a classic macro meets technicals moment. A weak data print is lining up against the possibility of a technical rollover.

EURGBP Analysis: Two Daily POIsHello traders!
EURGBP is offering two trading scenarios on the daily timeframe.
The first scenario suggests the pair may react bullishly from the next zone, setting up a bounce opportunity that could drive price higher toward the 0.84400 area.
The second scenario anticipates a bounce toward the 0.83800 area, where a mean reversion setup may come into play (if buyers step in and price action confirms bullish intent near that support).
Discretionary Trading: Where Experience Becomes the Edge
Discretionary trading is all about making decisions based on what you see, what you feel, and what you've learned through experience. Unlike systematic strategies that rely on fixed rules or algorithms, discretionary traders use their judgment to read the market in real time. It's a skill that can't be rushed, because it's built on screen time, pattern recognition, and the ability to stay calm under pressure.
There's no shortcut here. You need to see enough market conditions, wins, and losses to build that intuition—the kind that tells you when to pull the trigger or sit on your hands. Charts might look the same, but context changes everything, and that's something only experience can teach you.
At the end of the day, discretionary trading is an art, refined over time, sharpened through mistakes, and driven by instinct. It's not for everyone, but for those who've put in the work, it can be a powerful way to trade.

USDCAD Analysis: Three Bounce ScenariosHello traders!
USDCAD is offering three trading scenarios on the daily timeframe.
The first scenario suggests the pair may react bullishly from the currently approached zone, setting up a bounce opportunity that could drive price higher toward the 1.41600 area.
The second scenario anticipates a bounce toward the 1.37586 region, where a mean reversion setup may come into play (if buyers step in and price action confirms bullish intent near that support).
The third scenario anticipates a bounce toward the 1.34150 region, where a mean reversion setup may come into play (if buyers step in and price action confirms bullish intent near that support).
Discretionary Trading: Where Experience Becomes the Edge
Discretionary trading is all about making decisions based on what you see, what you feel, and what you've learned through experience. Unlike systematic strategies that rely on fixed rules or algorithms, discretionary traders use their judgment to read the market in real time. It's a skill that can't be rushed, because it's built on screen time, pattern recognition, and the ability to stay calm under pressure.
There's no shortcut here. You need to see enough market conditions, wins, and losses to build that intuition—the kind that tells you when to pull the trigger or sit on your hands. Charts might look the same, but context changes everything, and that's something only experience can teach you.
At the end of the day, discretionary trading is an art, refined over time, sharpened through mistakes, and driven by instinct. It's not for everyone, but for those who've put in the work, it can be a powerful way to trade.

I'm shorting thisTwo weekly timeframe for a better understanding. Looks like a large bearish flag forming. Price just bounce off the bottom of the flag. But I think is a dead cat bounce. Is hitting a resistance level 35-36. Doesn't look too sting to break it up. SL triggers if a weekly candle breaks up the resistance and closes above it.

NZDCAD Discretionary Analysis: Bounce at 0.83Hello traders and happy Easter Monday!
I'm expecting a bounce on NZDCAD. I'm interested in this 0.83 zone. It might turn into a strong bounce point. If the signs are there, I'm jumping in with a short.
Discretionary Trading: Where Experience Becomes the Edge
Discretionary trading is all about making decisions based on what you see, what you feel, and what you've learned through experience. Unlike systematic strategies that rely on fixed rules or algorithms, discretionary traders use their judgment to read the market in real time. It's a skill that can't be rushed, because it's built on screen time, pattern recognition, and the ability to stay calm under pressure.
There's no shortcut here. You need to see enough market conditions, wins, and losses to build that intuition—the kind that tells you when to pull the trigger or sit on your hands. Charts might look the same, but context changes everything, and that's something only experience can teach you.
At the end of the day, discretionary trading is an art, refined over time, sharpened through mistakes, and driven by instinct. It's not for everyone, but for those who've put in the work, it can be a powerful way to trade.

GBPNZD Discretionary Analysis: Bounce at 2.18Hello traders.
I'm like what I see on GBPNZD. I'm expecting the momentum to continue. I'm watching that 2.18 zone closely. It's where I'll be looking for a reaction. Could be a solid bounce spot, and if it shows signs, I'm stepping in.
Discretionary Trading: Where Experience Becomes the Edge
Discretionary trading is all about making decisions based on what you see, what you feel, and what you've learned through experience. Unlike systematic strategies that rely on fixed rules or algorithms, discretionary traders use their judgment to read the market in real time. It's a skill that can't be rushed, because it's built on screen time, pattern recognition, and the ability to stay calm under pressure.
There's no shortcut here. You need to see enough market conditions, wins, and losses to build that intuition—the kind that tells you when to pull the trigger or sit on your hands. Charts might look the same, but context changes everything, and that's something only experience can teach you.
At the end of the day, discretionary trading is an art, refined over time, sharpened through mistakes, and driven by instinct. It's not for everyone, but for those who've put in the work, it can be a powerful way to trade.

Cat's in the CradleHey Guys!! Here's one for you that you are going to Like
Let's Aim for a ~50% profit, on This one...
($22---->30 )
double-bottom,Trend Channel
Clearly defined Support-and-resistance Touch points.
Cheers!
And the cat's in the cradle and the silver spoon
Little boy blue and the man on the moon
"When you comin' home, Dad?"
"I don't know when, but we'll get together then
You know we'll have a good time then"

NZDUSD Discretionary Analysis: Bounce at 0.59Hello traders.
NZDUSD has potential for me. I'm expecting the momentum to continue, and I've got my eye on that 0.59 level to get involved. That's where I'll be looking for a setup.
Discretionary Trading: Where Experience Becomes the Edge
Discretionary trading is all about making decisions based on what you see, what you feel, and what you've learned through experience. Unlike systematic strategies that rely on fixed rules or algorithms, discretionary traders use their judgment to read the market in real time. It's a skill that can't be rushed, because it's built on screen time, pattern recognition, and the ability to stay calm under pressure.
There's no shortcut here. You need to see enough market conditions, wins, and losses to build that intuition—the kind that tells you when to pull the trigger or sit on your hands. Charts might look the same, but context changes everything, and that's something only experience can teach you.
At the end of the day, discretionary trading is an art, refined over time, sharpened through mistakes, and driven by instinct. It's not for everyone, but for those who've put in the work, it can be a powerful way to trade.

Nightly $SPY / $SPX Scenarios for April 3, 2025🔮 🔮
🌍 Market-Moving News 🌍:
🇺🇸📈 President Trump's 'Liberation Day' Tariffs Implemented: On April 2, President Donald Trump announced a series of new tariffs, referred to as "Liberation Day" tariffs, aiming to address trade imbalances. These include a baseline 10% tariff on all imports, with higher rates for specific countries: 34% on Chinese goods, 20% on European Union products, and 25% on all foreign-made automobiles. The administration asserts these measures will revitalize domestic industries, though critics warn of potential price increases for consumers and possible retaliatory actions from affected nations.
📊 Key Data Releases 📊
📅 Thursday, April 3:
📉 Initial Jobless Claims (8:30 AM ET):
Forecast: 225,000
Previous: 224,000
Measures the number of individuals filing for unemployment benefits for the first time during the past week, providing insight into the labor market's health.
📈 Trade Balance (8:30 AM ET):
Forecast: -$76.0 billion
Previous: -$131.4 billion
Indicates the difference in value between imported and exported goods and services, reflecting the nation's trade activity.
🏢 ISM Services PMI (10:00 AM ET):
Forecast: 53.0
Previous: 53.5
Assesses the performance of the services sector; a reading above 50 suggests expansion.
⚠️ Disclaimer: This information is for educational and informational purposes only and should not be construed as financial advice. Always consult a licensed financial advisor before making investment decisions.
📌 #trading #stockmarket #economy #news #trendtao #charting #technicalanalysis

Clean breakDouble top confirmed. the pair is bouncing up to test the broken support (dead cat). Not sure if it will make it all the way up the broken support zone, it might start dropping now. SL triggers if a daily candle closes above the broken support now resistance area.

Bitcoin - EMA Support Holding Strong!#BTC/USD #Analysis
Description
---------------------------------------------------------------
BTC/USD – Weekly Chart Analysis
📉 Current Price: $82,239 (-4.47%)
📈 Key Moving Averages:
🔹 EMA 20: 88,143
🔹 EMA 40: 81,116
🔹 SMA 50: 76,230
EMA Support Holds Strong – The chart highlights multiple historical instances where BTC found support at the 20-40 EMA zone (orange circles). This pattern has played out consistently in past market cycles.
- Bullish Trend Continuation – Each time BTC has tested this EMA region on a pullback, it has led to strong recoveries and further bullish momentum.
- Current Market Structure – BTC is once again testing this key EMA support zone. A bounce from here could signal a continuation of the uptrend.
- Historical Patterns Repeat – The blue shaded region and Vector Algo's AI-optimized signals indicate that similar setups have resulted in upward moves.
✅ Bullish Scenario: If BTC holds above the EMA 40 ($81,000) and forms bullish confirmation candles, we could see a move toward previous highs ($96,000) and possibly $100,000+.
❌ Bearish Scenario: A breakdown below $81,000 could lead to further downside towards the 50 SMA ($76,000) and lower demand zones.
Bitcoin remains in a strong uptrend, and the current EMA support test is crucial for trend continuation. Keeping an eye on price action around this zone is key for potential long opportunities!
---------------------------------------------------------------
Enhance, Trade, Grow
---------------------------------------------------------------
Feel free to share your thoughts and insights. Don't forget to like and follow us for more trading ideas and discussions.
Best Regards,
VectorAlgo

BITCOIN - Price can reach support level and then start to growHi guys, this is my overview for BTCUSDT, feel free to check it and write your feedback in comments👊
Some time ago, the price long time traded near $83700 level, broke it and started to grow inside an upward wedge.
Firstly, BTC rose to the resistance line of the wedge and then corrected to the support level, after which it reached the $87800 level.
After several attempts to break resistance, price turned around and dropped, thereby exiting from wedge.
Now it is correcting and approaching support level, slowly moving toward $83700 key support level.
In my opinion, when BTC reaches $83700 level, it can turn around and start to grow to the $87800 resistance level.
If this post is useful to you, you can support me with like/boost and advice in comments❤️

$SPY Bounce to 590s?Hey everyone, it's your boy pic. AMEX:SPY looks primed for a typical ABC correction to around 590 going into the second half of March. Chart lines up with NextPivot Indicator and FIB levels just as pretty as you please. Nice look with clear stops. Good luck!

ETH at a Make-or-Break Level – What’s Next?🚀 Hey Traders!
If you're getting value from this analysis, smash that 👍 & hit Follow for high-accuracy trade setups that actually deliver! 💹🔥
🚨 ETH Update – Critical Level Ahead!
ETH is currently forming a symmetrical triangle on the 2-week timeframe and is now testing the lower trendline. With 4 days left before the candle closes, this level is crucial! 🔥
📌 What’s next?
✅ If ETH bounces from here, we could see a strong bullish move in the coming days.
❌ Invalidation: A close below $1850 could trigger further downside.
📉 Breakdown or Bounce? What’s your take? Drop your thoughts in the comments! 👇💬
🔔 Follow us for real-time updates and winning trade setups! 🚀

ADBE to $465 - Chance for a BounceNASDAQ:ADBE ADBE, as well as other tech stocks, was beaten hard over the last couple of months. The earnings recently did not provide any relief for the chart either, although the figures were not particularly bad. In particular, the possible prospect of finally being able to expand and monetize Adobe's own AI “Firefly” continues to offer good opportunities.
With a PE of now under 20, Adobe has become quite favorable as a company that continues to grow well in the SaaS sector. It has also reached several technical support zones. We are at the lower edge of a very large bull flag that has been in place since the beginning of 2024. Horizontal support at $385 is also supportive. We have 3 large daily gaps in the chart above us and a bullish wedge within the flag. This is a good place to start buying for a possible bounce towards $465.
However, one must bear in mind that the overall market remains bearish. Purchases should therefore be closely hedged and not be too large. However, it would be wrong not to use this opportunity to enter the market.
Target Zones
$465.00
Support Zones
$385.00
$360.00

Potential Path of the Altcoin Market?Trading Family,
To say that our altcoin market has been disappointing would be the understatement of the year. While there definitely have been some winners (I have held Solana through the $8 low), the majority have been a large disappointment. In fact, the last I read, only 42 altcoins have outperformed Bitcoin since the bear market bottom was put in. This is an incredible stat to think about and very telling. Altcoin traders have a difficult task in beating the BTC hodl'ers for sure.
However, recently there have been some hidden indications that our altcoin market will soon increase our odds of success.
First of all, Bitcoin's low fees. Low fees on the Bitcoin blockchain is often a hidden health indicator for the coin signaling weak demand. People often see low fees as a positive thing. But what's actually happening here is that there is low demand for transacting on the chain, therefore, in order to increase the demand, transaction fees are forced down.
Weaker demand does seem to correlate with what the BTC dominance chart is showing us.
You can see from the chart that we have a large sell side liquidity block that has formed, indicating large sell side volume in dominance. Additionally, my indicator has flashed a red dot, signaling that it is time for dominance to drop. We also have our RSI and Macd, crossing down. And if we break from that channel, dominance drop momentum should accelerate.
This brings me to our TOTAL3 chart which is all altcoins excluding Ethereum. The chart is showing us that we have reached an extremely critical support trendline. Price is currently bouncing from it. Additionally, there are large volumes of buyers at this point. You can observe this by the VRVP candles and the liquidity blocks indicator. But contrary to BTC.D in which the RSI and Macd were crossing down, TOTAL3 shows our RSI and Macd crossing up! This is bullish for alts.
Finally, it is a great sign to see that our "M" pattern has looked to have completed right at our point of support.
I have drawn a projected pathway from here. In the first part of our next week, we may see a bit more pump. News of the passing continuing resolution here in the U.S. is still trickling out. Monday, as stock traders jump back in, I would imagine we see more pump as traders feel good about the averted gov't shutdown. This may trickle into Tuesday. But then Wed. is the Fed's day. We are expecting further pause to interest rate. Everyone will be listening to the Fed speak and parsing every syllable that is uttered from J. Pow's tongue. What is says and the bias that is interpreted will be key. I am expecting mostly a non-event here. Which means that bullish bias may wane once again. Crypto, mostly altcoins, really only pump on good news. But negative and even neutral news is a sell to sideways event. Thus, I expect we may hit another local top around Wed. afternoon at which point the altcoin market starts to sell a bit again OR it simply continues sideways again for a few more weeks. Sooner or later though, I believe we are headed towards that 1.3 trillion resistance. It is worthwhile considering to stay in a holding pattern unless we drop below our all-important support. Watch this line closely and draw it on your charts. It will be key!
✌️Stew

Bearish Divergence on Monthly TF but Bounce ExpectedBearish Divergence on Monthly TF.
Very important Support lies around
160 - 162; and a Bounce is Expected if this level
is Sustained on Monthly Support.
Bullish Divergence on Short TF; so a bounce can be seen
up to 177 & then 194 (if 177 is Sustained)

[LONG] STX - STACKS on support and ready for a bounceSTX is another beaten up coin that this year alone lost more than 60% of it's already beaten up marketcap. From the peak on April of 2024 to January of this year STX was already down 50%. Bulls got completely obliterated, but not everything is lost for STACKS: Sitting at $0.75 is now testing (and holding) for second time the previous 2023 resistance, now turned support. A bounce here doesn't immediately mean the end of the fall, but we can catch a good counter-trend move to retest the distribution zone on the $1.44 to $2.00 range
1st Entry: $0.75 (previous resistance, now support)
2nd Entry: $0.65 (most traded zone)
move SL to Break even if price breaks the previous high at $1.00
1st TP: $1.34
2nd TP: around $1.80 or look for signs of weakness in lower timeframes at this area

Bounce Token Goes Bullish (Beyond —250% Potential Target)Resistance turned support. Once the support level is tested and holds, or recovered in this case, the bulls are in.
Bounce Token (AUCTIONUSDT) is now trading above a strong long-term support level. It traded below this level only briefly and now that the action is happening above it we can expect additional growth. A higher low above support is coupled with high volume. These signals combined give further strength to a bullish bias.
I am giving here two targets and one goes beyond 250%. This pair has potential for much more in 2025. It is still early, but soon the entire Altcoins market will start to rise. You have to aim high.
For a pair like this one, there is no going back. The strongest bullish action happened in late 2023. In 2024, growth was weak. This means that this pair can start moving anytime and when it does it will be really strong. The last bullish wave produced more than 1,200% and this was when the market perception was weak compared to today. If a pair can grow 1,200% in a weak year, imagine how much it can grow when market conditions are great.
Rest easy. Cryptocurrency is going up.
Namaste.

Crude Oil / WTI short cheap and good time to bounceVolatility on WTI has been very strong on past years but is narrowing. Especially in past months we can see a seemingly tightening volatility in prices. And we all know what that means right ?!
Correct, a breakout will follow. The questions is only in which direction. A good risk ration is achievable since we are very close to a bounce level / support (green line) and far away from the next resistance (red line). Commodity markets tend to be mean reverting and whenever commodities are cheap it makes sense to but them. Boom and bust cycles. But this is rather a long term strategy.
In any case, breakdown as below:
Entry:
Ideally we would average down the long position down to 67.28 and potentially below, in case price tests areas below.
Exit:
Ideally we would exit at TP slightly before 80 USD to avoid the resistance and the magical strength of full numbers. Something like 79.4 USD should work.
If price moves against us close at SL or once daily candle break below the support and closes.
In such case we could even consider a short position but with tight TP as fundamental dont point towards much lower prices.
Conclusion:
An easy trade can be entered with good risk reward ratio if executed correctly.
Disclaimer: This is non financial advice
let me know if any question.
