BA looking for trendline BA broke down under 200 and 50 MA. High selling pressure across SPY today. I expect it to hit 218 trendline. Under trendline is dangerous short term
This is not any form of financial advice.
Bounce

CHR multiple bear div on 1hr in combination with death cross on SRSI, RSI looking down, and looks like we could see soon death cross on MACD also. So it looks like we definitely going down.
200SMA on 1hr chart is right on 0,5 FIB and near that former resistance level-zone at 0,2714. Also, this former resistance trendline of descending channel is near that level. This all should be more than enough to keep the price from falling further and could be a nice bounce level... If that level is lost, most probably a deeper fall down is in the cards, and we could open a SHORT trade. If holds, and price bounce up, we could be in a good position to open long trade...
I don't have to say that we need BTC to cooperate for this to play out... If BTC pumps up, we have the chance to turn up without this retest, so my entry point, in that case, would be a breakout from resistance at 0.30

SPX: Crashing again! Time to panic?Hello traders and investors! Let’s see how the SPX is doing today!
Breaking the short-term bull trend, the index is seeking its next support levels. We lost the Pennant downwards, along with the 21 ema and the 4,394. The 4,351 is another good support candidate, which is holding the price for now.
Our last support level is the 4,305, and below this point, we might assume the index will engage a stronger bearish momentum for a few weeks.
By losing the 4,305, we’ll confirm the idea that the index just did a Dead Cat Bounce to the 21 ema and it just resumed the bear trend, frustrating the possible bullish reversal to the ATH.
Right now, the index is in a “no-man’s land”. While we don’t see any meaningful bullish reaction, there’s nothing to do. While we don’t see any bearish confirmation, we can’t say it’ll reverse the long-term bullish bias either.
In the weekly chart, we are still above the 21 ema, and we could stay there for a few weeks from now, doing many frustrating signs. Only if we lost the 21 ema in the weekly chart we’ll see something new, and the market could do a sharper pullback. However, this won't be easy, as we have many support levels in the short/mid-term to work with.
For now, let’s just calmly wait for more signs. If you liked this analysis, remember to follow me to keep in touch with my daily updates.
Have a good day.

BTC technical bounce in near futurebased on the logic that the next developing monthly pivot gets hit (as it has the last 48 out of 50 months at least). However this level is only confirmed when monthly closes. price could rise in the next day or drop also altering its development. However based on the current consolidation and price action that is where it is now. It coincides with the weekly range play from L3 to H3 as well. optimal entry possibly as close the L3 as possible with stop on the L4 weekly or L4 daily for a tight stop. we will have to see what happens if it reaches there.
This analysis was done using camarilla pivots on monthly and weekly levels

$FB almost there to bounceWe are almost there with $FB, as you can see the pattern measuring the ATR with Keltner Channels.
My target is the 3rd upper ATR after the before-seen RSI confirmation rising from below 50% and the candle being almost halfway from 1-2 ATR.
However, it might just bounce without touching the 1 ATR level as it did on Aug 04 (see rectangle)

Made Good Recovery Preparing To Bounce BackHindalco Has Made Very Good Recovery And Is Preparing To Bounce Back

$LINK bounced to R$LINK bounced of a pretty solid support level but is now facing heavy resistance of previous support now turned R.
Also right above here we find the 200D EMA.
Caution is needed here!

$AFRM Affirm - Breakout, Retest, Bounce Candidate$AFRM Affirm - Breakout, Retest, Bounce Candidate
Assuming a close at or above $123.70 today...could see a strong bounce into next week.
Near term price target: $140-$145 range
Note: This is NOT investment advice. Educational only.

A great Trend BounceA great trend bounce this morning and created a new swing high. Marked and entered based on candle structure. This is a 1hr markup with a 5min entry.

CHPT Bounce?!I like CHPT!
Tomorrow's daily candle should show us what we need to see. It should bounce on this support and/or consolidate for a few weeks before making a bullish move.
Consider 12/17/2021 Calls.
Stop Loss: $19
Profit Target: $25 (Aggressive: $26.60)
If it breaks resistance, I could see CHPT dropping near the $17 range.

SPX: Key Points you must watch from now!Hello traders and investors! Let’s see how the SPX is doing today!
The index is doing exactly what we said it would do in our previous analysis, as it lost the support at 4,435 (1h chart), turning bearish for a few days. However, it is trying to react, and this reaction came quite quickly.
Since the index lost the purple trendline we knew that the bull trend got weaker, but this doesn’t mean reversal . When this happens, we usually seek the next support level, and in this case, the 4,367 is working nicely. We did a false breakout from it this week, but today’s reaction might indicate that we’ll see a reaction, at least to the 21 ema.
The 1h chart has a bullish pivot point at 4,394, which the index is triggering right now at this moment. This might be the start of something new that will cause the rally to the 21 ema in the daily chart.
If the trend will continue or if this will be a classic Dead Cat Bounce , it is too soon to tell. Let’s just react to the next signs.
If you liked this analysis, remember to follow me to keep in touch with my daily updates, and support this idea if it helped you!
Have a good day!

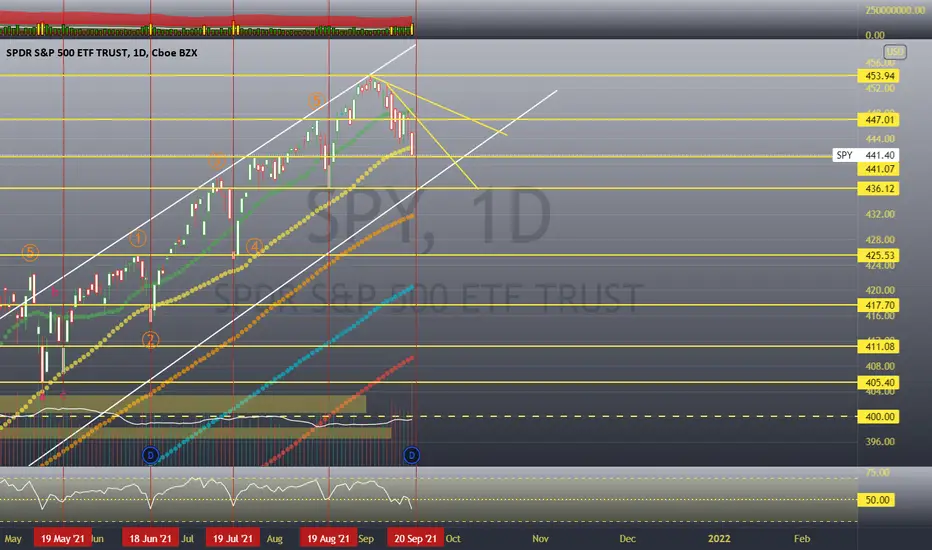
SPY, what's next ! Daily time frame.All eyes on SPY for next week ! With the previous close below the 50day MA, but also confirm below RSI neutral level. Will we see a flush or the casual bounce on the 19th ? (20th this time since theres no 19th)
A bounce could lead to a bump and run setup to all time high or simply a dead cat bounce to die again end of month.
Lets see if we get any news about tapering this week or any other catalyst that could lead into a bigger drop and potential correction.
As mention in the crazy bullish theory, I was bullish all summer long but now it's time for a larger drop to be able to do some shopping !
Très important, tout mon attention sera tourné sur le S&P dans la prochaine semaine avec toutes les potentielles nouvelles de la prochaine semaine. Vendredi passé, SPY a terminé sous la moyenne des 50 derniers jours et sous le niveau neutre du RSI, chose très rare ces derniers temps. Va-t-on avoir droit à une plus large descente ou va-t-on voir un rebond comme on l'a vu lors des derniers mois dans pareil date, qui va résulter en bump and run setup.
Comme mentionné précédemment dans l'idée relié à ce même post (crazy bullish theory), j'ai été haussier pendant l'été, mais maintenant j'aimerais avoir cette correction pour pouvoir magasiner !
A+ trade safe !
Bitcoin is confirming the next Bear MarketHello Everyone,
Quick post for today. After a 20x gain over an entire year, I believe Bitcoin is confirming the next bear market cycle. Here are the technicals:
1. Rejection of the Hull Moving Average: The hull moving average has been a consistent determination in whether we remain in cycle or not. In both previous cycles, we see Bitcoin lose the hull moving average then on an attempt to regain, it rejects or fails and price continues downward.
2. Death cross: After rejecting the hull moving average, there is a death cross of the 20WMA and the 50WMA. This immediately happens after rejection and is another confirmation of a bear market.
3. Dead Cat bounce: There were 2 distinct dead cat bounces right after the fall from each cycle ATH. This is noticeable with the bearish price action: low volume higher price
4. Negative RSI: RSI seems to be going down as bitcoin continued to make highs. This is a bearish indication
5. Weakening MACD: MACD is weakening as bitcoin has another attempt at the 65k all time high.
Although some of you may be discouraged, angry, or depressed the bear market is the best place to DCA and restock swing trade buys. My guess is the bottom is consistent with the 200WMA as it has been the bottom of each of the other two bear cycles.
My plan moving forward is to DCA between the 100 and 200 WMA as well as look for swing trade plays during the bear market.
As always, be patient, use risk management, and good luck trading!

$BTC rally-base-drop reversalMy view on #bitcoin non-religiously considering the simple facts.
Short-term we are going to be ranging between 200 DMA and 21 WMA, with strong rejection from 200 DMA sealing the faith of this dead-cat bounce.
From S&D perspective #bitcoin is now completing the rally-base-drop reversal pattern perfectly.
I will be saving all money I can to buy the 200 WMA.
As said in my previous publications, this is where bulls with balls are being made and the ever running $BTC bull run resumes.

SPY sitting on a support lineJust observing SPY's price action. I have drawn a rising channel which contains the price action for SPY since early last year. Friday we touched the bottom of the channel and closed near it. Looking back, this support line has been tested 8 times before.
One successful crash (red circle)
Three failed break (yellow circles)
Four bounce and reverse the next day (green circles)
Now, next week we will find out what happens this time around.

OLD RESISTANCE NEW SUPPORTWatching for a break 754.80 to start taking some long positions
signs of strength with that bounce on previous resistance

RETEST of highs FB bounced on 9 EMA daily might be going back to highs
watchout for that 378.40 resistance area. needs to break that before going back to the highs

Eth looking for bounceI think this correction in eth was healthy and long term i am still bullish. I expect to reach this cycle atleast $8k

(BA) The Boeing Company bouncing on trendline support BA bouncing on trendline support. Trend started with March lows. I can’t make this up. BA ready for 225 then 240. Look at my last posts for the bigger picture. Breaking under trendline and confirmation of said break would invalidate this trade plan.
This is not financial advice. Do not take any thing i say as any form of financial advice. This is for entertainment purposes only. It is a personal case study I am sharing for entertainment. This is not financial advice.

Bitcoin has and will bounce at these next key points. A MUST SEELook at Number 1, it was a bounce of that spot. Number 2, we just did that a couple days ago to match that spot earlier this year. We will go down to bounce on Number 3.
Then up top at Number 4, I threw in a 'bear-trap' because that is an obv. place for one to be. Some of us know Bitcoin loves to throw those out before 'mooning' and since it WOULD be a real 'bear-trap' before breaking ATH!

Attempt to catch a dead-cat-bounce (be careful)we found a few alt coin short entries over the last few weeks and they are looking pretty good about now now BTC maybe offering us a dead cat bounce. it's a very late entry on the big coin itself but it's what we'd look for after a big move like this so expect a continuation between the 50 and 61.8 retraces

Ethereum is bullish, protect profits don't sell in bull marketCorrection like this is something normal, ethereum looks extremely bullish, send it to 5 keks

Trading the Range - LCIDClear consolidation over the past 4-5 months even after the merger, decent spread between support and resistance as well. Putting some money to trade the range.
