USDCHF - Break of important Consolidation - Where to get in?Hi Traders!
The market is moving in a shortterm Downtrend, but it is actually
in a longterm (daily) symmetrical Triangle.
Please consider the screenshot for more details.
If you have any questions, don't hesitate to write them into
the comments or to make a message.
Also, if you want more information about any detail above.
--
The market broke out of this important Consolidation.
We can see the bearish strength based on the last strong Down-Movement.
But not everyone got into this trade.
And as we don't want to chase the market --> we have to wait for a Pullback.
The question is: Where is the next Area to get in?
Of course, one possibility is to wait for the retest of the Support Break.
But sometimes - or even often - the market doesn't pullback so much
- and especially during times of high bearish momentum.
An alternative is to consider the Trendline.
We have three points from where the market turned (in the consolidation), which are all at one
line - so we draw this descending Trendline.
This could be a possible Entry, which is a logical Entry, a Pullback and on a reachable distance.
Thanks and successful Trading :-)!
Bounce

TATAMOTORS - Near Imp levelsWe are seeing a #sell-off in tata motors post its quarterly results, it has posted a #loss of some 4000 crores in this quarter, the company is still a loss-making company, but it has reduced its losses compared to its previous quarter and is mostly moving towards the profitability in the coming future.
#Charts of tata motors look quite good since we have seen a move of a whopping 468% in the last 1 and a half years, a #correction is quite evitable and is also good for the next rally in the stock.
Currently, #tatamotors are trading near its weekly and daily #support zone of 290-260, hence there is a possibility of some temporary bounce back in the stock.
Reasons of possible bounce back
**Strong multiple timeframe support
**Daily Rsi is oversold: 23
**Hourly #RSI showing positive divergence
For Investors
If correction extended, lookout for price action near 214- 185 levels.

EUR/USD - Approaching Yearly Lows!😲We are approaching yearly lows here on EU. Price is currently trading at 1.1810 100 pips away from the lows of 31st March @ 1.1706. If we see price bounce from this level it will confirm EUR strength after some recent bearish PA. However, if bears continue to push and create a new 2021 low we can anticipate 1.1624 being tested. Keep this pair on the watchlist!

Doge to $1If this Bitcoin bull market continue (that's i believe) i think we can see another capitulation in Doge and after this again FOMO into it and go to $1 or beyond. Sound ridiculous but why not?

Btc......????????BITCOIN seems it is bouncing on the thick orange line....
Waiting to go up till the blue line....then...only God knows....
Still weak in my opinion...


SGOC Bullish Chart PatternLooking for price to squeeze to the ~ $36 area from the current bullish flag pattern its currently in. Great R/R setup.
Just a reminder that I'm not a financial advisor and my trade ideas should only be used for entertainment purposes and tried on paper trading accounts only.

#BTCUPDATE - 15.7.21
ARE WE GOING TO BOUNCE?
No update on the bullish path from yesterday a bounce here will look to confirm a bullish H/S pattern and see a strong challenge of breaking the key $33k resistance.
Losing the $32.2k here though could be devastating though - and a quick fall to $31.5k and then just losing support after support to $30.1k
There has been a pretty tight consolidation since the rejection from $33k which suggests a big move incoming.
We need to get above $33k to have any kind of foothold so right now it is bearish short-term still.
My play is to long to $33k and then use a tight stop-loss - if we break $33k then an ambitious target of $34k.
Losing $32.2k then targets are $31.5k , $31.3k and then a stretch to $30.3k.

$CRV Fire Sale!Back with another $CRV chart lol. As you may know, price action looks pretty awful, especially for alts. I expect $BTC to break to the downside of it's current range and proceed to nuke the entire market with it. Although this unfortunate in the short-term, this will create some amazing buying opportunities for alts, especially those with good fundamentals.
In this chart, I display the previous levels (orange box) which should serve as support as we head for further downside. I also show similar support levels (green box) that correspond to fibonacci ratios in accordance to the 5 leg elliott wave impulse for confluence.
Knowing these levels, I plan on taking advantage of this buying opportunity at the $0.67 and $0.44 levels primarily, with some hail mary bids at $0.33. These levels should at the least provide a significant bounce to the upside imo.
Regardless of the outcome, I am a long-term $CRV hodler as I believe the token is extremely undervalued, and still believe it will reach prices listed on my previous $CRV charts.
As for the bullrun itself, although I may be overly optimistic, I do not believe it is over. Comparing previous bullruns, this being the end doesn't make sense to me, and instead I believe we are having a mid cycle correction/shakeout before resuming but only time will tell.

BTC can follow historical price actionhere i am showing you bitcoin's historical price action after every bull run.. if BTC follows similar pattern like 2013 & 2017 bull run our bottom can be $16000 to $13000 after smaller dead cat bounce by which we can retest around $40000 range.

RUNE $10 again soonHi $RUNE goes back to $10 in 12 days from now btw. Good luck and happy withdrawings 4 sure

CLOV adjustmentI had to readjust CLOV due the reason we broke the support at $11.80.
Now we are in a regression and the next support is $8.90, we have to watch out if we bounce there - I assume yes, but keep watching.

Blackberry BB Looking For a Relief BounceChart says it all. Judging by this analysis BB will likely break down from $12 and begin to test the $11.50 area sometime this week.
BB needs to find support around $11.50 and from there we should begin to see the bounce starting next week.
Targets are:
~$13
~$13.50
This is not financial advice, please always do your own research and analysis. Happy Trading!

Volume Analysis: 💎 Bullish Whales - New ATH In Sight? 🚀Volume Analysis: 💎 Bullish Whales - New ATH In Sight? 🚀
"Last time when the volume was this bullish, it started an epic bull run."
Our previous idea is still valid.
It's another timeframe for the same idea.
So, you can use the two in your multi-timeframe analysis about one idea.
◀️ KEY POINTS:
Last Time When Volume Was This Bullish We Had The Most Epic Bullrun In History
Yearly Bearish Channel Means Sell Pressure & Support At The Same Time
Now The Price Is Bouncing Up From Legendary Yearly Support
Whales Had Months To Consolidate Their Wallets And Emotions Already
How many resistances will this bounce break?
Where could a new bull run go?
What is your opinion?
See comments to see our Side!

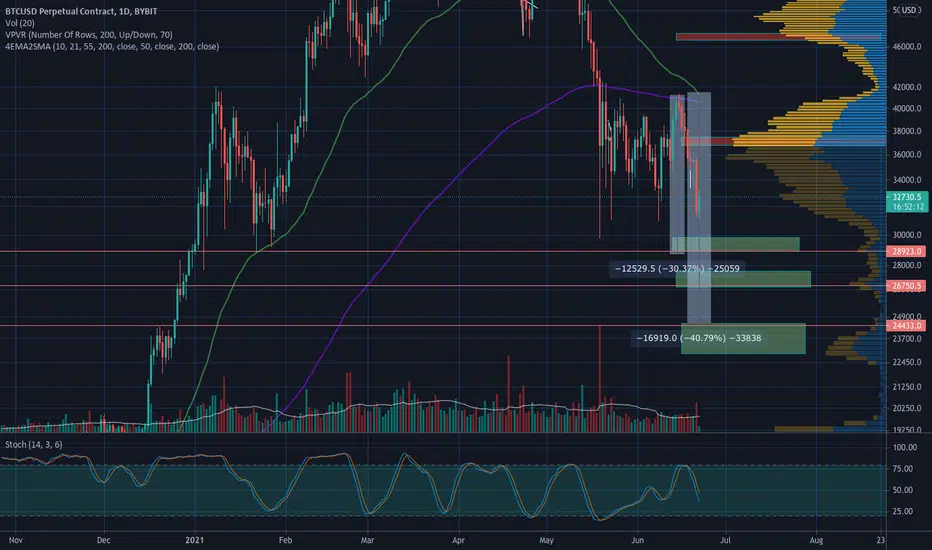
Possible Reversal points for BitcoinWhen we rejected at the 200 EMA on the daily, we didn't think much of it. We laughed at the death cross on the daily thinking it would work as a bullish signal, it did not. And now after China shutting down miners news and that big red candle close on a Monday, most people agree some further continuation to the downside is implied for the next few days.
I hear too many people saying we are going to 20k, which really makes me think we don't go to such an obvious level that some people are begging to buy back at because they have already sold near the bottom. However, there are 3 areas above 20k that I see as support and potential reversal levels.
The first area outlined in the green box is between our last major low at 29800 to 28800 coinciding with our January 21 2021 lows. I am also using the volume profile indicator on the right to find places for where there was a lot of trading happening and use those areas as support, although there isn't much at this level. it is also worth noting that this area would be a 30% down move from the last high we had at 41400.
the next one is between 27700 and 26800. this one coincides with the January 4th low and a couple of days of sideways moevement. The volume profile is a little bit larger there than at the 29 k area but not as convincing as a support level.
the third level and strongest of the supports is at the 24500-22900 area. the volume profile is pretty full there and there was a period of consolidation where we lingered for a week before Christmas. Also it lines up with a 40% move from the last high, and we know how bitcoin loves to dump 30-40% a few times a year.
now anything below that, it would surely go straight to the 20k support level. But like i said, too many people are expecting it and the masses are usually wrong.
This market is meant to be tricky and wash people out. And what a better way to do it than by making a new low, triggering a bunch of stop losses and liquidations, and trapping a bunch of bears thinking we are going straight to 20k.
i do expect the turn around to be quick, and any big daily green candle and a cross back to the upside on the 12 hour stochastics would be a confirmation for a bottom and a huge bounce.
BTCUSD$BTC is at a promising point!
I'll help you read this analysis so that you can truly understand the current market structure.
- Watch how $BTC broke out of that strong 4hr resistance, then came back to retest it. (We expect a bounce from that trendline)
- Watch how it formed an uptrending channel, where it's continuously making Higher Highs and Higher Lows. (We expect this to continue)
Should it fail to hold this level, then we look for the next support zone at 36,5k, if that one fails 35k etc..
If things go according to plan, $BTC bounces now, reaches the EQ (41k) of the channel, bounces back from there then continues up to 45k.

USDCAD Bounced from strong support areaToday USDCAD bounced from its strongest support area (1.192 - 1.211), it acted as a support for more than 4 years.
Now, we're inside a descending wedge pattern, don't take long position before we see a breakout.
My StopLoss is below 1.192 and i would be targeting up to 1.35


USDCNY to Fall Towards the Lower End of the Accumulation The USDCNY continues to find itself in a solid downtrend. This is illustrated by the ADX indicator, which has been threading above the 25-point benchmark since late September 2020.
The ADX reached a peak around the time the price action fell to the upper boundary of the last Accumulation range at 6.4700. Afterwards, the price went on to establish a false bullish rebound.
The latter materialised in a Dead Cat Bounce pattern, which typically represents a temporary break in the development of a broader downtrend. The pattern failed to strengthen above the 20-day MA (in red), which is why the USDCNY was then able to break down within the Accumulation range.
That is why the strength of the underlying Markdown - an essential component of the Wyckoff Cycle - appears to be waning down, as underpinned by the ADX indicator after February 2021.
This represents an early signal that the USDCNY is once again getting ready to consolidate in a new range. Before this can happen, however, the price action looks poised to fall to the Accumulation range's lower boundary at 6.2650 once again.

TAL - LONGBeginning to accumulate a small position here. Downside move is overdone imho. Could some bounces and retests of the lower levels.
- NFA

Bullish on Cryptos recoveryHi,
The sellout was expected and I presented a basic chart for BTC months ago based mostly on a macro view showing that.
Now the same way I was bearish then, I am bullish now. I think in the year of trillion dollars per month printing, there is no reason why cryptos would keep selling here.
As you can see in the Total Market Cap chart, we have not only hit the 50% retracement from the beginning of the last impulse since last year, but we are also bouncing in the 200sma. That is quite a combination IMO.
I think we will trend higher from here.
We will see if it does soon.


Its looks like dead cat bounce in chart!This can be false at all,i think like this and i dont like it :D
