ETHUSDT nice breakout on monthly resistance 🦐ETHUSDT nice breakout on monthly resistance (purple rect), and now the price could retest the previous resistance.
The price could bounce on 0.5 - 0.618 Fibonacci level and create another impulse towards the next weekly resistance (red one, left chart).
According to Plancton's strategy, we can set a nice order
–––––
Follow the Shrimp 🦐
Here is the Plancton0618 technical analysis, please comment below if you have any question.
The ENTRY in the market will be taken only if the condition of Plancton0618 strategy will trigger.
Bounce

UBER Support Bounce$UBER currently at a strong support zone. Looking for $UBER to bounce back to $34. UBER

USDCAD - Expecting a Consolidation - Another Trendline BounceHi Traders!
The market is in a Downtrend.
As always, let's begin with the daily Timeframe:
You can see a descending Wedge (with one bearish Fake out).
Consider the distance between the Trendlines: It is getting tighter and tighter.
Because the market has fallen very much and reached now an Area of neutrality, we expect a consilidation now.
Let's move on to the next Timeframe:
The price is now at the lower Trendline.
It is bouncing back from upwards it to reach the other side.
Because the market is in a Downtrend, we don't recommend to trade the Upmovement towards the upper Trendline.
We will trade the bearish Bounce from the Trendline.
Let's move to the Entry Timeframe:
Here we see an orange box.
We call it the "Area of Concentration".
We're here waiting for a Trend Reversal Pattern.
This could be the Engulfing Pattern, a Doji-Pattern, etc.
We recommend to trade the pair patiently, because it is a Longterm-Analysis.
Thanks and successful Trading :)!

NASDAQ breaking highs soon
NASDAQ is in a strong uptrend.
A rejection at current bearish orderblock is visible, so a retracement to the last bullish OB and following break of the highs is expected.

USDJPY - Upcoming Selling Movement - Trendline Bounce Hi Traders!
The market is in a longterm Downtrend and in a shortterm Uptrend.
As usual, we like to begin with the overview. Here is the daily Timeframe:
So, as you can see it is at three main Levels which could push the price even lower:
Trendline
The market is at the (purple) Trendline and normally will pull back from it.
The break of the Trendline is possible, but the chances are low at the moment.
50 Exponential Moving Average
This is the only indicator we know, that even Price-Action-Traders look for often, even they don't trade indicators.
So, in general is the 50MA very important.
Not only retail traders but also Trading Expert Advisors use them for their entry.
That's why we expect a Pullback from there.
Resistance
The Resistance 106.800 is a Supply Zone.
Support and Resistance Traders will probably trade this oppurtunity.
Now move on to the lower timeframe; here is the H4:
It was moving in a consolidation box.
Then it broke out bullish and reached the Trendline.
Now we expect a Pullback towards the Top of the consolidation Box.
Finally, let's move to the Entry Timeframe (main Picture):
Now you can use the Entry Method you like if it is building up.
You can trade the Break of a potential Trendline, Support or you wait for a Retest etc.
We recommend to set a TP in a conservative place due to the high bullish Price Action.
Thanks and successful Trading :)!

ASTBTC breaks an ascending channel 🦐ASTBTC breaks an ascending channel after the price bounced on weekly structure (red one) and daily structure (blue one).
Now we are waiting for a confirmation According to Plancton's strategy, we can set a nice order
–––––
Follow the Shrimp 🦐
Here is the Plancton0618 technical analysis, please comment below if you have any question.
The ENTRY in the market will be taken only if the condition of Plancton0618 strategy will trigger.

GBPUSD - MTFA! - Weekly Trendline Bounce - Price Action BehaviorHi Traders!
The market is in a longterm Downtrend and in a shortterm strong Uptrend.
Let's look at the daily Chart first:
As you can see it is making lower lows and lower highs.
In addition we can see here a descending Channel.
The next main Levels are also drawn on this timeframe.
Consider the position of the price at this moment; it is at the upper Trendline.
We're expecting a Pullback, to break - later on - the channel (Longterm Plan).
Now we move on to the next H4 timeframe:
So, here we can see a strong Uptrend.
Look at this behavior of the market:
When the price reached the Trendline firstly, it bounced back immediatly (normal behavior).
Then it came back to try to make another high - but it failed to do it.
That means, that the bullish Power is weak now and the bears are getting stronger for now.
It made a double Top and is now retesting 50 MA.
The target is the next Support and Trendline.
Now we go to the Entry Timeframe:
It is at a temporary Support and is bouncing back now.
That's the time we will enter the trade.
We recommend to short at the orange box when a Reversal Pattern (false Break, etc.) appears.
Thanks and successful Trading :)!

GVTBTC nice bounce on 4h structure 🦐GVTBTC had a nice bounce on 4h structure, now we are waiting for a breakout from dynamic trendline (blue).
According to Plancton's strategy, we can set a nice order
–––––
Follow the Shrimp 🦐
Here is the Plancton0618 technical analysis, please comment below if you have any question.
The ENTRY in the market will be taken only if the condition of Plancton0618 strategy will trigger.

USDCAD - Strong Trend Continuation - Trendline Bounce & BreakHi Traders!
The market is in a Downtrend.
As always, let's look at the Daily Timeframe first:
So, we can see the market is strongly respecting the Daily Trendline.
We can identify the Trending Moves and the Consolidation Stages.
Pay attention to that the market is now near the Trendline again.
Now we switch to the main (H4) Timeframe.
The market is falling down after the consolidation.
It has fallen until the next Support and bounced off fastly.
Now it is in a Retracement move of the overall Trend.
It is here in a potential Channel (still need an upper touch to finally confirm it).
The Trading Idea is: Sell the bearish Breakout of the Channel / lower Trendline!
Here are some additional confirmations:
Market in an overall Downtrend
Market at Daily Trendline
200 Exponential Moving Average showing bearish Power
We recommend to trade the Breakout with a confirmation.
Thanks and successful Trading :)!

AUDSGD has been a nice reaction on 4h support 🦐AUDSGD has been a nice reaction on 4h support and now looking for a nice long
According to Plancton's strategy, we can set a nice order
–––––
Follow the Shrimp 🦐
Here is the Plancton0618 technical analysis, please comment below if you have any question.
The ENTRY in the market will be taken only if the condition of Plancton0618 strategy will trigger.
TSLA: Will The Structure Sustain?TSLA
I made an argument earlier this week that since the last 'golden cross' in late March, TSLA stock price always bounced off of the 200 MA level in an hourly time frame. "When is the next bounce?", I asked. I believe we are at that point now.
The question now is that if the current market condition will allow for this structure to sustain. Let's hope the structure sustains and we get to see a bounce up today.
Good luck and happy trading!!

Massive dead cat bounce?Is stock market actually in massive dead cats bounce? I compared current situation to 1930's crash, and mapped the possible bottom. If we are in dead cat bounce, then the real bottom is way below current price.

TESLA: When Is The Next Bounce?NASDAQ:TSLA
DISCLAIMER: This is not a "technical analysis" and more of a "hypothesis" for my future inquiries with this stock. I am personally an optimist for the EV industry and hope for it to grow.
TESLA stock price seems to respect the 200 period simple moving average in an hourly time frame. Since the 'golden cross' in late March, March 30th to be exact, the price has bounced off the 200 MA at least 'ten' occasions. Even if I don't go into all those pessimism regarding the company's fundamentals or overvaluation and stick to the simple trend analysis, the question remains: "when will be the next bounce?" Or is it a break of structure?
If you find this interesting then please let me know your thoughts. I will be posting more in this topic in the future.


180-240% profit bounceExtremely risky trade, because RSI div is not yet confirmed, but on a smaller time frames, there are an indication for a bounce, buying volume started coming in.
TARGETING .382 and .5 fib levels
Stop loss very very very tight below ATL

GBPUSD - Trading the Up-Movement - Trendline BounceHi Traders!
The market is in an Uptrend.
As you can see the market is at a Daily Resistance.
That is the barrier it has to BREAK to reach the next Level.
This idea is a combination of a "Bounce and Breakout".
These Structure Levels are supporting the idea:
The (pink) Trendline which is giving Support and giving pressure to the price.
The 50 Exponential Moving Average which is highly respected by Traders and Trading Robots.
The SL is under the Trendline.
The Target is below the next Key Level, where a possible Change could come.
We recommend to close the Trade when the Price don't break out of the Resistance.
Thanks and successful Trading :)!

GO/BTC 50EMA bounceFirst cloud edge to edge successfully completed. Betting on 50EMA S/R flip here, then continuation.
Resistance levels, based on flat cloud zones, are highlighted in the chart. SL - 112 sats .

Support BounceWaiting for another bounce, I personally caught this first bounce for around 11 pips. If it bounces again that will be enough confirmations for me to enter a buy.

GBPUSD: Entering a key decision zone!Good Evening!
GPB/USD is entering a key zone as you can see from the chart it is in an upward channel, approaching the bottom and currently in a ket S/R zone. I caught 156 pips on the move down and will be waiting to watch the price action before confirming whether this will be a long or short entry!
RSI is showing it is oversold so could line up well for potential long.
Im expecting price to potentially retreat back to the trendline before coming to the bottom of the channel, I will wait for either the bounce of the bottom of the channel to take a long position or the break and retest of the channel before entering my position.
BUY: If this does become a buy trade I will most likely be expecting price to rocket up to around 1.28 before exiting the trade.
SELL: If this becomes a sell trade I will likely look to exit around 1.207
Let me know what you think and if any of you guys caught some pips on the way down!
Thanks.

USD/JPY - SELL OFF On Trendline ResistanceHello Traders!,
We have hit our mid-week analysis for this trading, USD is still showing us signs of further weakness, possibly for further weeks to come.
What Is The Market Telling Us?
We've been in a healthy downtrend for 3 weeks now, market is showing no signs of a reversal as our trend resistance is being respected
Trendline resistance is being respected for the 4th time, we have bearish confluence with a strong bearish pinbar reacting to our resistance
Overall trend s bearish, lets take full advantage of this current USD weakness in the market right now!
When Should We Enter?
Since we've just had a bearish pinbar candlestick pattern appear exactly on our trend resistance, SELLING now would be recommended
If we are being more conservative and want to wait for more ocnfirmation, sell once there is a bearish closure below our trend resistance

LONG - LOOM - Trading OpportunityAfter all is said and done, BTC seems to be calming down, and now this is the opportunity to pick up some cheap alts. Bullish Divergence along with MA200 support on BINANCE:LOOMBTC , hoping for a close above for some confirmation before going in.
Entry: 0.00000216
Target 1: 0.00000249
Target 2: 0.00000268
SL: 0.00000205
CryptoCue is not providing investment advice and is not taking subscribers’ personal circumstances into consideration when discussing investments. Investment involves a high degree of risk and should be considered only by persons who can afford to sustain a loss of their entire position.
CryptoCue is not registered, licensed or authorized to provide investment advice and is simply providing an opinion, which is given without any liability or reliance whatsoever. The information contained here is not an offer or solicitation or recommendation or advice to buy, hold, or sell any security. CryptoCue makes no representation as to the completeness, accuracy or timeliness of the material provided and all information and opinions provided by CryptoCue are subject to change without notice and provided on a non-reliance basis and without acceptance of any liability or responsibility whatsoever or howsoever arising. You hereby irrevocably and unconditionally waive, release and discharge: (a) any and all accrued rights and/or benefits you may have against CryptoCue in respect of any opinion expressed or information conveyed by CryptoCue at any time; (b) any and all Claims you may have against CryptoCue arising out of any opinion expressed or information conveyed by CryptoCue at any time; (c) CryptoCue from all and any claims (whether actual or contingent and whether as an employee, office holder or in any other capacity whatsoever) including, without limitation, Claims you may have against CryptoCue arising out of any opinion expressed or information conveyed by CryptoCue at any time. ("Claims" shall include any action, proceeding, claim, demand, judgment or judgment sum of whatsoever nature or howsoever arising.) You hereby agree to indemnify and hold harmless CryptoCue in respect of any and all Losses paid, discharged, sustained or incurred by CryptoCue in the event of bringing any Claim against CryptoCue. (“Losses” shall include any and all liabilities, costs, expenses, damages, fines, impositions or losses (including but not limited to any direct, indirect or consequential losses, loss of profit, loss of earnings , loss of reputation and all interest, penalties and legal costs (calculated on a full indemnity basis) and all other reasonable professional costs and expenses and any associated value-added tax) of whatsoever nature and/or judgment sums (including interest thereon).

NZDUSD- Long Opportunity on the bounce of the Trend line!-Very good buy setup on the bounce of the ascending trend line.
-Looking for price to potentially hit TP levels of: 0.65018, 0.65688 and 0.66209.
-A confluence which suggests that price has a higher probability to move to the upside is that the supply zone is in line with 23.6% fib level. This means that price could react around the 23.6% zone well which gives me confidence that bulls will take control of this pair.
-Another confluence is the 50EMA is below price which shows that this pair is in a bullish trend and should look for long opportunities only.
-Looking for a breakout the supply zone and retrace back to the zone to enter a long position.
-Wait for a strong bullish confirmation to enter a buy on this pair.
Let's see what happens during the week!
Make sure to follow, like and comment your ideas/opinions on this pair.

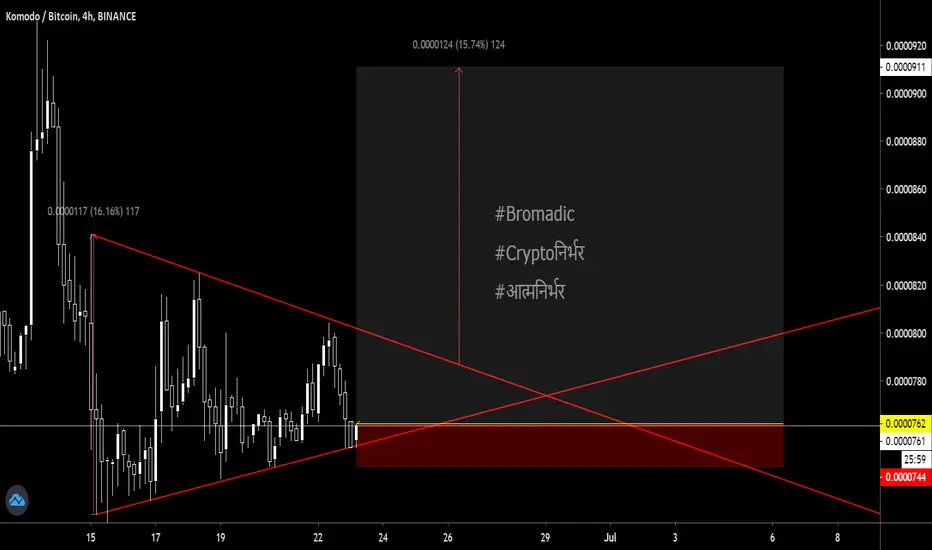
#KMD - re-evaluateso as I said in the morning for this previous setup
have to re-evaluate here's the updated setup
I am still long currently running in a small loss, all looks good still, support is holding