PYPL Forms Risk of Top FormationPayPal broke to the downside, then bounced up on a strong upside market day. However, the gain of the bounce is weaker in volume and price pattern than the previous downside black candlestick. It has weak support to the downside all the way to the red line.
Bounce

This is my play book for EthThis is my playbook for eth at this time bitcoin will be the only factor that changes my outlook

CRM Bounces Off Moderate SupportSalesforce.com formed a Rounding Top that broke to the downside. However, it did not complete the Rounding Top Formation yet, as it bounced strongly off of previous monthly highs.

BTCUSD - 5 Waves then bounce?Anybody reading me knows I have been following this multi-year baby blue trend-line for quite some time. After the price broke above it last time it came back down to kiss it and then took off to all time highs. ($20K) My expectation is for something similar. As you can see in this chart there may be a 5 wave move down to the line on the 4 hour chart. If this holds, the RSI, MACD, Stochs, etc. should have pulled out of oversold enough to fuel the next bull run North. This is my current line of thinking but anything could happen. When I say hold I don't mean a spike low through the line only to quickly recover. If it is to fail we need see a couple daily closes below the trend. If that happens I will reevaluate to see if I have the line drawn as accurately as possible or assess that maybe something else is going on.
Good luck this week!

BTC market bottom? descending channel reversal possible
this could be the temp bottom for the day and a nice bounce could occur with such a large drop
im trading these two not btc market my entries

SPY bounce to 280 resistance SPY looks good for a possible bounce (to 280) even with the QQQ sell off today. The oversold readings and the falling wedge help solidify the bounce with a breakout of the wedge.
Note-SPY bounce will only occur to full measured target IF QQQ and tech hit their selling climax. Otherwise it will be another sell the bounce event.
This should be a bounce within a downtrend with a continued reversal away from 280.

LONG ABOVE YESTERDAYS HOD30/May/2019 10:15 AM
INCREDIBLY WEAK NAME HERE.
LONG AS LONG AS ABOVE YESTERDAYS LOW. SMALL POSITION SIZE, TARGETING A V BOTTOM.
ODDS OF SUCCESS ARE SLIM TO NONE GIVEN THE HISTORICAL WEAKNESS OF THIS NAME.
NOT ACTUALLY TAKING THIS TRADE. BUT LOGGING THE IDEA. REALLY IS POOR RISK MGMT TO GO LONG SUCH A WEAK NAME AND SECTOR. BUT MOMO IS THERE WHEN THIS DOES SWING THE OTHER WAY, THUS THE INSPIRATION FOR THE IDEA.
IDEA WOULD BE TO MANAGE ON THE 1 TO 4HR TIMEFRAME.
--
MASSIVE VOLUME YESTERDAY. AND RECENTLY. SOMEONE IS GETTING INVOLVED OR IS OFF LOADING. 1 OF THE 2. IM NOT A VOLUME ANALYSIS EXPERT THOUGH.

Long Idea on the daily have a diamond bottom pattern.
offers RR here.
Target would be a fib. That is most reasonable. Stop below recent lows.
Is a momo based trade. looking for momo to come in to the upside.

BTC-USD Small correction before 9500Confirmed bearish RSI divergence ( thin black line ) is pushing BTC little bit lower.
Support created by bottom of huge trend channel ( green ) is a right place for another bounce from 8400 to 9500 area.

US30 SHORTPrice ranging in between liquidity zones give you clear areas for entries, as you can see price is on its way down to the green zone which is a strong area of liquidity, we can expect a fake move to the downside once price hits this zone which will pick up peoples sell orders right before price reverses and heads back to the upside.
Look at charts from different perspectives, price always comes back to where it has always gone.
Secure the bag and trail your stop loss because everyday is Moneyday!
Follow me on instagram - Vellly
Instagram - Learnitempire

GBPJPY BUYThere was big breakout that is currently correcting. I think it will bounce and go from the 30EMA which also lines up with a reactive support.


Bitcoin counter trend bounce on DailySame set-up as my other post on the Weekly, but this is Daily.
1- We have a strong level
2- We have divergence
3- We have heavy volume picking up compared to the previous volume
Notice how price moved back to the Weekly open at 7000 area yesterday.
Bitcoin is not immune to charting. It is very volatile and can move, but charting does show fear and greed at points of interest.

Bitcoin counter bounce trade set-up clear on the WeeklyI was doing these kinds of trades in early 2018 before the coin market tanked. Works great in high volatility. Don't be scared to catch a falling knife with the right research and patience.
1- Find a level - multiple confluence of levels are best
2- Look for divergence for possible change in direction
3- Look for higher volume bars compared to recent preceding bars that were lower volume.
Hit rate is high on these if you are not greedy. Balls of steel also needed to counter against heavy volume, but with the right location, you can grab from the market.

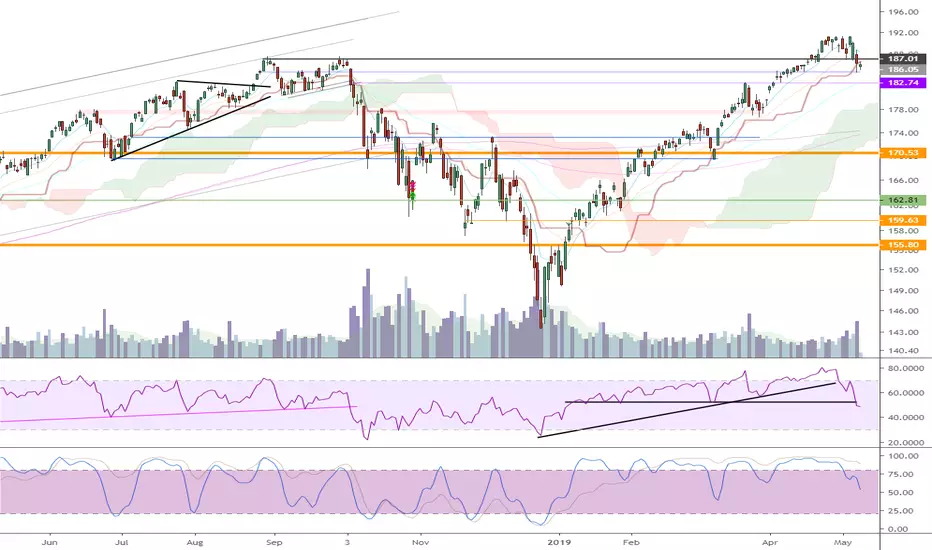
RR based idea in a beaten down sector16/May/2019 11:25 AM
--
RR based long idea here.
Likely hood of this working is very low, given the absolute lack of strength in the sector and this name.
EV/EBITDA valuation on the low end here as well.
======================

XAUUSD GOLD Bounce GOLD MAY REJECT PRICE AT THE RESISTANCE. IT CAN BE A VERY SMALL BUY BUT OVERALL A BETTER SALE. BEST TO WAIT FOR THE PRICE TO REACH RESISTANCE.

Reversal trade idea10/May/2019 12:48 PM
--
market in interesting conditions rn
so who knows what this will do. And Ive also never been able to do anything right with the financial stocks.
--
but. RR is considerable here if the stock can trade in range here.

QQQ BTD8/May/2019 09:50 AM
--
Trin is below 0.7. Tick is positive. Market is holding.
Potential area for one to consider buying the dip. I will not be buying this dip however. I dont understand the current macro climate enough.
When in doubt stay out. But learn what you can from what you see.
--
If we do close negative for the day would not be a good sign.
Watch the horizontal RSI level on the daily.
======================
AUDUSD 4h shortStrategy: pinscher
Signal: 2 bar pin
Order: entry point was @0.69805 but as I got in very late, got a much better price, a bit risky but met all my rules.

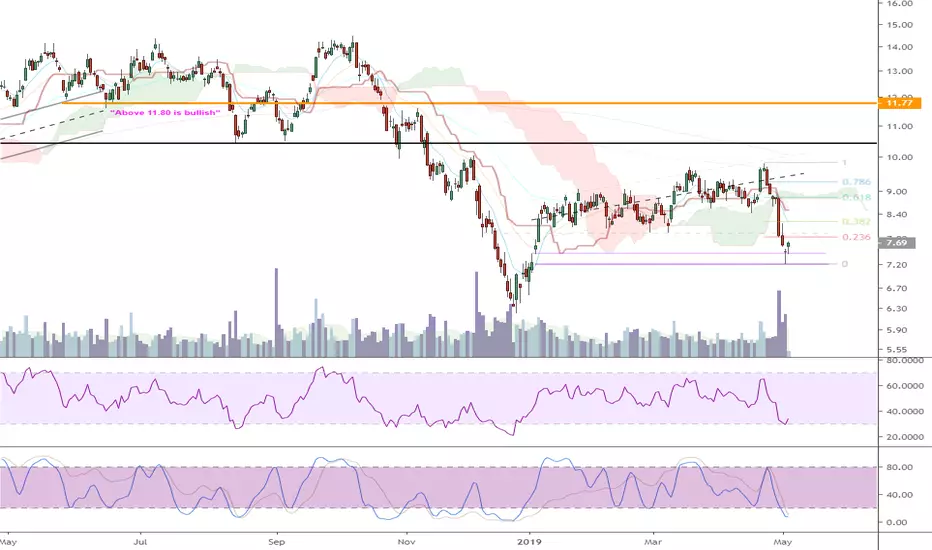
Mean reversion momo tradeCould get a small move to the upside here with a small hold timeframe in mind.
If momo is to follow through here wouldnt be a bad place to put on position with the risk defined.
Above the second purple level is constructive for a retracement higher.
--
Energy sector has been a horrible sector to put your money in for some time though.
ADA/BTC | Potential Bounce Coming UpADA/BTC is overdue for a bounce I believe.
We can see some nice bullish divergence on the higher timeframes.
If the resistance around 1370 sats breaks and acts as a support, I think we might see a retrace to the 0.382 - 0.5 fib levels.
Bitcoin might ruin the party if it drops below 5300$ though.


