Bounce

Xbt fail to reach solid ground.... what to expect now?I'm using xbtusd since that's what i trade, a few days ago it failed to break the resistance at 5378 (today at 5338), i think it should retest it a couple more times before either breaking that resistance (and aim to the 7300's zone) or bouncing down hard to visit some supports (3330, 3121, 2391, 1676) but in the meanwhile, i think we are starting a downtrend and will see some downward movement (my monkey on the beach indicator 1h just sent a short signal - the previous signal was a long on March 27) i think we will find a bounce zone between 4569 and 4728 before trying to retest the 5300's resistance, if that bounce zone fails, we might be lucky if it stops at the 4200's because we might be visiting the lower supports I mentioned earlier
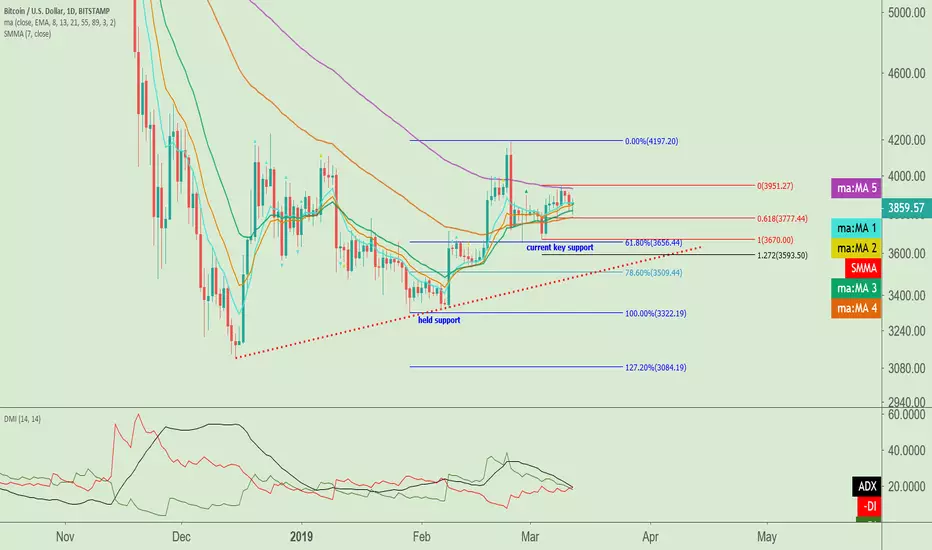
number wont be exactly the same in a couple days, the problem with moving averges is that they keep moving :D
happy trading everyone!!

XRP / USD - 700+ DAY SUPPORT - NEVER BROKEN - CryptoManiac101XRP / USD TA
From a quick TA we can see that we are sitting on a 700 + LONG DAY TREND LINE which is also being used as support. Within those 24 month, it has never been broken downward, instead we constantly see bounces occur off it as well as immense consolidation can be seen here.
What should we look forward to?
Bounce. That's simply it, the TA indicates for a strong upward momentum that's coming which would push XRP well over 1 dollar. It is difficult to pin point a day or an hour of when this bounce may occur, but it's safe to say that unless this support breaks, DO NOT SELL YOUR XRP.
There's a lot happening in the background of all of this which many will never understand. DYOR and enjoy the ride ; )
Take a minute to look through other relevant XRP, BTC TA charts below

AUDJPY Possible long position as recent bounce on trend line
Possible long position due to recent bounce off trend line.
Would like to see price rise above both EMAs AND also a bullish EMA crossover would be nice!
Watch out (firstly) for the resistance area of 79.250

GBPJPY - Still bullish Hello,
We are bouncing on the 0.618 on the daily chart. It is a bullish sign for me, as even the bad news of this week didn't managed to push deeper that pair.
Entry : 144.30
Take profit : 149.02
Stop : 143.73
Risk/Reward ratio : 7.7
Historically, the pair is still at a very low level. It could be a nice long, especially if we get good news in the coming weeks about Brexit.
I aim for a retest at least of the previous top around 149.
MACD just resetted to 0 level, it's a healthy move if it bounces up here.
If you made money on this trade, please mind dropping a like :)

BTC short-term play to the upsideThis is just a short-term play.
The price is holding at the confluence of support when it should have nuked through it right away after coming out of such a large (and long) consolidation.
Never ignore what failed breakouts tell you.
They are just as important as real breakouts in determining where the price will make its next move.
Looking for the support in 3900-3860 area to hold (and offer attractive entries, ideally in 3885-3860 area for best R:R).
Targeting 3980-4000 area.
I don't want to see a 4h candle close below 3830 for this setup to remain reliable.
My previous (medium-term) analysis linked below still applies, but as we know, the price doesn't move in a straight line, and it will have short-term retracements until it eventually makes its way to a higher timeframe demand zone.
Depending on the type of a trader you are, these smaller moves can still be played for nice profit.
It's important to be aware that the larger timeframe momentum is towards the downside, which technically makes this a counter-trend trade.
Previous BTC analysis for the medium-term (still valid):

NIO Bouncing Off Hard SupportPlenty of bad news coming out on this one. Cancellation of a factory in China, reduced government funding for electronic vehicle (EV) development, and profitability going ever into the abyss.
If this thing behaves anything like TSLA, we could see a nice bounce here. But why?
The EV space is rife with optimism and hope due to the disruptive nature of its products. Much like the internet disrupted traditional brick-and-mortar retailers and telecommunications companies, electronic vehicles threaten to disrupt traditional gas-powered transportation. Looking back on the performance of Amazon, Apple, Microsoft and the like over the past two decades, and considering their role in disrupting and creating markets, it is no wonder why investors associate electronic vehicles with a potentially bright future of massive returns. Disruption creates opportunity to take or create markets.
Yet there still remains the fundamental problem of profitability. If a company cannot turn a profit, how can it hope to be successful? Looking into the past, Amazon itself was unprofitable for the first 14 years that it was listed on the stock exchange, yet it was able to survive and thrive on the back of debt financing, steadily increasing its revenue and expanding its supply of collateral (equity). Regardless of the negative fundamental picture for new and disruptive companies, and the risk it poses on their survival, investors often look at them as massive opportunities.
For a stock like this, throw fundamentals out the window - this is the realm of human psychology. Hope, fear and greed will drive the price into insane extremes, and timed correctly, can be quite profitable. The only fundamental here is this: can it continue to acquire debt?
With all of that said, there is a setup to go long here. Hard support sits around 5.5 with plenty of upside on hopes and dreams beyond.

Boeing Will Misdirect the BlameThe game-plan since December has been to prop these markets up at all costs; the PPT joined with the 6 largest wall street banks, Trump called a "buy the dip", the FED turned dovish, and off to the races we went.
For the DOW to continue higher, they need Boeing to be propped up. I envision a classic blame misdirection onto GE/Safran, the manufacturer of the LEAP-1B engines used on the 737 Max 8. Alternative, the pilots are blamed.
Besides offering what appears to be a conspiracy theory, consider the reaction we have seen off the support at $370. Another support sits at $360, and yet another at $330. The 100-day VWMA sits at $363, just between the two long-term supports. CCI and RSI are at historically oversold levels. There are a ton of institutional buyers under this bad boy, and nothing short of the truth (God forbid) will stop it from going up.
I am looking for BA to stabilize around $360 to go long - no need to jump the gun.

Death cross on weekly chartThe death cross on weekly chart and a slight bearish divergence shows us s bigger probability of breaking on the downside and retesting lower resistance zones. Expect a retrace till rsi reaches the 30 levels, for a double bounce, just like in previous bear market. Bearsih short term but bullish mid term

FOMC Bounce SetupSome slightly bearish indicators to start the week off.100-hour VWMA has essentially been flat for almost two weeks, bearish divergence on the 100-hour CCI and fisher transform.
Looking for a pullback to or below the $279 level before going long SPY/QQQ April calls for the FOMC meeting. With the FED, the president and the banks working in coordination to backstop any correction in this market, we can expect more of the same. Bond yields continue to be suppressed for a reason - to push cash out of bonds and into stock.

APC LONG - CLEAR SUPPORT AT 40$ (WEEKLY)Anadarko (APC) has shown a clear support at 40.00 and are now looking to bounce back up. With MACD moving into bullish momentum and RSI being oversold, together with the Parabolic SAR being below the price, we have a clear buy

GBPJPY probable bounceEMA50 is acting as a support, we'll use it a stop :)
MACD reset properly.
RSI neutral.
We might be ready for a new leg up !
R.R : 3

BITCOIN GOT VALID SUPPORT ALONG CHANNEL PREDICTED Bitcoin just bounced from the support as I charted 2 days ago in the idea "Bitcoin's Support, Resistance & Ascending Channel for Next Week".
The Ascending Channel is maintained pretty well, while the upper Resistance is lowered a bit to 4000 USD (Bitfinex:BTCUSD).
A new Trend Line is added, which might be a new Resistance.
Before the bounce, OverSold(Blue) appeared in 30m & 42m, indicated the strong support.
To understand how OverSold is defined in "9 Seasons Rainbow Indicator", and to try DEMO on your favorite assets,
Please check the underneath Resources.
Details can be seen in 15m Chart
##################### DISCLAIM ###################
This is only a personal opinion and does NOT serve as investing NOR trading advice.
Please make their own decisions, carefully assess risks and be responsible for your own investing and trading activities.

Possible Penny Stock Bounce Set Up(OTC:PHGRF) recently experienced a large sell off with the RSI moving into oversold territory. CMF has held steady during this price decline indicating that investors are not rushing for the exit during this pullback. As (OTC:PHGRF) reaches a support level in the mid .50s the RSI and CMF appear to be signaling a possible bounce from these oversold conditions.

Momentum is dogshit, but like the wick bounce from the red 61.8%The 55 EMA is support and the 89 EMA is resistance and more sideways action likely
GBPJPY | Theorised MoveAfter last weeks move downwards (as predicted) I am now expecting a short-term bounce (1-Day) off the current support level to create a "Relief Candle" (also known as a pullback) before continuing downwards. As we know, next week is a big week for the GBP as the parliamentary vote is in place so be wary of this is you are planning to enter. If market gaps up, I would expect it to continue the move up for the day which'll give shorts an entry.

Silver Hitting Strong SupportIndicators point to a bounce off of low risk entry.
Look at all that sell volume that hits like a hammer - smells like opportunity. Hitting the strong support of 15.00 on dying volume. CCI, RSI and strong support are on favorable terms for a low risk long at this position. Banks love dumping those futures to acquire physical at the cheap.

GBPUSD correction doneI had a bearish bias for this pair, but if EMA100 hold (1hour to finish current candle + 4 hours to see where the next one heads to), we can expect another leg up !
BUY : Now
SELL : 1.33 (or higher depending on the impulse strengh)
STOP : 10 pips below EMA100
Key points to watch : Next candle direction, and tomorrow US Payroll and Employment report
Feel free to like to support me if you made a bit of money on this ;)

NZDCAD Consolidation Bounce or Break?Daily
Price has approached the top of its consolidation range, and has formed a spinning top candle, a good sign of Indecision. Since it is in consolidation, this could be a sign of another bounce moving price to the lower bound of the range.
4 Hour
Dropping to the 4 hour, we don't have signs of much bearish potential. There are signs of bullish potential instead, as there are strong bullish candles. There is currently a market structure level 0.90470 which has 5 consecutive rejections.
Summary
Looking on the Daily, it has potential to turn bearish, however the 4 hour doesn't look bearish at all at the moment. Will be waiting for more signs such as bullish rejection and indecision, or a strong break and close below 0.90470, showing a change in market structure.

NZDUSD preparing next leg upNZDUSD is bouncing on EMA100 to finally close above. This is a bullish trigger to me, and if not, we have a very good RiskReward ratio ! :)
Correction is supposedly done, let's see if bulls take the handles back ;)
Beware of tomorrow US GDP announce, it might invalidate this trade.
Good luck !

BTCUSD has a high probability for second bounce to 3960.BTCUSD, ETHUSD, LTCUSD, EOSUSD have OverSold (BLUE) signals in 9 Seasons Rainbow Indicator, which indicator they get valid support from yesterday's bottom. The pullback of yesterday's bounce has completed. There is high probability for BTCUSD to reach the previous height at 3960 before breaking down the support of 3870. The other altcoins should have similar price activity.
The time frames of OverSold(Blue):
BTCUSD: 15M
ETHUSD: 15M
LTCUSD: 21M , 30M
EOSUSD: 15M, 21M, 30M, 42M, 1H

APPLE (APPL): The biggest dump in historyAPPL has suffered the biggest dump of shares in its history. Price has bounced back by still less than a 38.2% retracement (at this time). Now price is struggling at a key inflexion point. Will APPL recover? I don't know - as I cannot see into the future. The probability estimate at this time is further downside eventually on the weekly to 3-Daily.

[KEY/BTC] Bounce Time ! RSI Oversold Bounce Time! RSI Oversold
Buy Now: 70 Sat's
Sell @ 80 Sat's
Regard's Trading Wizardz.
