Bounce


AUD/CAD BOUNCE OR BREAKAUD/CAD currently sitting at resistance. Wait to see whether price bounces or breaks from this zone.

NDLS for the studentSpring semester is upon us... Could this be a strong bounce, or a slow and confusing moment? Hammer head forming today with a strong resistance level at 7.56, would ideally like a good reversal up to 8.40, I guess I'll sit and wait to see what happens now. uc.

Bear trap before a dead cat bounce?Good day Traders
Bitcoin has been battling with our DMA50 resistance, is now printing hidden bearish divergence on the daily, and we have potential for bearish DI cross looming.
The recent short squeeze managed a 38.2 fib retracement after our drop from our 24 December swing high, so I have a 168.1 fib extension target of $2780 if we fail to get above DMA50.
Although we had a strong volume candle on the squeeze, we lacked any volume follow-through for a continuation of a rally, and once we reached DMA50, our buying volume dropped off, unlike the build up of buying volume when we bounced from our December lows.
A healthy rally would entail us taking the stairs up and elevator down but this was an elevator straight to our DMA50 resistance.
We could potentially have a drop / bear trap from here, breaking below WMA200 to set new lows, invalidating the triangle from my previous chart and forming support of a large falling wedge, triggering stops just below $3k.
Bitcoin should then have a dead cat bounce, first back above WMA200, then to wedge resistance, and then a breakout with a $4200-$4400 resistance target sometime towards the end of March / start of April.
When btc reaches $4200, I suspect we'll encounter strong horizontal resistance as we have since we dropped below $4500 in November last year and we should meet our DMA100.
Depending on the strength of trend and bottom-calling fomo, we should have a 38.2 fib retracement back to our 61.8 fib support, somewhere around $3670, which will give us 168.1 fib bull trap extension target of $5110 (to DMA200) once we break above that $4240 - $4480 and DMA100 resistance.
If we have a deeper 50 fib retracement to $3500, I'll revise my bull trap target to $4770, which would be a 138.2 fib extension target.
We should then potentially drop back to our $3k support, extending the bear market, with a move to new sub $2500 lows.
Have a look at the NVT indicator which gives us a network value to transactions ratio and has been quite accurate so far on the daily chart for predicting the bottom/top.
You'll see that we're in a great buy area on the weekly chart (flashes green for buy red for sell), but we still haven't bottomed yet on the daily chart, and you'll see that there was only 1 day where it flashed green in 2015 and that was during capitulation.
Previous chart and potential to new lows from here:
Scenario where we've already bottomed:
Another bearish scenario:


NQ1! Long play - Strong trendline from 2016Just closed SQQQ Call options here, this is a simple trendline play, Legacy markets love using these old long term trendlines and I would be extremely surprised if we just ignored it and continued down without a bounce. I think we'll pump aftermarket today or tomorrow latest.
I'm not worried about stoplosses here, just buying some call options that either will, or wont play out in the next week or 2 on TQQQ. So defined risk and potentially unlimited reward. Conservative target would be the 50ma on the weekly (the blue smooth line)
Good luck

BOUNCE TO 4900 BTC/USD ?We just bounced of the 200 weekly MA. Therefore we will likely see a bounce to the upside. Question is how high we will go?
I have 4900 BTC/USD in sight over the next couple of weeks. There will most likely be a retest of the 200 weekly MA once we have had the counter rally, so don't chase it if you entry isn't good.

Consolidation leads to expansion in BTCThe price is currently moving around the weekly support (worth zooming out before evaluating this trade).
We had a relatively high volume impulse move up after hitting the lows at 3120 more than a month ago.
Now the price has spent weeks after that slowly correcting downwards on low volume, which makes me see this as a retracement instead of another impulse move to the downisde.
Knowing the difference in characteristics between an impulse move and a correctional move is very important here.
Additionally, we have a falling wedge pattern forming, indicating the selling momentum is slowing down at these levels.
When looking at classical charting patterns, it is important to look at the context in which they form.
Breakout above 3560 will be the confirmation (safer approach). Once (and if) that happens, the targets above will be active.
Crucial support is in 3336-3250 area. If we see a daily candle close below that, the reason for entering this trade will no longer be valid, and in that case we might see the lows at 3120 taken out before a possible stronger bounce up again from the 3066-2876 area.
That is out of the scope for this analysis, and I will make a new one if we see that happen.
Right now I see it as more likely that the grey support area will hold.
Another move down into the grey area (major support zone) is still possible (which would offer ideal entry opportunity with a close stop loss under), but none of the daily candles must close below 3250 (wicks/stop loss hunts are still possible and do not invalidate the idea).
Consolidation always leads to expansion.

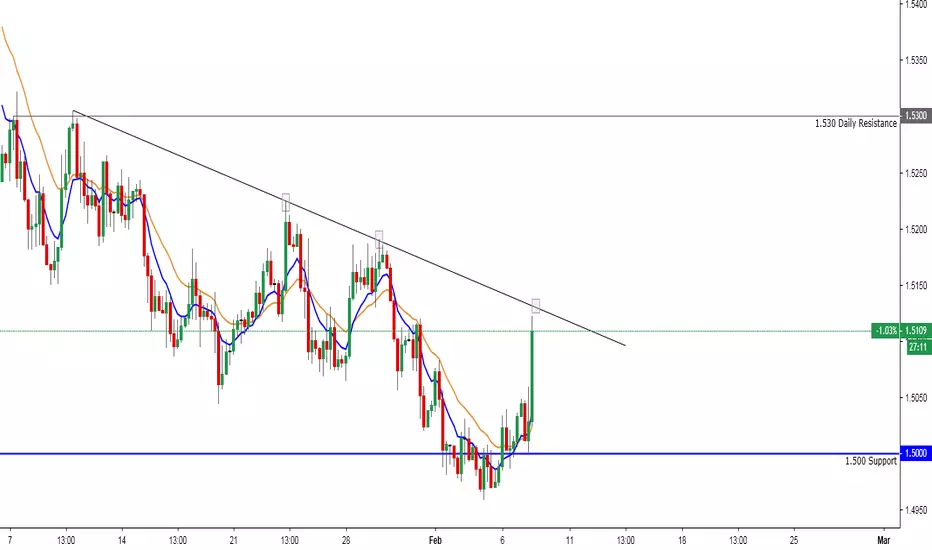
EURCAD on the rise, Break or Bounce?Hey guys, EURCAD has been on the rise today, and is approaching an important area on my chart. If the trendline is broken, there is lots of upside potential, with 1.530 being the next key resistance. However, we are still bearish on the daily timeframe, and we could see a push back down to 1.5000
DJI Ideas #2the dow recently broke some pretty strong resistance (in my eyes) and i think we are heading higher with a probable bounce somewhere in the highlighted range. just an idea. have a good day and please if you have any comments or criticism let me know!


ETH bullish channelI believe that ethereum has found its bottom and will bounce and wander around in this given channel. If it breaches any barrier on this channel, then adjust your positions accordingly!


Bounce found right at bottom trendline of falling wedge: here is a link to the original falling wedge I initially charted on coinbase: s3.amazonaws.com you can see the bottom trendline when at this trajectory is the exact bounce spot our current price action has found good support at...I anticipate we will move back up to the top trendline of the wedge again before any kind of capitulation. We may test the bottom trendline a couple more times before that bounce towards the top trendline but I personally dont think capitulation will be until after we've bounced down once again from the top trendline of the wedge...however if we do retest the weekly 200ma that may be enough of a bounce to confirm capitulation so I'm still waiting to see how price reacts once we revisit that range which has gone up a little since we first visited it back around the 3.1k area. So for now I anticipate a bounce back up but am keeping this idea neutral because we may do a slow grind downward here and retst the bottom trendline of the wedge a few more times first before we head back to find resistance at the top trendline of the wedge.

EW ANALYSIS: Bitcoin Cash Ready To Fly?!Hello Crypto traders!
Let's talk about Bitcoin Cash!
Bitcoin Cash was one of the first in which a rise occurred at the end of December in 2018. And now, it could be the first one that can complete a correction since we see both, BCHUSD and BCHBTC at important support area between 61,8% and 78,6% Fibonacci retracement!
But, the most important from EW perspective is that we can clearly see a three-wave a-b-c corrective structure from highs, where wave "a" is a leading diagonal, wave "b" is a triangle and motive wave "c" ended by five waves!
That said, we really like Bitcoin Cash for a potential bullish turn here, but we need confirmations, so if we see a sharp bounce or a five-wave rally away from current support area, followed by a break above previous wave "b" (BCHUSD above 167 and BCHBTC above 0.043), only then we can confirm a completed correction and we can start considering bullish scenarios!
Invalidation levels remain at December 2018 lows!
Disclosure: Please be informed that information we provide is NOT a trading recommendation or investment advice. All of our work is for educational purposes only.

APPLE ABOUT TO START A MINI BULL RUNStock market bubble has started to burst. Although we are already in a very young bear market which will last for a few years. So this kind of things don't play out overnight, there are many throughs and peaks in between. Looks like APPLE (AAPL) has completed the first impulse wave down. We have two reversal divergences between price ahd a fast Fisher transform (red one) and a reversal divergence on a slow Fisher. That is clear enough for me that this is a bottom. Target 195$.

QCOM Earnings: Test of 2-year ResistanceQCOM looks like it wants to test it's 2 year support at the $50 mark. Secondary support is somewhere around $43. QCOM is coming off of a finished head and shoulders pattern, making its D leg downward. Typically a D leg is finished by a sharp reversal. In case of negative earnings, QCOM will likely drop well below the $50 support and have a sharp reversal upward. If earnings are positive, QCOM will likely bounce off the $50 support and make a less drastic reversal upward. Fisher transform also indicates the potential for an upward reversal. With QCOM's extreme debt levels, the FED put will serve them well going forward.

BTC trapping sellers before one more bounce?BTC is currently in a very important support zone on the daily timeframe (range low).
Although we've seen a large red candle two days ago, wicking into 3400s, there was enough demand to push the price back up and the daily candle closed back inside the range (potential swing failure pattern forming).
The low wick has taken stop losses below, but the sellers failed to follow the push down.
Ideally I would have liked to see the price fill the gap below and tap into 3250s and then bounce strongly to the upside, but we can't ignore what is currently forming on the chart here, which is why I'm posting this analysis.
For validation of this trade, we want to see a candle close above 3565, after which I expect that area to hold as a regained support (currently resistance).
Targeting the resistance areas above:
1. 3649
2. 3780
3. 3849 (less chance to be reached, but still within range)
If the bulls fail to take over here (3530-3476) and push this above 3565 (local pivot point), then I doubt 3430 (weekly support) will hold for long.
After a candle close below that level, we can expect 3330-3250 area to be reached next.

GBPUSD LongMy Personal Opinion on this market is a possible W Forming at this level and retracing, assuming that the Rejection of Brext played it's role in solidifying a lasting market structure, We could see a return to the previous High.

LUN Ready to Bounce Again - Just Wait for ItLUN (Binance)
Strong Support at 40K Levels
Every Time it Pumps Up from here strongly with 7% gains or more
RSI rising too
Buy Zone 4000-4200
Sell Targets: 4450 | 49000 | 5550 | 6666 | 8888

Short US Equities. The Dead Cat Bounce is Over.The market entered an important zone of resistance, formed by important support levels in the past. It is also failing to break through the 180 MA, where it has been rejected many times during this recent downtrend. We have also formed a double top, with bearish divergence shown on the RSI. As soon as we break resistance at 6530 with force, it will be a good short opportunity. I believe this was the completion of the dead cat bounce in the recent days, and we should now see a continuation of the downtrend. I will be playing this through SQQQ .

[ETHUSD] Ethereum interesting bounce areaCypher pattern with round number (100) gives us interesting bounce area.
Bear flag helps us to complete the Cypher pattern (y)

Pfizer - Time for a Dead Cat Bounce?The healthcare company develops a corrective structure after a bearish move started on Dec, 03. The close below $42 could activate a bearish move that should dive to PFE to the area between $38.89 and $37.59. The RSI oscillator suggests more downfalls.
