RCN Bouncing Off From SupportRCN holding on to its support and has bounced off nicely. We can expect to see more gains on the price in short term.
Accumulate now.
Bounce

Weak bounce increases the likelihood for this bearish scenarioWell, this bounce from 3200 is the most pitiful excuse for a bounce I have seen in a long time.
This shows that the support at 3200, which should have lead to a very strong reaction, a rally to upper 5000s, is quite weak.
I think we'll go below the MA200 in the near future. Maybe the structure will be different from the 2011 fractal, in that BTC just doesn't really do large bounces and dumps any more,
just a slow and long decline towards 1200, the high of 2013.
This means that the bearmarket will also drag on longer than expected, and only in the second half of 2020 would we rise again thanks to:
1. The halving effect
2. The stock market bearmarket probably over and new bullrun in stock indices (BTC correlated with stocks)
So, let's see if BTC bounces soon, then this might still be averted, but the likelihood fot this increases more and more.
The positive of this?
An entry at 1200 would be an insane opprtunity, since the ATH for next rally, even though it would occur later, say 2023 plusminus, would yield nice gains.
Also keep this chart here in mind: www.blockchain.com
Historically, when transactions go above old ATH, only then the beartrend stops, and BTC turns bullish. Never before. And it looks as if it will take quite some time until we
reach old transaction ATH.
So, I will be prepared for that scenario.

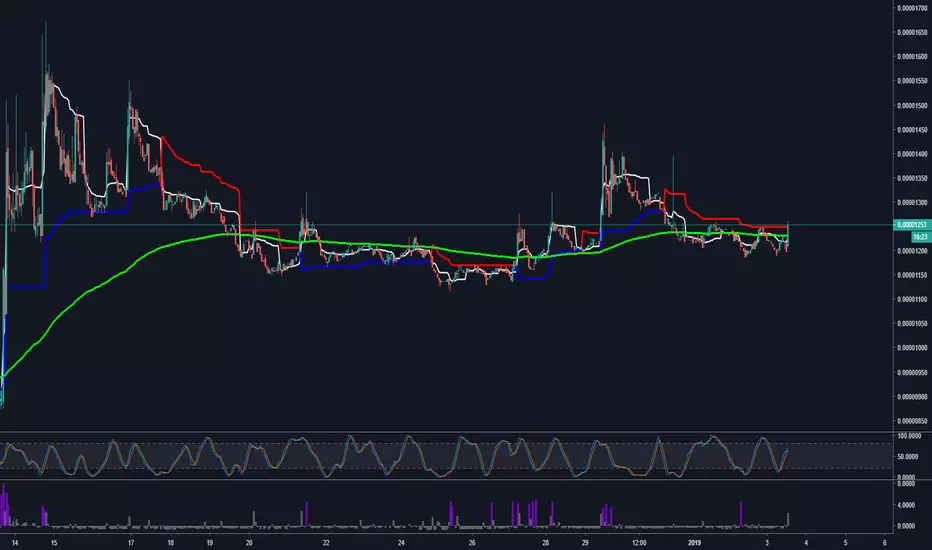
$SYSBTC Syscoin Short Term Long Channel Bounce 1 Hour Time FrameWatching a short-term 1 hour bullish engulfing candle bounce play off of support. I'm long at current level and looking for price targets at or above the 1460 satoshi area. Don't fall in love with her just trade the bitch! Viva La Crypto!
NASDAQ play update: 5.8k-6.5k? shortterm bull $nq1! $ndx $tqqqIt's late so I'm throwing this up quickly before market open. I'll update it later. My last chart worked out perfectly, we bounced off of a 0.5 retracement from 3.9k in early febuary 2016. I think we have at least 1-2 more days of upside on NASDAQ. My zones are defined on the chart. We bounced exactly on my teal support zone as predicted in my last Nasdaq chart, and I sold off some 12/28 TQQQ contracts at 3:55pm near at the height of the bounce.
In afterhours we're currently Bull flagging, probably getting to the .236 fib retracement around 6150. I'll be going long in the morning in anticipation of further upside, but I have a strong main objective to get a good short position on 1 of the indexes after this short squeeze rally. NASDAQ has been the hardest to push down during the past months, and it clearly bounced the highest yesterday 12/26. So I may look to the Russel and the S&P to short since they've been more bearish and I believe we have more downside over the next year.

Bitcoin is still bullish
On the scale of the month, we can clearly see that we are still moving in the descending channel. The formation of the extreme candle looks like a “reversal”, which gives us a good opportunity to jump to the upper edge of the channel, but it will be rather difficult and unlikely to go higher. In the case of achieving resistance of 5,000, the chances for a breakdown and fixation above are very small, to continue further to decline more likely, since the market still does not have sufficient volumes for a real bullran. Still adhere to the scenario that we are now witnessing a rebound of a dead cat.
The weekly scale looks positive, to maintain a bullish mood, we need to keep above the 3650 mark. On the month scale, there is still a strong oversold, but on the weekly chart RSI and Stoch RSI look positive, there is a rather bullish attitude and good chances for the upward movement. Day-to-day MACD also looks good. In addition, we can note that now we are in a zone of strong resistance and going higher will lead us to the area with little or no resistance, where we can get a rather strong bullish impulse.

Stocks Forming Significant Bottom: UpdateA somewhat more bearish scenario than the previous idea (linked) may be completing as we speak. The adjusted midpoint here is on Dec. 13 where the previous down move suddenly accelerated downward in a steep panic-selling type of move. Nevertheless this setup suggests that this selloff should be about done anywhere under the 2350 level and we should see a significant bounce this week.

Bitcoin : Christmas Dead Cat Bounce over ? What's next ? Hello traders.
Going to open a short position around this 4170 area at the next 4hr red candle for several reasons :
- We are around a 0.786 Fib Retracement from the previous 4.4k top and 3.1 bottom which is a key level for reversal.
- We are making a nasty bearish divergence on RSI, MACD and Stoch, they have proven their worth during this bear market.
- It looks like we might be forming a falling wedge, which is a bearish pattern.
- There is always a story of power in a trend which is most of the time defined by volume. As you can see, the volume on this last pump is really not significant compared to the overall volume of the move. It was a push that was showing that the current trend might be weakening, so we want to participate in the pullback. Looking to find 3541 as first target being the 0.618 Fib retracement of this upward move. Risk Reward ratio is 3, pretty safe.
What's next for BTC ?
From my experience, bottoms, real bottoms, never flatten out and then spring like the action we have seen this past week. Actual bottoms are violent formation with huge wicks in the candles, enormous % variation and very brutal action. I don't define the 3.1 low as bottom, therefore I think we will see lower levels in the beginning of Q1 or later this year. I don't want to hurt feelings of the newly found bulls on this platform but I think this is only a dead cat bounce that has had a violent spring fueled by FOMO and broken dreams. Now if this is a spring, we need to see if this was the end of the action or if there is more. Basically, the intensity and volume of the coming pullback should give us clues to whats next. If BTC manages to stand it's ground at the 0.618 Fib and look for higher prices, we might be able to make a medium term higher high before going to find the real bottom. If BTC fails to hold the 2 levels that are on the chart, things will probably turn pretty ugly.
Stay Open-Minded and Trade Safe.
Wishing you all a Merry Christmas and beautiful end of the year celebrations !
CR.

SAM new years new gainsNew year, new gains! Wait for reversal and confirmation this could be some much needed gains, bounce baby bounce!

Bounce coming soon - No fall to 2XXX yetThe Fantastic tool CM_Williams_Vix_Fix Finds Market Bottoms shows at 1W view the biggest support ever in one year.
A big bounce can be possible over 3200/3400k and then a fall to 2XXX -1XXX
My followers knows I dont like repeat charts that you can find in TV.
This is a different view so I post it.
I thing now we will do a big dead cat bounce.

We´ve ended the fourth wave.We are ending now 5 waves down and I´m waiting for big bounce between 2800 and 3000 USD (BitMEX price). Put your long orders between 2800 and 3000USD. One of the most important support, Elliott Waves, Harmonic pattern CRAB, psychological zone and lower sell volume gives us BIG PROPABILITY for big bounce UP.

When to buy the dipSo, it seems that the bullmarket continuation scenario is getting more and more unlikely by the day. This scenario would have brought us to 100K sometime this year.
However, due to the continued weakness of bitcoin, a bearmarket seems much more likely :(
But how can you trade a bearmarket? Well, it seems that one has to wait for the right buying opportunity, when a dip occurs, which goes significantly below the weekly bollinger band.
Historically, in the 2014-2015 bearmarket, every time btc dumped strongly below the lower weekly bollinger band, a very strong bounce took place, about 50-100% bounce, every single time.
So, trading this market is pretty simple: wait till it dumps below weekly bband, buy, sell at the bounce, after 30-50% rebound, to be on the safe side.
Rinse, repeat. Wait for the next dump.
And then, in 2019, the low will be reached at some point, and one can start buying good old cheap coins at around 2K :)
Because the next bullrun WILL come, starting in 2020 with the halving.
The chances for the continuation of the bullmarket this year, are not zero however. They are small, but this scenario is also not completely off the table.

Dead You Know What Bounce!Bad news invest in something better for the planet like Tesla or Microsoft.

EURUSD Short @ 1.13735Looking to drop back down to the bottom of the wedge, will be keeping a close eye on this just in case we whip back up after dropping.

EURUSD bounce potentialPrice trying to get to target level 1.14. Look for another bounce there based on candle analysis on smaller time frames

#Bitcoin $BTC shorts will be cut down to size before bottomAnyone who believes that BTC will go straight to a new low from resistance at $3500 should keep a close eye on the very high amount of short interest that is in play.
At this point we will likely see $3800 or 12% gains before a renewed crash and making a new lows. Another possibility is an extended horizontal move as shorts cover gradually.

DJT - Trading the Dead Cat Bounce Pattern (UPDATE).The DJ:DJT chart corresponds to an update of the chart published in the article "Trading the Dead Cat Bounce Pattern."
TheLiveTradeRoom
