BTC WEEKEND PLAN! A QUICK UPDATE!!Hello everyone, if you like the idea, do not forget to support it with a like and follow.
Welcome to this quick BTC update. Currently, BTC is trading around the $26.8k level. It is forming a descending channel in 1hr time frame.
If we look at the higher time frame then it breaks below the important support of $26.8k which is a bearish sign for me. Now, the next important support area is around $24k- FWB:25K
Now, if we look at the lower time frame then there is a possibility that we see a quick bounce on Sunday to trap more retailers and dump again next week.
Observe the chart carefully to know more.
Invalidation:- If we got a weekly close above $27.2k
If you like this idea then do support it with like and follow.
Also, share your views in the comment section.
Thank You!
Bounce

BIG BUY Coming For AUD/USDThe AUD/USD currency pair has been experiencing a significant decline, forming a pronounced downtrend as it nears the neckline of a substantial daily double-bottom pattern. Traders and investors are closely observing the 0.65981 area for a potential rebound. There is particular interest in establishing a long swing position with the expectation of a price movement toward March 2023 high at 0.71577.
Purchase The BreakoutBuddy🚀 HERE http;//www.SuperTrendFx.com
Open A DEMO Account Today kot4x.com 👈
Open A DEMO Account login.hankotrade.com 👈
❤❤ If You Like This Idea, You Will Have a GREAT Trading Week 👍
My YouTube Channel www.youtube.com

BTC QUICK UPDATE!Hello everyone, if you like the idea, do not forget to support it with a like and follow.
Welcome to this quick BTC update. BTC is moving in a range of FWB:27K -$30k for many days. So what's next from here?
BTC is forming a symmetrical triangle-like structure in the daily time frame and once again it got rejected from the upper trendline of the triangle. We have two important supports below. One is at around FWB:27K and another one is at around FWB:25K level.
IMO BTC holds the first support of FWB:27K and we might see a quick bounce from there. For a bullish scenario, we need a clear breakout of this triangle. As of now let's see how the price reacts after reaching the FWB:27K level.
Invalidation:- Daily close below FWB:27K
If you like this idea then do support it with like and follow.
Also, share your views in the comment section.
Thank YOu!

First Republic Bank Continues Below $5Merely an update to my previous idea.
And well... I started this idea before the bell, and it was $3.51 at the time.
It's now $2.01 post as of typing this but that will be different already.
I think I will just post this as is, because it's moving too quickly to make any rational conclusions.
To be noted, every time $15 was broken, the market dumped it below preventing it from becoming proper support.
Now, the HKEX:5 line is going to be doing similar tricks on it and FRC fell below it.
Notice the two more recent dead cats I have professionally marked 😼
I did not have HKEX:3 price line on my previous chart, but I see that now there's a clear line there as well.
Only psychological levels matter at this point.
Same ideas:
*It's a personal opinion of mine that psychological levels, whole number resistance and support, should have this much control over price action.
Psychological levels have the most effect when there's extremes of emotions. I feel it's rather self-explanatory.
It's either going towards zero or it's getting bought to prevent it from hitting the pavement.
The variance in price alone is a clear indicator its in deep trouble while it was just downgraded to BB.
Previous low on charts of $17.60 is notable, while HKEX:20 pertains to psychological significance.
Below this, I see little more than psychological levels.
HKEX:10 , double digits. HKEX:5 , where select exchanges consider a stock a penny stock. HKEX:1 , where the rest consider it a penny stock.
You can label a ton of this chart a deadcat bounce here or there.
Please add thoughts. I didn't see a Fibonacci ladder helping much because the price action was too chaotic.
DYOR/DYOC.*

🔥 HOOK Bouncing From Strong Support!HOOK has yet again reached the bottom support. I've made several analyses on this pattern already, and every time that HOOK touched the support it has resulted in a bounce.
Keeping my targets close, blue, because BTC can move erratic during Q2 earnings week.

BTC bounce 5am Monday US east timeI am predicting a bounce at 5am NY USA time for BTC, on Monday the 24th. This is not financial advice. just my thoughts. Be safe and never invest more than you can afford to lose. Monday I will add a few BTC, God speed everyone.

GM General Motors Pre Earnings LONGGM is on a 4H chart. Fundamentally, the last earnings were good. GM is challenged by the adoption
of electric vehicles and the transformation of its core business. Small EV companies ( CANOO, RIDE, WKHS, FFIE, MULN)
are mainly undercapitalized noise. The competition is really TSLA and Ford. Earnings upcoming are April 25th
Technically, the price has been trending also a support of the lower standard deviations of the anchored VWAP originating
on the date of the last earnings. Recently price has moved from -2 STD VWAP band to the higher -1 STD band.
Price is now sitting on the support shown by the Luxalgo indicator with the earnings report due The VWAP bands
are quickly losing slope as earnings report day of April 25 approaches. the zero lag MACD has lines crossing under the
zero line and the histogram has just turned positive. These serve as confirmation entry signals.
I see this as entry time for an earnings play. Entry is by market order with a stop loss below the demand zone.
Targets are VWAP ( purple line), the midline between the demand/supply zones, and then the final target is the +1 STD above
VWAP ( downsloping stepped black line). Overall a reward for the risk of about 4X. I may opt to play this with call options
striking $35.00 expiring on 5/5 and currently priced at FWB:112 per contract.


🔥 ICX Oversold Bounce After Massive Run-UpICX has been one of the major winners of the last week. However, price action has been negative after topping out around $0.48.
With BTC seemingly bouncing, it seems that ICX is primed for a huge upward move, just like we saw a couple of days ago.
- ICX has hit hourly oversold for the first time in weeks. Hourly oversold in a strong uptrend is a great moment to enter.
- ICX has bounced off the 0.618 Fibonacci Retracement line, which is often a strong resistance.
I'm aiming for the orange and red lines as my targets (0.40 and 0.433)

META: Wait for possible bounce at 176support and bottem trendline support at 176, wait for it and see if it bounces, if not, look for gap fill down to 150s

SPY Setting up for a bounce soonOnce there was a guy who talked about an outcome that nobody believed in. He was laughed at and ridiculed for his ideas. He tried to explain his point of view, but people dismissed him and thought he was foolish. However, he remained persistent in his beliefs and continued to speak about his theory. Then one day, something happened that proved him right, and suddenly, nobody was laughing anymore. They realized that they had been wrong and that the guy had been right all along. The guy's persistence and belief in his ideas had paid off, and he was now recognized for his unique and innovative thinking.
Oh wait. That guy is me.
We're likely going to bounce soon, though. Look at the fib measurements I'm providing in this chart. We tapped the 100% extension perfectly. This does look wave 3-ish so be cautiously optimistic. I discussed 3900 in a recent video as well. Well, here we are. Almost 150 points lower from my previous idea that I shared here that was laughed at.
But seriously - look at that perfect bounce off the 100. Probably just a bounce, but a bounce will come overnight, then tomorrow when NFP is released... we'll see if this is a wave 3 or not.

GBPJPY I Potential bounce from demand zone 🚀
Welcome back! Let me know your thoughts in the comments!
** GBPJPY Analysis - Listen to video!
We recommend that you keep this pair on your watchlist and enter when the entry criteria of your strategy is met.
Please support this idea with a LIKE and COMMENT if you find it useful and Click "Follow" on our profile if you'd like these trade ideas delivered straight to your email in the future.
Thanks for your continued support!

AUDNZD I Potential intraday buy from demand zoneWelcome back! Let me know your thoughts in the comments!
**AUDNZD Analysis - Listen to video!
We recommend that you keep this pair on your watchlist and enter when the entry criteria of your strategy is met.
Please support this idea with a LIKE and COMMENT if you find it useful and Click "Follow" on our profile if you'd like these trade ideas delivered straight to your email in the future.
Thanks for your continued support!

BTC QUICK UPDATE!!Hello everyone, if you like the idea, do not forget to support it with a like and follow.
Welcome to this quick BTC update. BTC is dumping badly after breaking down from the $23k level. Now, what's next?
According to the chart, BTC is forming an expanding wedge-like structure in 4hr time frame which is generally a bullish pattern. Currently, it is touching the lower trendline of this wedge and bouncing. If BTC stays here for a while then definitely we can expect some relief bounce from here.
Invalidation:- If the candle closes below this wedge then expect more dump.
What do you think?
Do you also expect some relief bounce from here or do you expect more dump?
Share your views in the comment section.
If you like this idea then do support it with like and follow.
Thank you!

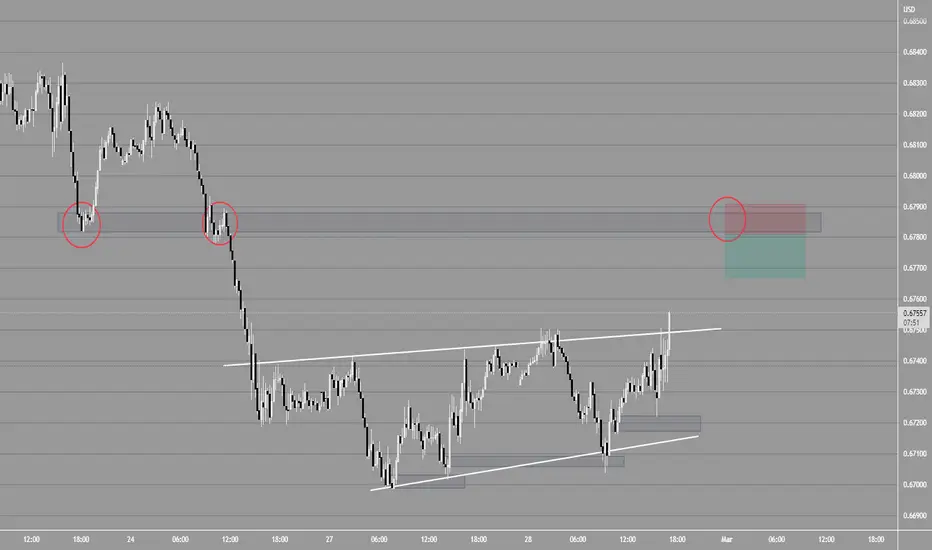
AUDUSD shortAlthough you could build a case for a bottom reversed H&S long. It's actually a short setup that I have in sight.
It's because it's a broken demand zone that became a supply zone and it had a significant local rally afterward.
So for me it's basically two setups in one. A supply zone and bounce zone, which could indicate a very strong zone for a correction or reversal.
It's of course if price can manage reaching these levels and not punches through. Nothing is curtain, just ideas and probabilities.
AUDNZD I Potential buy from demand zone Welcome back! Let me know your thoughts in the comments!
**AUDNZD Analysis - Listen to video!
We recommend that you keep this pair on your watchlist and enter when the entry criteria of your strategy is met.
Please support this idea with a LIKE and COMMENT if you find it useful and Click "Follow" on our profile if you'd like these trade ideas delivered straight to your email in the future.
Thanks for your continued support!

AUDUSD I Local buy from demand zoneWelcome back! Let me know your thoughts in the comments!
**AUDUSD Analysis - Listen to video!
We recommend that you keep this pair on your watchlist and enter when the entry criteria of your strategy is met.
Please support this idea with a LIKE and COMMENT if you find it useful and Click "Follow" on our profile if you'd like these trade ideas delivered straight to your email in the future.
Thanks for your continued support!

GBPUSD I Potential buy from demand zone Welcome back! Let me know your thoughts in the comments!
**GBPUSD Analysis - Listen to video!
We recommend that you keep this pair on your watchlist and enter when the entry criteria of your strategy is met.
Please support this idea with a LIKE and COMMENT if you find it useful and Click "Follow" on our profile if you'd like these trade ideas delivered straight to your email in the future.
Thanks for your continued support!

Bitcoin Reversal Signal on WEEKLY - part 2This is a follow up of my other idea ''Bitcoin Reversal Signal on Weekly''.
Here, I predicted that bitcoin would reverse on the major weekly rsi divergence and it did for sure! Now looking at the daily chart: I don't think this bounce is over yet, I think there is still some juice left. To me it looks like BTC is forming an inverse head and shoulders, this breakout could send us pumping really hard, however, there is still a big resistance zone at 30k. I think this move can reach 30k for sure, there is a chance at 30k would break and then I think we can overshoot towards 40k+. Is the bottom in? I'm not sure, but for now, I think Bitcoin has some room to go the upside. Remember that we went down for more than a year without any significant counter-rallies, so I don't think this rally is unjustified.

KOL retesting supportIf newly formed support holds, we could have a solid move up. Set alerts for this one.
Details on the chart.
Good luck traders

HIODExcellent chance for a bounce from the support zone here. Entry ON BOUNCE OR RESISTANCE ZONE BREAKOUT. Details on the chart
Good luck traders

TSLA Relief Rally *Be Careful-(Short Term Bullish)***Warning Monday Jan 2nd (Market is Closed) - Q4 EV Deliveries - good report then TSLA will complete H&S pattern and continue Bullish Island Gap Reversal
Positive:
`TSLA is Very Oversold, we could see a continuation of this bounce up too 150-180 if production release is great on Monday.
-Bullish Chart patterns show inverse H&S pattern created by Island Gap Reversal.
LARGE Buying Volume strong-sign of institutional investment - this could be accumulation phase
Beginning of January tends to be positive for the stock market
NDX & SPX showing signs of upcoming relief rally (*before we make final leg down)
HYG & JNK Bonds are showing bullish divergence
Negative:
Monday possible less deliveries than expected -if is lack luster I can see TSLA dropping 7-12% to retest the low
China Covid Cases/ Shanghai Factory Slow production
Tesla is still in a Strong Bear Market pattern
Elon and Twitter Drama
Earnings report on the 23rd - with factory issues, supply issues - it does not look promising
Macro H&S Pattern puts the measured decline to $90-$80 range
Sentiment:
Short Term -Swing /Day Trading -I am only Bullish for the Short Term* (1-2 weeks) .
Long Term Investing: I am Bullish for Long Term (5 yrs) ....over-all I would choose the $109 area as 1st pt accumulation / $80 area second point / $60 area 3rd pt (TSLA will Grow 25% Sales YoY for next 5yrs) PEG ratio looking good

Bitcoin | Dead cat bounce?The trend drawn from the ATH level of 2011 looks like a pullback movement in the red line. Price can say that the sloping trend line is a pullback movement after it broke down in November of last year. As for the RSI indicator, as indicated by the red circle in the figure, the situation is very close to the scene of the sudden fall in the summer of 2015.
In general, the 15500 zone was the bottom of the bear market, and most traders are anticipating the market with the belief and hope that a bull run has begun. As far as I'm concerned, the bear market is not over and we expect to see another new bottom. This upward movement that has been going on since the beginning of the year is seen as a possible "Dead Cat's Reflection". It is too early to tell if this is the case, as the rate will prove to be a dead cat by breaking below the previous bottom.
