Today's closing will be definitive for VALE5If VALE fails to closes above the R$16.10 mark than it will start a major correction targeting R$12.00.
I´ll buy a PUT Spread at the end of the day(+VALEQ62/-VALEQ60) if it fails to close this mark till 3h30PM.
Today VALE5 will report their first quarter production. The market expects a record break, but this is already in the price, as may be seen in the chart.
Brazil

Brazilian future index - WINM16We can observe a good support level around the 53200 - 53300. I expect that this future index will hit this support and bounce back. At this time it should be a good point to go long. Be prepared to stop this trade if the index go below the next support level of 52400.
BMFBOVESPA:WINM2016

THE FORCE BEHIND BRAZIL'S RECENT BULLISHNESS (ANALYSIS ON EWZ) If you've been paying attention to headlines about Brazil recently, the term "impeachment" seems to be all over the place. But what's really driving prices upwards in the country's stock market? Is it the daily swaying impeachment probability or something else?
Today's instrument to be analysed is EWZ, the ETF that seeks to track the investment results of the MSCI Brazil 25/50 Index. The fund generally invests at least 95% of its assets in the securities of its underlying index and in depositary receipts ("DRs") representing securities in its underlying index. The index, which consists of stocks traded primarily on the BM&FBOVESPA, is a free float-adjusted market capitalization-weighted index with a capping methodology applied to issuer weights so that no single issuer of a component exceeds 25% of the underlying index weight, and all issuers with weight above 5% do not cumulatively exceed 50% of the underlying index weight. The fund is non-diversified. (source: finance.yahoo.com)
The chart's left side is late October 2014, when president Dilma Rousseff got re-elected. As can be seen, EWZ price has since then maintained a close correlation with the price of other Emerging Market ETFs and Indexes
2015 was a perfect storm for Emerging Markets. With China's slowdown, a commodity crash, the strong dollar, a Fed rate hike, the light at the end of the tunnel was nowhere to be seen.
Commodities
Many emerging markets depend on commodities like oil, iron and copper in order for their economies to do well.
Commodity prices tumbled in 2015, with Crude Oil hitting a 7-year low in December. Oil and other commodities are not set to boom in 2016, but they likely won't tumble as much as they did last year, specially if OPEC agrees on setting production quotas again.
China's Slowdown
China is transitioning to a consumer-led economy from one led by manufacturing and construction, meaning its demand for all those commodities has plummeted.
China has been cutting rates, weakening the currency and pumping money into the economy to counteract the slowdown.
Many experts believe China's growth may slow down more in 2016, but not at a faster pace. A more stable China should help the countries that depend on it.
Strong Dollar and Rate Hike
The good news is that a weak currency lets emerging markets sell products abroad more cheaply, making them more attractive to foreign buyers. That eventually boosts exports and, in turn, economic growth.
The bad news is that emerging markets have to pay off some debt in U.S. dollars. In total, there's $3 trillion of emerging market debt denominated in dollars, according to Wells Fargo. As the dollar rallies, that debt gets more expensive to pay back.
The rate hike makes the US Bonds more attractive and attract foreign money to the US. This money has to be exchanged into US Dollars and ends up boosting the currency.
Many leaders in emerging markets are actually glad the Fed finally raised rates. So much uncertainty surrounded the first rate hike, and now that it's done, that gives emerging markets more clarity.
With all this in mind, it's silly to say Dilma's possible impeachment is the main responsible for the upwards drive in Brazil's stock market prices...

long for 2016 on BVSP (Bovespa)Well, a lot of stuff is going on here on Brazil, Political uncertainty and Economics fundamentals are terrible. The government, for sure, is being a problem more than a solution. But despite that i still believe in a good 2016 from here, based on this analysis and other analysis of major stocks that compose the index.

The Force Behind Brazil's Recent Bullishness (Analysis on VALE)If you've been paying attention to headlines about Brazil recently, the term "impeachment" seems to be all over the place. But what's really driving prices upwards in the country's stock market? Is it the daily swaying impeachment probability or something else?
Today's stock to be analysed is VALE, the Brazilian iron ore producer.
The chart's left side is late October 2014, when president Dilma Rousseff got re-elected. As can be seen, Vale's stock price has since then maintained a close correlation with the price of the main product it sells.
The analysis gets even more interesting when the stocks of other notable Iron Ore producers are plotted on the chart...
Anglo-Australian BHP Billiton and US-Based Freeport McMoRan.
So, what's really driving those prices more, Dilma or Iron Ore(rhymed!)? I'll stick with Iron Ore...

PBR is correlated to oil prices, but that's not all...PBR is correlated to oil prices, but that's not all. Out of a selection of other oil majors, PBR underperforms significantly when the starting month of August 2011 is chosen, a date I arbitrarily chose due to launch of a new industrial policy in Brasil (a proxy of changing economic policy). Note, however, work done by my friend, Raphael Geraldelli (related ideas), showing a much closer correlation of PBR to oil prices in a more recent period (). The takeaway here is that although PBR is correlated to oil prices, internal company issues and Brazilian political economy played an important historical role in the stock's price and I believe it will continue to do so moving foreword.

pennies to thousands etf foreign small cap candidategreen candle after doji small cap etf stoch crossed money flow good get our book on amazon diversify with foreign candidates relative strength strong cci and per r rising

Short Petrobras based on an unsustainable rallyFundamentals
Petrobras has seen an 80% rally through March, which is unsustainable. The reason for this is because the rally is based on the possible [ impeachment of president Dilma Rousseff, whose policies adversely affected the Brazilian oil market. While this is good news for the Brazilian oil company, the fundamentals of the company simply do not fit with such a rally.
It still has the largest debt level in the entire oil industry at about £75 billion; it will continue to have legal costs incurred from a corruption scandal; oil prices are still too low to be strongly profitable, and in my opinion will move lower to about $30, which will further fuel this rally to be pared.
Technicals
The stock price has hit a very strong level of resistance in the 4.50 and 4.75 price range, as indicated by the horizontal black lines, and is likely to rebound off this.
There has also been very strong bearish divergence on the RSI, which is all indicated by the thin black arrows.

Wave 3 of (3) on ITUB4Itub4 (itaú unibanco) is great for counting waves. I think we are before a great opportunity, entering in a wave 3 of (3).

Embr3 Wave 5 of (1): Entry 2.this is the second attempt to enter Embr3, in what could be a wave (1) of a Cycle wave V (or Cycle X). entering at end of wave 4 (23.34) with TP at 24.47.

IBOVResistence at 49,175; support at 43,845. Look for politic affairs. Once the impasse is broken the market will trend up. Wait for 3 months and monitor the IBOVESPA trend.

USDBRL - Support served as pivot and may throw price to R$ 4.10There is a minor resistance (blue traced thin line) that needs to be broken.
Happy trading!

USDBRL - Consolidação do Real.È esperado correcção no diàrio com testes nos suportes apresentados no gràphico.
Óptima negociação!
English: It is expected correction on daily with testing of the presented supports
Happy trading!

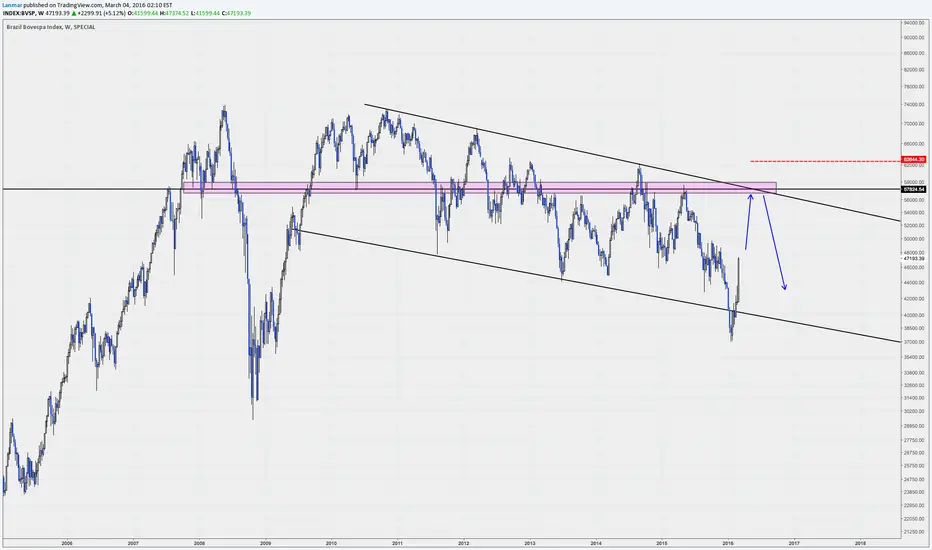
Brazil - ready to see market prices not seen since 08' Forgot to post. I am shorting the Bovespa index. I expect to see 30,000 soon.

Brazilian Real stabilizing near historical levels against USDIt's interesting to note that the USDBRL pair hasn't risen any further despite the route in the Brazilian bond market and the Fed rate hike this week. Of course, both were largely priced into the market. We're currently at one of those crossroads where fundamentals favor further US dollar strength against the Brazilian real whereas technical analysis suggests that one should be careful in following the general consensus on this particular market. I find it very interesting that the USDBRL has remained below its October 2002 highs on a monthly close basis since September despite all the negative news in Brazilian fixed income markets between October and December. That said, I would refrain from exaggerating the downside risk to this pair given that the dips have consistently been bought at around the 3,71/72 handle since October. If the dollar weakens (or the real strengthens) at the start of January with traders initiating new carry trade positions in the EM FX markets, we'll have to see just how things play out before being able to really tell if USDBRL will eventually break above its resistance.

Not bad risk/reward IMHOPro bullish:
- Slight bullish divergence on RSI and Stochastik
- market running into support at lower end of trend channel
- lower Bband at lows
- Spreads steady
Pro neutral:
- nothing clear cut yet in terms of buy signal
This is a good risk reward IMHO

India Could Be the Most Resilient of the BRICSThe BRICS (Brazil, Russia, India, China and South Africa) are highly watched emerging markets because they represented roughly 22 percent of global GDP in 2014. However, the global economic slowdown and increased geopolitical tension has weighed heavy on these markets. Although, India may be the most resilient economy out of the BRICS.
India has felt its share of the slower economic climate, as the Markit manufacturing PMI fell to a seven-month low in September, falling to 51.2 from 52.3. According to Markit, there are signs of sustainable growth but input costs decreased for two months consecutively, which has not happen since the financial crisis. Both manufacturing and industrial output have remained stable. Services PMI has seen improvement since late 2014.
In relation, the Chinese manufacturing PMI clocked in at 47.2 and has been contracting since March while near the worst levels since March 2009.
Due to the slack in the economy and less than expected inflation, the Reserve Bank of India cut the benchmark rate by 50 bps to 6.75 percent. This strengthened the rupee has investors look for it to hinder capital outflow. It also comes as the People's Bank of China (PBoC) devalues the yuan.
USDINR is likely to fall further as I expect the dollar to remain weak following the onslaught of poor economic data. Friday's non-farm payroll print of 146,000 was well below the 201,000 general consensus. To add insult to injury, August's jobs number was revised lower by 50,000 which left mouthpiece economists in bewilderment.
The Fed's inability to act, in regards to an interest rate boost, will leave the dollar on shaky ground. Fed fund futures traders are not pricing in a potential for Fed action until June/July of 2016 - although, I am forecasting a recession by then.
The USDINR is trending within a descending channel with support at 65.28, but the pair will travel to the 50 percent Fib. retracement at 65.15 (with the 72-daily EMA as further support). Secondary target is 64.83.
Resistance can be found at 65.6060, 65.8337 and 66.1374
Please follow me on Twitter @Lemieux_26
Check my posts out at:
bullion.directory
www.investing.com
www.teachingcurrencytrading.com
oilpro.com

SB Bullish, still on trackStill bullish SB as it appreciated over the past month. It really gained momentum has it had to break out from oversold conditions.
What happened over the course was the term structure (future spreads) are now in backwardation for the entire next year. This leaves me with remaining bullish as it foreshadows supply tightness coming out of Brazil.
Also the USDBRL has come off of its highs and could provide some further support for a rally

Petrobras Brasileiro: Corruption undermines Fitch RatingI've flagged Brazil's state-owned mega-energy firm Petrobras Brasileiro ADR (NYSE: PBR) because the SEC is investigating the energy firm for money-laundering and corruption, thus skewing Fitch Ratings of PBR. Since PBR owns a Texan refinery, PBR it is accountable under US jurisdiction. PBR has been found in violation of the Foreign Corrupt Practices Act and "other laws". I highly suspect "other laws" may very well be The Racketeer Influenced and Corruption Organizations Act (RICO), taking into account PBR's "cartel" influence in the global energy sector.
$PBR closed at $10.50 at the closing bell; -$.34 or -3.14%. Its price range was $11.51 at pre-market, opening around $11.15 then plummeting down to $10.41 during Wall Street's Witching Hour.
What is more shocking is to learn that the Fitch Ratings just released at the same time; gave an upgrade on the series of notes to "BBB"; the "issuance of which are backed by the royalty flows owed by oil concessionaires, predominately, PBR, and Rio De Janeiro (RJS), of which 100% flows to RioPrevidencia (RP), the states pension fund."
In part, the USD 1.1 billion series 2014-3 notes 'BBB', Outlook Stable and BRl 2.4 billion series 2014-2 special indebtedness interests notes affirmed at 'AAAsf(bra)', Outlook Stable.
PBR's cartel is backing a capital investment program at USD 220 billion between 2014 and 2018.
PBR is an asset to be used when the market performance is shaky. Its personality
Currently the downside calculation of price per share: $.54.

Premature enormous potential in Brazil Will be monitoring $EWZ over the next few weeks to see if this 3.5 year shit show is turning a new leaf with the recent break of a major downtrend line (2 variations drawn) on a positive divergence in RSI, and a slowly uptrending MACD that crossed the zero line and is at levels not seen since early 2012. The downtrend line of momentum on a weekly relative basis vs. the S&P has also been captured while putting in a higher low. While things are definitely looking interesting, I would want to see the downtrend line from early 2008 as well as the 200 day moving average captured before going long.

BRF, SLV, GLD Correlation suggest Brazil will rebound this yearThe correlation between SLV and BRF is more prominent that with GLD. Nonetheless the relationship between these asset classes are quite distinctive. long BRF, LBJ, ILF

Emerging Markets...Time to Emerge??I see 2 possibilities,1) a retracement into the box area, testing the neckline, and then a trust higher.2) Or a larger inverse Head and shoulder formation , which would be a stronger reversal pattern. I like the latin america over india because of a bullish MACD divergence on LBJ/ILF. I think Inverse H&S would create some fakeout for the bulls, before actually thrusting higher. Also an inverse H&S will be much more prominent on a weekly chart.
