Silver accumulationSilver price action has been quite flat for a few days now but there is an interesting fact to observe: it seems clear to be some accumulation in this area creating a solid support. You can see three different volume indicators all pointing upwards. OBV has been going up way faster than price and money flow index is coming back to bull territory.
This same feature is visible in XAUUSD
Breadth Indicators

Spontaneous remission from a terminal prognosisBMY recently has had poor lung cancer treatment results and is getting sold off, movement compounded by Mercks recent promising results in the the same treatment field. Today was another huge down day, with a push past 3 standard deviations according to a 20 day closing Bollinger Band. Long because On Balance Volume has been improving while the price has been falling, and it might be at a short term reversal. In at 49.91 with a target of 5% or 52.40 from an anticipated short term correction tomorrow. Price is holding in this range with a low of 49.72, and high of 51.30 for the day.

Wyckoff Accumulation Phases of Credit SuisseSome remarks on the price evolution of CS
Credit Suisse stock was in a downtrend which ended with a selling climax (SCLX) on February 11 this year. After that CS showed signs of being accumulated. The Brexit vote initiated a huge shake out. During this shake out it broke below its trading range, after which it trended back up into the trading range. Here it tested the 12.56 support twice; once on the Deutsche Bank fine news and also today after CEO Tidjane Thiam said he expects a challenging third quarter. Currently it is in Phase D, or alternatively it might still be in phase B.
Notice the volume peaks on down swings. This is a sign of buying pressure caused by the Composite Operator (or Insiders as Anna Coulling calls them) which buy in the lower end of the trading range, as discussed in the book "A Complete Guide to Volume Price Analysis " by Anna Coulling.
I posted this idea before (linked below).
On that chart you see the On Balance Volume indicator. Notice the explosion of the on balance volume for CS, right after the Brexit. And you know what they say: "volume precedes price".
I also labeled the chart of CSGNZ. Notice the differences in volume, particularly during the selling climax:
Some facts that support the hypothesis suggested by the technical analysis:
STRONG HANDS HOLDING CS
A very large part of CS shares is held by a few very large long-term investors that don't sell on weakness but use it to add to their core position (smart money). In fact they've added just recently. These kinds of buyers and shareholders explain the pattern we see in the CS and CSGNZ charts.
In the last couple of weeks more than 20 percent of Credit Suisse shares is owned by three shareholders:
Harris Associates (with David Herro as fund manager) owns more than 10 percent of shares ( August 22 , 2016).
The Saudi Arabian Olayan Group , through its registered entity Crescent Holding GmbH, holds more than 5 percent of shares and about 5 percent in convertible bonds ( September 12 , 2016) and is/was represented by someone on the board.
The Capital Group holds more than 5 percent of shares ( August 30 , 2016).
www.credit-suisse.com
www.thecountrycaller.com
www.finews.com
Besides these shareholders there is the state fund of Qatar that owns more than 5 percent of shares and about 13 percent in convertible bonds ( June 17 , 2016) and is represented by someone on the board.
Considering the long and intimate relationship of the Qatar state fund and Credit Suisse it is safe to assume they didn't sell in the past 3 months and this would imply no less than 25% of shares being owned by no more than 4 shareholders in the past month.
Another shareholder worth mentioning is the Norwegian Sovereign Fund (Norges Bank), which claimed beneficial ownership the day after the selling climax on February 11 (owning 5 percent of shares on February 12).
These are the shareholders that were required to file a Schedule 13D with the SEC, due to beneficial ownership. But I bet there are a lot of other institutions buying CS without reaching beneficial ownership.

Trading with the Trend, $NYXNyx Gaming Group has just had a 46% price increase in the past two weeks up until its peak. Price is now very overbought and as stated on the chart there are several bearish indications of why this is a good short sale. Also as you can see on the chart, price recently bouced back from the top lin reg line as it did a couple months ago. Price target is middle lin reg line.

CS is being accumulatedAfter a downtrend $CS reached multi-decade lows.
It appears that here Credit Suisse Group stock was, and still is, being accumulated.
Currently it looks to be completing phase C to enter phase D.

Trading with the Trend, $EDRAs you can see by looking at this chart, price action has been following the upwards linear regression channel. It has just bounced from trading at the bottom lin reg line and is showing several bullish indications as stated on the chart. My price target is around the upper lin reg line (green rectangle).
Trade valid until price closes below bottom lin reg line.

Trading with the Trend, $APH$APH, Aphria Inc. has been uptrending for months now. Using the lin reg lines you can see that it has bounced off of the top and has recovered using the mid line as a support. As stated on the chart there are several bullish indications and Im looking for a price target somewhere along the top lin reg line (green rectangle on chart).
Trade valid until price closes below mid lin reg line.

IMNP oversold, uptrend reversal!Notice everytime a green candle bar crosses above MA, the stock goes up, contrary when a red bar goes below MA, the stock goes downtrend. On Balance Volume shows that IMNP is way oversold. Any day with closing .38 or more with good volume, will indicates a buy signal

GOM Looking Very BullishGolden Dawn Minerals is showing a lot of bullish signs that it is ready for a potential new high. Support has been found at the 50MA as it has before, and the StochRSI is showing an oversold signal with the MACD about to cross to a bullish signal. Also I like this trade because volume has been continuing to increase and it is showing strength with a large bullish candle.

JCP Bullish TriangleBullish triangle on the JCP chart, watch for a breakout if the price clearly passes and closes above resistance. Chart also has clear indicators of a stong trend with the DMI showing an uptrend and the Aroon showing new uptrend. Would like to see an increase on the OBV along with the others for clarification of a strong trend though.

$SPY and $NYSE showing Bullish Market Internals for 07/20/2016- S&P is trading above its 100-period SMA, which has turned green, illustrating positive price momentum
- Breadth ratio is < 2.0, which is a weak bullish signal, but is starting to gain positive momentum
- Net Advance Decline Line is still < 1000, which is a "not as strong" bullish signal, but is above its 21-period EMA and is rising quickly to break 1000

$SPY Bearish Market Internals on the S&P and NYSE
Overall, the AMEX:SPY was trading below its 100-period SMA for a majority of the day, with the 5-minute chart well below the 100-period SMA
- Breadth Ratio ( NYSE:UVOL / USI:DVOL ) was showing a ratio of greater than 2.0 which a sign to look for bearish/shorting opportunities on the day
- Net Advance/Decline Line ( USI:ADVN.NY - USI:DECL.NY ) was below its 21-period EMA showing bearish sentiment and was below 0 for the entire day, illustrating that bears were in control, although net declining issues never passed below the -1000 mark, which would indicate a very bearish sentiment.
Either way 07/19/2016 turned out to be a day where trades to the downside should have been preferred; although overall it wasn't a very strong bearish day.
- $JOY; -$STX were a few that I looked into.

Horizontal Horizontal movement this stock looks good for swing and position trades. Or as an option trade straddles and strangles. However one interesting aspect is that the OBV is in a trend upward, precluding an long run trend.

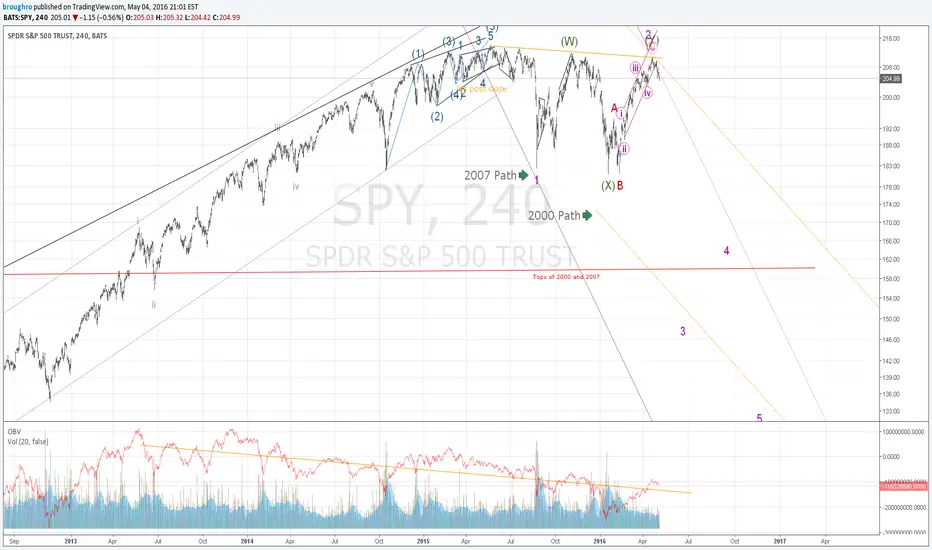
What do YOU think happens next?Notice that On Balance Volume has been NEGATIVE FOR OVER A YEAR during this year-long topping process and its been on a trend of decline since the trend line of the 2000 to 2007 tops was crossed.
Has the mania ended?
You tell me; what do YOU think happens next?
I'm short...
Contrast Weekly vs Daily Timeframe OBV and RSI indicate a possible bounce to the upside. Keep eye on intraday for continuation downward or break to the upside. If you wanna play both sides a straddle or strangle option strategy two or three months out might be ideal. For a one sided trade check OTM (out-the-money) contracts and the Vol in the options contracts relative to the strike price before purchase - 220 and 125 or 200 and 140 strike price might be ideal. Also don't wait to long to purchases options contract, because as directional price movement becomes more apparent and as Implied Volatility creeps up the more expensive the options become.

(1D) XAUUSD v US30 - gold rush. There seems to be an inverse correlation between XAUUSD and US30. Interestingly Gold began taking off before the recent mini-crash. OBV on Gold was steadily rising whilst OBV on US30 was falling (even while price was recovering). BREXIT has caused deep uncertainty in a number of markets. GOLD has always been a major safe haven. We saw this at every major world financial crisis. They can't just print the stuff or do quantitative easing on GOLD - can they? LOL. I'm short on US30 and I've been happily long on Gold. My stop losses are in the right places relative to my account size. Cool.
Disclaimer: no liabilities accepted for losses arising by relying on this post.

(1D) US30 - WALL STREET - possible crash comingI'm no expert at Elliott waves, so my waves may be wrongly counted or drawn on this. But I'm watching a number of other things adding up. I see trend strength weakening. I see OBV probably heading down in a struggling bullish market. There is a similar wavy pattern emerging, similar to that around Nov 2015 to Jan 2016.
I'd be delighted if others who know more about Elliot Waves can help out. But do share any other ideas.
This idea is not a prediction .


Day of reckoning has come for oilThis last bullrun on oil prices wasn't really supported by volume and we can see that reflected on the OBV which increased only a fraction of what it fell when prices went from 34 top to 26 bottom. That is, volume was way lower on this 15 USD rally than it was on a drop of only half that amount !
This fake out, is confirmed by the money flow index, now coming back from oversold levels and breaking the wedge. This indicator has been rarely oversold and last time it did, price was around 100.
I believe we will re test 0,23 and maybe 0,5 both of them at signifcant levels from past peaks.

Bearish or accumulationWe have been on a long period with no clear trend, but looking at the weekly indicators, it shows that we just broke a large triangle and it is even shaping a head and shoulders pattern. All the indicators shown are really bearish on this time interval.
The best scenario would be an accumulation period that would take longer to define to the upside. I wouldn't bet on that unless we break 400 and stay there for several days.

A Clear 3rd of a 3rd Elliot Wave Down is underway - continuationv of iii circle of 3 appears to have begun in today's afternoon reversal ending the relief rally. Since v would be equal to i at 183, short of iii's termination, expect v to extend to 1.618 of i and end around 178 before the next short term relief rally to circle iv.
Main point is that the waves clearly indicate that the main trend has reversed. Also note that on balance volume has been negative all of 2015 and began a continuing outflow to to deeper negative territory at the end of (3) of last year's terminating ending diagonal.
Say goodbye to 200 in SPY...I don't think we will see it again for many years...

The big shortIf you use the weekly time interval and chart price back to the 1200 peak, you will find an interesting thing about OBV: we are at the same point, and we seem to have done a double peak. On the other hand, indicators like the RSI seem to be completing a H&S pattern which would be the beginning of a huge bear cycle. If this is the case, we could go back on the 300's or lower. I hope it's not, but it should be considered anyway.

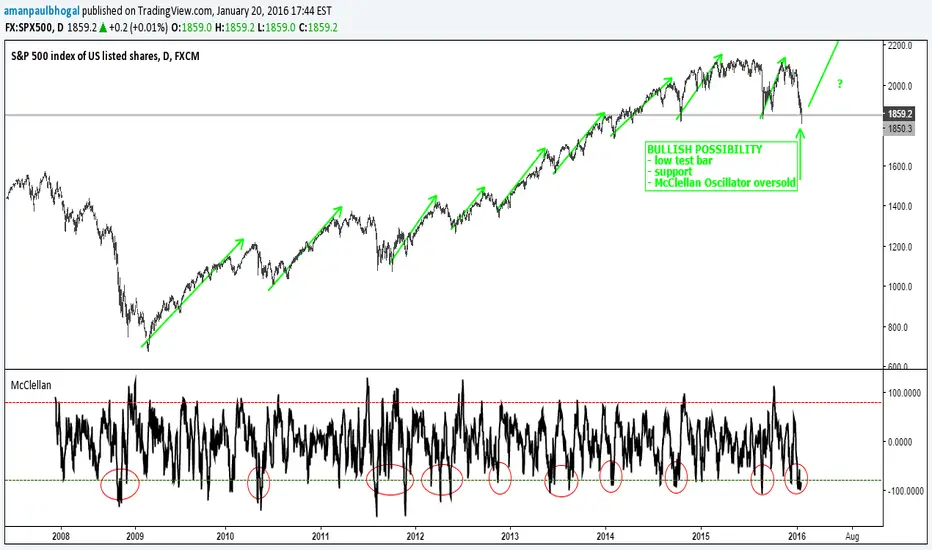
What is McClellan Oscillator saying about the major averages?Although I have a bearish view on the major global stock market indices from a longer term cyclical perspective ( see older post ) and growing bearish momentum in the beginning of 2016 may well be a starting point, the McClellan oscillator, historically during a deeper market correct when oversold (below -80) has price resume an upward rally. Seeing this in the American markets may be a sign of some possibly temporary buying relief. Nonetheless price cyclicity will lead the way in informing a more pronounced down trend/bear market as some other major indices.
Seen too in NAS100 and DIA a relief rally may ensue.
NAS100
DIA