EURAUD-1H-Long PotentailHello folks;
On the EURAUD we can see a RD+ and double bottom pattern which is a strong pattern for reversal on the other hand, on the major pivot point and demand zone has a nice hammer with a massive wick.Totally; we have lots of signals on the chart which is telling us the price's moving is gonna revers.For now, jump to the long position till our target what is marked on it.
Please put your comment and like .
If you would like my vision , analysis please follow me thanks guys.
Breakandretest

EURNZD sellEur/Nzd sell after price broke out of our key level, and came back for a retest. Price is pulling away from the zones, rejecting on the 4H time frame. Price is in an overall downtrend, as the weekly shows a very bearish candle, so we can expect a lower low.

AUDUSD// Break & Retest + More-3 Harmonic Patterns
-Break of TL --> Retest
-COT Report recently showed a decline in net positions, also a massive amount of shorts added.
Fundamentally, Im short...technically I like the long set up, but time will tell as the week goes on.
What are your thoughts?

XAUUSD-4H-ShortHello folks;
On Gold chart we can see an impulse and correction.After breakdown and retest the channel, chart makes a Head&Shoulders pattern.Guys totally ; we can find lots of reversal signal on the chart.Let's jump to the sell position with three targets.

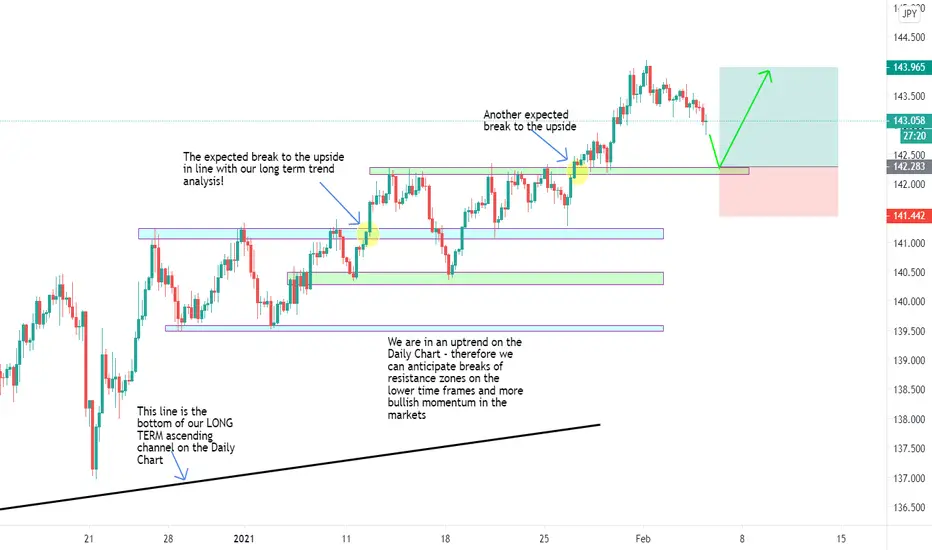
CAD/JPY - Price Following our Predicted Price PathWe can see price has retraced to retest our previous resistance zone before bouncing to the upside.
Once again, a classic break and retest setup on this pair.
If you have any questions, just drop me a DM!

EURJPY// UpdateLooking at the COT report, there seems to be some profit taking on the Euro.
Because of this along with some other factors I will be looking to for a long entry near the trend line and 50%.
**A Gartley formation is possible within the blue lines
Previous Analysis linked below.

EURAUD-1H-Long PotentailHi guys;
After breakout the Falling Wadge Pattern and Retest finally it triggered BUY Signal for safe entry.We are long till TP1 or TP2.Hope enjoy.
Please put your comment below.

GBP/JPY - Classic Simple SetupsA really simple analysis on GJ for you guys today!
More classic Break and Retest Setups on this pair - In line with the HTF bias we've been talking about for some time! Mark key levels - wait for breaks of these key levels - then wait for a retracement to test your marked key levels. See confirmation? Enter the trade?
If you don't know what this means, just drop me a DM!

USDJPY// Break & RetestPrice broke out of the channel and formed a harmonic Bat Pattern which signaled a reversal back towards the trendline.
The nose of all harmonics represent an area of strong support or resistance, and in this case it will be serving as support.
Also in this area is the trend line which price just broke through, about to retest.
There are fundamental factors at play this week that may have an effect on price.

EURUSD-4H-Short potentailHello guys;
Short setup for Sell traders .Hope everything goes well.
I look forward to hearing from you. Please PUT YOUR COMMENT BELOW.

Long ETH/USD, targetting highsAttemting to take advantage of the recent dip so I am longing ETH with a tight stop weary of market conditions.

audjpy continuationprice is currently at a strong area of resistance on 4h // however i spotted a flag which signifies a continuation .so a safer setup will be to look for a simple break and retest for a continuation of the bull run

GBPUSD RangingWaiting for GU to break the range either to the upside or downside, based on my GJ analysis I am buy bias on the pound.

GBP/JPY - Another Break and Retest Trade IdeaHTF - Bullish - Ascending Channel
Breaking levels to the upside consistently
Lets see if price falls to retest our top 4HR key level and bounces
DM me for more information!
Happy Trading!
EURAUD-4H-Wating for breakdownHI guys;
ON the EURAUD pair,we can see the price has a correction till upper trendline and after reached the trend line,price's reversed buy trendline.For present, we are watching the price's moving whenever it breakdown the key level and done the retest,can enter to a short position till the next strong support zone.

GBPJPY-1H-Short PotentailHello traders;
According to the Elliott Waves and Price Action analysis ; chart shows up some short signals that can enter to short position with 3 targets.
I look forward to hearing form you;
Put your comment right-away.

EUR/USD - Range broken to the DownsideBears continue to take control of this market as price breaks to the downside. Could we see a retest of previous support before further movement to the downside?
We forecasted a break to the downside because it was in line with our HTF directional bias on the pair. For more - just drop me a private message!

AUDND: Drop is coming based on fundamentals and price actionHere as you can see the market breaks sharply the previous low(support) and now it's going for re-test.
After the morning announcement for the second bond purchase the AUD lost a lot of strength
and the potential for a drop is high.
--> Wait for the market to re-test the resistance and SHORT THE TOP ! ! !

EURUSD Weekly RevisionOption 1
Market continues to go up until the Resistance on 1.255 then comes back down.
Option 2
Market makes a retracement until the market "Possible Buy Point" where we can see a possible support of a resistance broken.

FOREX - WEEKLY OUTLOOK FOR THE WEEK OF 1/24/21 - 1/29/21 Weekly analysis for the coming week. The volume was not there last week. Hopefully this week we get some momentum in the markets.
Indicator list:
- MA HIgh 5 Offset 3
- MA Close 21 offset 3
- Vortex Indicator 14 preset
FOREIGN CURRENCY TRADING IS HIGHLY SPECULATIVE AND RISKY. TRADE AT YOUR OWN RISK. Trading forex on margin carries a HIGH LEVEL OF RISK, and may not be suitable for all investors. Before participating in the FX market, you should carefully consider your investment objectives, level of experience, and risk appetite.
You should trade in foreign currency contracts only if you understand the contracts (and contractual relationships) into which you are entering and the extent of your risk exposure.

GOLD BUYGold finally broke out of its consolidation range after playing around for weeks, im looking to go long on the retest

INTRADAY IDEA - Selling out USDJPYBased on my opinion, I see price retesting previous support now turned resistance to continue its bearish drive. I'd like to take advantage of USD's instability. Furthermore, it is very likely that price would break the support it bounced off from yesterday's US Session.
Please exercise caution in trading.
Good luck!
Please consider following for more trade ideas.

Short idea GBP/AUDGA broke out of a bullish channel, and is retesting the trend line. The trend line is also a .618 fib level. With all the confluences, we can expect a good rejection of the level, and a push towards the downside. My first tp would be around 1.75554.
