eurjpy break and retest short move.eurjpy broke structure and fell down. waiting on retracement and retest of the bearish engulfing due to a quick imbalance of price that was created.
potential 5.88 RR
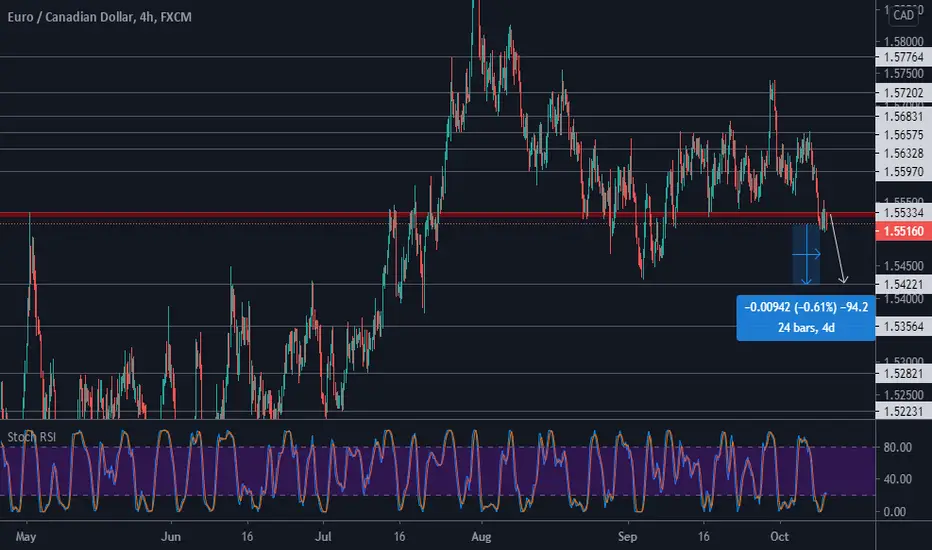
Breakandretest

LONG AUDUSDClear break and retest on the minute 15 candle chart. There is also confluence with my Fibonacci golden zone. I will be entering here after seeing price reject from this region. I have two positions running. Tp 1 for the first position is the -2700 extension, and for position two my TP is the extension right beyond that. Once the price reaches the 0.00 extension ( which is marked black) I will set SL to break even and let this baby run. Let's see what happens.

NZDUSD LONGI'm currently in here on NU long. I entered after a break and retest on the minute 15 candles with the confluence in my golden fib zone. Tp 1 is -27.00 extension, TP2 is the extension beyond that. I will move my SL to breakeven once I see a candle close above the 0.00 extension. Let's see what happens.

NZDJPY LONGClear break and retest of a minute 15 resistance level. There is also rejection at my golden fib zone. Im going long here to target the -27.00 extension as my profit target.

AUZNZD ShortPrice Broke the support and retest.
Price has the potential to reach next major support level.

GBPJPYSimple price action buy as GJ shows rejection to my 50.00 zone, and also gave me an engulfing setup all of this being in agreement with the daily trend. Going long off of a limit entry @ 136.516

Price Trapping with harmonics signalsHarmonics Scanners calling a SELL (butterfly pattern)
Rules on chart
use risk management


Break And Retest A Break And Retest On USDCAD, the rejection is off the 61.8 fib level... Potential setup for a short

EURUSD BREAK & RETESTHere we have a high probability drop.
CONFIRMATIONS:
1) It breaks & retest it's channel
2) Based on price action (1H candles seem to reject the buyers & wants to keep going down).
3) DXY (Dollar Index) seems to bounce up that mean the opposite for the EURUSD
4) It was forming for a drop but because USD PPI it go up to retest.
5) Market go to EMA 200 & respected it so EMA 200 works like resistance to EURUSD.
6) EMA 50 breaks EMA 200 to downside.
ENTRY: (1.1768)
STOP LOSS: (1.1803 - 35 pips)---> 1.1800 key level
TP1 : (1.1733 - 35 pips ) 1:1
TP2 : (1.1698 - 70pips) 1:2
HAVE FUN & HAPPY PROFITS ! ! !


AUDJPY, wait for pullback.Price is in an uptrend on the 4H time frame forming higher lows and higher highs. Price could either decide to pullback to the support and resistance zone before continuing to buy OR it could pullback to the trend line for a 3rd hit before continuing with this uptrend. Drop to a lower time frame for a better entry if this setup plays out. Happy trading!
Note: If price does not respect either of these zones and breaks through both the support zone and trend line, wait for a retest before looking for bearish trades.


Interesting shorting scenario for EURJPY (4R)On a weekly EURJPY is moving inside this descending channel, currently rejecting its upper border.
On H4 market broke consolidation area and now is retesting it.
This level was playing a big role in the past, as seen from the weekly chart.
This is round level of 125.00

NZDCAD, 4HR - Potential SellHead and shoulders pattern, price broke neckline. Waiting for a retest of the neckline and for price to show bearish signals at that level to proceed to sell at that level #newbietrader
Feedback is helpful
