NZDUSD is preparing for a reversal and a fallNZDUSD is in consolidation and preparing to exit it. Ahead is possible breakout of trend support and fall to 0.5757
The reason is as follows: change of fundamentals background (positive signals on tariff war), dollar growth and market reversal.
Scenario: break of consolidation support at 0.5885, price consolidation below this level - this will be a signal ready to start distribution, i.e. downward movement.
Primary target 0.5 fibo, secondary target 0.7 fibo
Breakdown

I'm shorting thisTwo weekly timeframe for a better understanding. Looks like a large bearish flag forming. Price just bounce off the bottom of the flag. But I think is a dead cat bounce. Is hitting a resistance level 35-36. Doesn't look too sting to break it up. SL triggers if a weekly candle breaks up the resistance and closes above it.

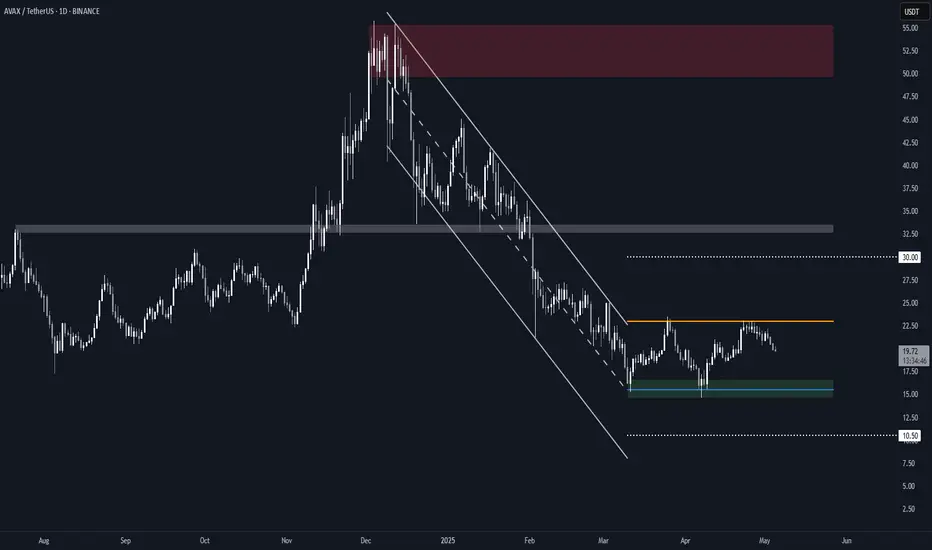
Avalanche (AVAX) RectangleBINANCE:AVAXUSDT is trading within a well-defined rectangle, after breaking out of a steep falling channel earlier this year.
Key Observations
• The current range has two clear touches on both support ($15.50) and resistance ($23.00), forming a valid rectangle structure.
• This follows a sideways channel breakout, suggesting a consolidation phase which is often a precursor to a larger move.
Range Levels
• Resistance – $23.00: Capped price twice in April, marking the upper bound of the rectangle.
• Support – $15.50: Held firmly on two separate pullbacks.
• Midrange Bias – As long as AVAX remains within this box, directional conviction remains limited.
Breakout/Breakdown Scenarios
• Bullish Breakout: If AVAX closes decisively above $23.00, the measured target would be ~$30, based on the rectangle height projected upward (linear scale).
• Bearish Breakdown: If it loses $15.50 support, the downside target becomes $10.50, calculated using the same rectangle height on log scale (to reflect proportional downside risk).
Until either side breaks, this remains a range-trading environment.
GOLD - Bearish Head and ShouldersHello Traders !
The GOLD price formed a head and shoulders pattern.
Currently, The neckline is broken !
So, I expect a bearish move📉
_______________
TARGET: 3170🎯

EURAUD - Bearish Head and ShouldersHello Traders !
The EURAUD failed to create a new higher high!
The price formed a head and shoulders pattern.
At the moment, The neckline is broken !
So, I expect a bearish move📉
_______________
TARGET: 1.71900🎯

NZDCAD - Bearish Triple TOPHello Traders !
On Monday 21 April, The NZDCAD reached the resistance level (0.83146 - 0.82973).
The price formed a triple top pattern.
Currently, The neckline is broken !
So, I expect a bearish move📉
______________
TARGET: 0.80610🎯

SILVER - BEARISH SCENARIOHello Traders !
The Silver price failed to create a new higher high !
Let's expect the bearish scenario:
If the market breaks the higher low and closes below that,
We will see a bearish move📉
TARGET: 31.23🎯

USOIL - Bearish Double TOPHello Traders !
The USOIL price formed a double top pattern.
Currently, The neckline is broken !
So, I expect a bearish move📉
________________
TARGET: 59.410🎯

AUDNZD - BEARISH MOVEHello Traders !
After a huge bearish move, The AUDNZD broke the support level (1.07312 - 1.07522).
This key level becomes new resistance!
So, I predict a bearish move📉
_______________
TARGET: 1.06100🎯

SPY/QQQ Plan Your Trade Update : EPP Flag Setup CompleteI created this video to highlight the current EPP Flag setup in the SPY/ES.
It is my opinion that the market are about ready to ROLL OVER into a downward trend because of this current EPP setup.
Once the FLAG forms (in this case a BULLISH FLAG), the next phase is a BREAKDOWN INTO CONSOLIDATION.
It is my belief the current FLAG will prompt a breakdown in price - moving into a lower consolidation range.
I'm highlighting this EPP pattern to help everyone learn how to use them more efficiently.
Get ready. If I'm right, we're going to see a big move downward over the next 2-4+ days.
Get some...
#trading #research #investing #tradingalgos #tradingsignals #cycles #fibonacci #elliotwave #modelingsystems #stocks #bitcoin #btcusd #cryptos #spy #gold #nq #investing #trading #spytrading #spymarket #tradingmarket #stockmarket #silver

AUDJPY - Bearish Triple TOPHello Traders !
The AUDJPY reached a strong resistance level !
The price formed a triple top pattern.
Currently, The neckline is broken !
So, I expect a bearish move📉
_________________
TARGET: 88.580🎯

NATGAS - Bearish Head and ShouldersHello Traders !
The Natural Gas price formed a head and shoulders pattern.
Currently, The neckline is broken !
So, I expect a bearish move📉
_______________
TARGET: 3.2350🎯

USDCHF - NEW BREAKDOWN !Hello Traders !
After a huge bearish move, the USDCHF broke the support level (0.83326 - 0.84152).
This key level becomes new resistance !
So, I expect a new bearish move📉
_______________
TARGET: 0.79300🎯

CHFJPY - New Breakdown !Hello Traders !
On Thursday 10 April, The CHFJPY reached the resistance level (175.849 - 174.326).
Currently, The higher low is broken (change of character).
So, I expect a bearish move📉
________________
TARGET: 172.580🎯

TSM respects levelsI have not looked at this chart in a long time. The levels are still holding up strong. It's in a rising channel. Currently it is weathering the channel well. Earnings 4/17 premarket. The day candle close 4/16 was bearish. Good earnings moves could change that.
*I just know that this company keeps semi & chips looking amazing for users & investors. I'll be watching and tuned in.

DOLLAR INDEX - Important BreakdownHello Traders !
Yesterday, The Dollar Index Broke the support level (103.200 - 103.700).
This key level becomes new resistance !
So, I expect a bearish move📉
________________
TARGET: 100.730🎯

GBPUSD - Support becomes ResistanceHello Traders !
The GBPUSD failed to break the resistance level (1.30490 - 1.29990).
The price broke the support (1.27592 - 1.28116).
This key level becomes new resistance !
So, I expect a bearish move📉
_____________
TARGET: 1.25900🎯

GBPCAD - BEARISH MOVEHello Traders !
The GBPCAD failed to create a new higher high !
Currently, The lower low is broken (Break of structure).
So, I expect a bearish move📉
______________
TARGET: 1.82340🎯

SILVER - BEARISH SCENARIOHello Traders !
After a huge bearish move,
The silver price reached the support level (28.70 - 29.0).
So, let's expect the bearish scenario:
If the market breaks below the support level and closes below that,
We will see a new bearish move📉
TARGET: 26.65🎯
Previous Analysis:

SOL ANALYSIS🔮 #SOL Analysis 🚀🚀
💲💲 #SOL is trading in a Ascending Broadening Wedge Pattern and there is a breakdown of the pattern. And we can expect more bearish move towards it's support zone and the a reversal
💸Current Price -- $119.10
⁉️ What to do?
- We have marked crucial levels in the chart . We can trade according to the chart and make some profits. 🚀💸
#SOL #Cryptocurrency #DYOR

CHFJPY - Bearish Rising WedgeHello Traders !
The CHFJPY failed to create a new higher high!
The price formed a rising wedge pattern.
Currently, The support line is broken !
So, I expect a bearish move📉
________________
TARGET: 168.750🎯

EURCAD - Descending TriangleHello Traders !
On Tuesday 11 March, The EURCAD reached a strong resistance level (1.61530 - 1.57962).
The price formed a descending triangle pattern.
Currently, The support level is broken !
So, I expect a bearish move📉
____________
TARGET: 1.52350🎯

GBP/USD Breakdown – Bearish Momentum Ahead?This 4-hour chart of GBP/USD shows a clear bearish setup:
🔹 Rising Wedge Breakdown – The pair has broken below a rising wedge pattern, signaling potential downside pressure.
🔹 Support and Resistance Levels –
Resistance at 1.29206 - 1.30275
Support at 1.28000 - 1.28437
Strong support at 1.27539
🔹 Sell Confirmation – A sell signal is indicated, suggesting further downside movement towards the target zone.
📉 Trading Plan:
✅ Possible short entries below the 1.28956 level.
✅ Target price: 1.27539
✅ Stop-loss above 1.29206 for risk management.
⚠️ Risk Note: Always manage risk properly and watch for any trend reversals before entering trades.
What are your thoughts? Are you bearish or bullish on GBP/USD? 🤔💬
