GBPCHF | Perspective for the new week | Follow-UpWith over a thousand pips since my last publication on this pair (see link below for reference purposes); The Pound has enjoyed dominance over the Swiss franc in the last couple of months and we are presently witnessing a drop in Bullish momentum as price action appears to have transitioned into a corrective phase since the successful Breakdown of Fr1.28000 (Key level) on the 7th of April 2021. Even though we are on an overall Bullish trend (see weekly chart); I am planning to take a counter-trade opportunity on this pair, why?
We might be experiencing a risk of further decline in the coming week(s) as participants who took advantage of the Bull do quick profit-taking with high hopes of a rally in the nearest future.
Tendency: Downtrend ( Bearish )
Structure: Breakdown | Supply & Demand
Observation: i. Breakdown of Key level @ Fr1.28000 has been followed with the multiple rejections of this level as price continues to trade under in the last one month.
ii. From a Bearish perspective, trading below Fr1.28000/1.27000 seems to be a safe juncture to place sell orders in the coming week(s).
iii. Even as Bearish momentum appears imminent, it is important that we take into consideration the major Demand zone @ Fr1.26000/1.25500 area which has held price "supported" since Feb 2021.
iv. With such a strong Demand level ahead of us on this Bearish journey, it is advisable that we remain conscious as any significant rejection of this level might incite a rally continuation.
v. However, should a Breakdown of Demand level happens in the coming week(s); an opportunity to add a position at retest appears to be most appropriate.
vi. CAUTION:
a. Break above and retest of Fr1.280000 incites rally continuation
b. Long term perspective is Bullish hence the need to be conscious throughout the course of this trade is VERY VERY important... Trade consciously! :)
Trading plan: SELL confirmation with a minimum potential profit of 200 pips.
Risk/Reward : 1:4
Potential Duration: 6 to 10days
NB: This speculation might be considered to make individual decisions on the lower timeframe.
Watch this space for updates as price action is been monitored.
Risk Disclaimer:
Margin trading in the foreign exchange market (including foreign exchange trading, CFDs, etc.) has a high risk and is not suitable for all investors. The content of this speculation (including all data) is organized and published by me for the sole purpose of education and assistance in making independent investment decisions. All information herein is for your reference only and I take no responsibility.
You are hereby advised to carefully consider your investment experience, financial situation, investment objective, risk tolerance level, and consult your independent financial adviser as to the suitability of your situation prior to making any investment.
I do not guarantee its accuracy and is not liable for any loss or damage which may result directly or indirectly from such content or the receipt of any instruction or notification therewith.
Past performance is not necessarily indicative of future results.
Breakdown

EURCHF | Perspective for the new weekAfter moving over 350pips in our direction since my last speculation on this pair (see link below for reference purposes); the breakdown of the Demand zone which has held price "Supported" in the last 70 days was finally broken to the downside giving rise to a "quick" counter-trend opportunity in the coming week(s).
Tendency: Downtrend ( Bearish )
Structure: Supply & Demand | Breakdown | Trendline
Observation: i. The Bullish run that began mid-February 2021 and peaked @ Fr1.11500 appears to be going through a Corrective phase.
ii. The Breakdown of Fr1.09800 during last week trading session signals the seller's strength at this juncture in the market.
iii. With Bearish tendencies "screaming" since Breakdown, I am of the opinion that a potential new Supply level around Fr1.0200/1.09800 shall crystallize in the coming week.
iv. A comfort entry after a further Breakdown/retest of Key level @ Fr1.09500 in the coming week(s) should trigger confirmation with the aim of testing Bullish Trendline (Check the weekly chart below).
v.This been said, there is also a possibility that the Bullish trendline on the weekly chart might be broken (considering the long-term bearish perspective) hereby welcoming an opportunity to add position at retest... Trade consciously! :)
Trading plan: SELL confirmation with a minimum potential profit of 130 pips.
Risk/Reward : 1:4
Potential Duration: 5 to 10days
NB: This speculation might be considered to make individual decisions on the lower timeframe.
Watch this space for updates as price action is been monitored.
Risk Disclaimer:
Margin trading in the foreign exchange market (including foreign exchange trading, CFDs, etc.) has a high risk and is not suitable for all investors. The content of this speculation (including all data) is organized and published by me for the sole purpose of education and assistance in making independent investment decisions. All information herein is for your reference only and I take no responsibility.
You are hereby advised to carefully consider your investment experience, financial situation, investment objective, risk tolerance level, and consult your independent financial adviser as to the suitability of your situation prior to making any investment.
I do not guarantee its accuracy and is not liable for any loss or damage which may result directly or indirectly from such content or the receipt of any instruction or notification therewith.
Past performance is not necessarily indicative of future results.

$SPY Could Drop To $396The S&P 500 has slowed down in its growth and needs a correction soon. On this daily chart, you can see a rounding top forming near an important resistance line. In addition to that, the RSI has formed a bearish divergence pattern. We are also still in a major earnings season. I have added a fibonacci retracement to the chart to show that that 50% retracement at $396 has been an important level in the past. This price level could potentially act as support in the near future. Comment your thoughts :) Good Luck!

USD/INR trading signalsAn ascending triangle formation on a 1h-4h time frame and can be used to either breakdown or breakdown from the trendline.
Disclaimer: used for educational purposes only
FX_IDC:USDINR

EURUSD | Perspective for the new week | Follow-upWe have been on standby since my last publication on this pair as it took price over two weeks to come to our proposed Supply zone (see link below for reference purposes).
The last few days of last week trading session witnessed a strong Bearish pressure mounts as the price rejects the $1.21500 area which is represented on the chart with a bearish engulfing candle. A plunge on Friday saw the Greenback strengthened amid a dismal market’s mood which could be related to end of the month profit-taking by participants who took advantage of the Bull that began the month of April 2020.
Tendency: Downtrend ( Bearish )
Structure: Breakdown | Supply & Demand | Reversal pattern | Channel
Observation: i. It is completely obvious that price is within a pattern formed from two downward trendlines drawn above and below price action represented by resistance and support levels since December 2020.
ii. The Demand level which held price "supported" @ $1.20000 in the 3 months was finally broken (March 2021) giving way for Sellers to push price below thereby respecting the Descending Channel.
iii. A breakout of the Channel that occurred on the 20th of April 2020 is yet to be confirmed successful or not as a rejection/breakdown of my Key level in the coming week shall help me make a decision.
iv. The Channel Breakout shall be regarded false if the price closes below Key level hereby confirming an opportunity to sell the Euro in the coming week(s)... Trade consciously!
Trading plan: SELL confirmation with a minimum potential profit of 350 pips.
Risk/Reward : 1:4.5
Potential Duration: 10 to 20days
NB: This speculation might be considered to make individual decisions on the lower timeframe.
Watch this space for updates as price action is been monitored.
Risk Disclaimer:
Margin trading in the foreign exchange market (including foreign exchange trading, CFDs, etc.) has a high risk and is not suitable for all investors. The content of this speculation (including all data) is organized and published by me for the sole purpose of education and assistance in making independent investment decisions. All information herein is for your reference only and I take no responsibility.
You are hereby advised to carefully consider your investment experience, financial situation, investment objective, risk tolerance level, and consult your independent financial adviser as to the suitability of your situation prior to making any investment.
I do not guarantee its accuracy and is not liable for any loss or damage which may result directly or indirectly from such content or the receipt of any instruction or notification therewith.
Past performance is not necessarily indicative of future results.

Bitcoin Could Hit 40k SoonWhen looking at how far a security could dip I generally like to look at key fib areas, particularly that .5 level. In this case, we see that Bitcoin has reacted well to this level in the past. We have completed the long-term impulsive wave and growth has slowed down in the recent extended wave. We have now created a lower low, which means the uptrend could be over for the time being. We also made a doji candle yesterday, which could mean that this strong week we had could simply be part of the bigger correction wave. Of course, it is possible that the bulls will not allow this to fall as far as 40k, but this is my personal opinion. Good Luck!

BTC close to forming a golden crossBTC broke above the 200 hourly MA,
currently brushing against a trend line and getting close to forming a golden cross,
expect a breakout or breakdown soon.

ETHBTC - A simple approachShowing support is greatly appreciated and keeps up the motivation in continuous ideas and education for the community.
Observe: 0.041895, 0.045950
Two prices that indicate structure, we can now quickly identify that both prices have been important in a direction, volume and liquidity change, thus giving us key identifiers we can label for reference when we analyze a chart.
You can use the "Horizontal Line" tool to analysis almost any security across multiple time frames, it's use is widely forgotten and you can't simplify a chart any less...
Horizontal Line Tool:
- Mark out important prices
- Help show a position, entry, stop
- Plot important alerts
- Simplify Analysis
If you'd like more quick educational posts like this, show us some support

Bitcoin inverse head & shoulders + FibonacciAs you can see drawn in the chart, we could potentially see a re-test of the left shoulder as we create an inverse Head & Shoulders.
This level is also coincidental with the 61.8% fibonacci retracement level ($43K), which many call "the point of no return", meaning a breakdown below this level is expected to reach 100% retracement, which is around $29K.
The 50sma is has been working well since the end of October 2020. And will be important to retake if the bulls want to take control.


No Mans LandThe symmetrical triangle is now invalidated due to the break below the yellow dotted line and we find ourselves in a descending triangle in the context of an uptrend (solid yellow line horizontal blue line).
Strong Blue line support @ 0.255.
The previous symmetrical triangles' lower trendline (Yellow dashed) is now acting as resistance.
So what does this all mean:
Bullish Case:
We breakout over the solid yellow line and move much higher where the dashed yellow line acts as a temporary pause. Based on the chart this could take up to May 7th to play out.
Bearish Case:
We break down and hold below 0.25, which would be very bearish as the next level of support below that is at 0.18.
Some observations:
The pace of the down move over the last 2 days has slowed as compared to the initial descent from 0.42 which is slightly bullish, however, there is some extremely unusual trading activity between 0.3 to 0.32 (heavy selling and buying)
Fingers crossed, let me know your thoughts and observations!

GOLD Scalp breakdownRisking 1%, one winning scalp a day is all you need. Enjoy the rest of the day! Keeps you from overtrading, revenge trading, and minimizes losses. If you start with 200$ account , and make 1% profit each day, your equity will be approx. 45M$ 5 years later!
Two trades a day. If the first one is a loser, another trade can fix that. 2 losers, end of day. 1L and 1W, you are the winner. End your day.
A third trade is allowable under certain circumstances. Like market conditions, reduced position size (risking only the day's profit), and the like.
"How do I control my greed?"
Here you go....

Bitcoin U.S. Dollar 1H Triangle formation Rising wedge broke down with price now consolidating in a triangle.
This one has a bearish bias but with BTC you never know.
I currently closed my short, will be trading a breakout With a proper, valid retest.
Goodluck, a deep one may be coming.

Breakdown Play on the EURJPYThe EURJPY is currently trading within the boundaries of a major range (spanning between 130.600 and 129.800). If the price manages to break down below the lower boundary of the range, this would open up the possibility for another breakdown towards 128.400 (previous swing low).
Such a breakdown would be confirmed if the price manages to penetrate below the 100-day MA (in blue) first and then below the 200-day MA (in red). Notice that the latter is currently converging with the lower boundary of the range.


The Coinbase Listing Will be a Bearish Catalyst Coinbase will be a big name within the NASDAQ though i dont expect that it will have a good first couple of weeks i believe it will have major downside price action and that it will drag the rest of the index down with it.
Many private investors bought Coinbase under 300 dollars and i expect they will sell it down to around 269 at the very least.

CADJPY - FREE BREAKDOWN Hello traders and welcome to this free analysis breakdown.
In this video you will see me map the market and show possible trade areas on the CADJPY .
Once this pair gives me a valid signal i will place the trade idea in to the Honest Financial Community. I hope you have found this video educational, if you like our content then please like and follow the channel.
Please comment below for feedback and what you would like to see regarding education or an asset analysis breakdown.
Trade Safe.

USDCHF | Perspective for the new week | Follow-upWe had a very good trading opportunity on our last trade on this pair as the price moved over 500pips in our direction since my last publication (see link below for reference purposes). Fr0.92300 has held price "Supported" five good times in the past hereby making this level a very viable Demand zone we can "trust". However, this same level has been a strong Support/Resistance level on the weekly chart (see below) and considering this character I shall be very careful here as a Breakdown might insinuate a risk of further decline... Let's take a look at what I think;
Tendency: Neutral
Structure: Breakdown | Supply & Demand | Trendline | Reversal Pattern (H and S)
Observation: i. The Trendline indicated on the chart has been a significant factor in deciding the prevailing bias of participants in the market since December 2020 as price tend to follow in the direction of a Break above/below at any given point in time.
ii. Since the break above of trendline (Fr0.91400) happened in early March 2021, Price has found a niche above Fr0.92200 which has become a strong Demand level.
iii. Demand level is considered strong due to the number of times the price has rejected this level to the upside in the past (five times!).
iv. Even as this level is considered strong, I am in a dilemma as the Breakdown of the Trendline during last week trading session might either be a false Breakdown or an incitation of a further decline in the nearest future should the price decide not to respect the Demand zone and do a Breakdown.
v. To be on the safe side for a rally continuation, I shall be looking to buy above Neckline which will also be a Key level @ Fr0.92750 for Bullish expectations.
vi. How to know if Breakdown is valid or not? When the price does not respect Demand zone and break down the Fr0.92000 area then we look forward to correction of Breakdown to join the decline train.
vii. This been said, we can not ignore the Reversal setup forming on the Daily chart as I see a Head and Shoulder pattern forming should price rally in the coming week (see chart below).
Trading plan: BUY confirmation with a minimum potential profit of 150 pips.
SELL confirmation with a minimum potential profit of 170 pips.
Risk/Reward : 1:5
Potential Duration: 5 to 10days
NB: This speculation might be considered to make individual decisions on the lower timeframe.
Watch this space for updates as price action is been monitored.
Risk Disclaimer:
Margin trading in the foreign exchange market (including foreign exchange trading, CFDs, etc.) has a high risk and is not suitable for all investors. The content of this speculation (including all data) is organized and published by me for the sole purpose of education and assistance in making independent investment decisions. All information herein is for your reference only and I take no responsibility.
You are hereby advised to carefully consider your investment experience, financial situation, investment objective, risk tolerance level, and consult your independent financial adviser as to the suitability of your situation prior to making any investment.
I do not guarantee its accuracy and is not liable for any loss or damage which may result directly or indirectly from such content or the receipt of any instruction or notification therewith.
Past performance is not necessarily indicative of future results.

EURUSD | Perspective for the new weekThe rise in US government bond yields (when 10-year yields went as high as 1.68%) appears to be having a positive effect on the Greenback as I look forward to a bearish momentum in the coming week(s). With lines drawn by connecting the lower highs and lower lows of price with parallel trendlines, It is obvious that price has been caught within a Channel in a downward trend since December 2020 as the new year started with what looks the beginning of a reversal pattern and it doesn't appear to change unless we experience a significant Breakout of Trendline.
Tendency: Downtrend ( Bearish )
Structure: Breakdown | Supply & Demand | Channel | Reversal pattern
Observation: i. Buyers completely lost grip of the $1.2000 level in early March 2021 resulting in a Breakdown that tested Channel the third time.
ii. A couple of rejection of the $1.2000 level after the Breakout (double rejection on the chart) reveals the selling pressure at this juncture.
iii. The resulting line drawn over pivot high (represented on the chart as Pivot I & II) reveals the prevailing direction of price action since it hit peak @ @1.23500.
iii. As I look forward to a possible Pivot III, I have identified the $1.2100/1.19500 area to be a new area to look out for selling opportunity in the coming week(s).
iv. A word of caution: Should price decide to make a significant Breakout of Channel/Trendline to the upside @ $1.21000, set-up shall be disregarded for a rally with retest expectations... trade consciously :)!
Trading plan: SELL confirmation with a minimum potential profit of 350 pips.
Risk/Reward : 1:3
Potential Duration: 6 to 10days
NB: This speculation might be considered to make individual decisions on the lower timeframe.
Watch this space for updates as price action is been monitored.
Risk Disclaimer:
Margin trading in the foreign exchange market (including foreign exchange trading, CFDs, etc.) has a high risk and is not suitable for all investors. The content of this speculation (including all data) is organized and published by me for the sole purpose of education and assistance in making independent investment decisions. All information herein is for your reference only and I take no responsibility.
You are hereby advised to carefully consider your investment experience, financial situation, investment objective, risk tolerance level, and consult your independent financial adviser as to the suitability of your situation prior to making any investment.
I do not guarantee its accuracy and is not liable for any loss or damage which may result directly or indirectly from such content or the receipt of any instruction or notification therewith.
Past performance is not necessarily indicative of future results.

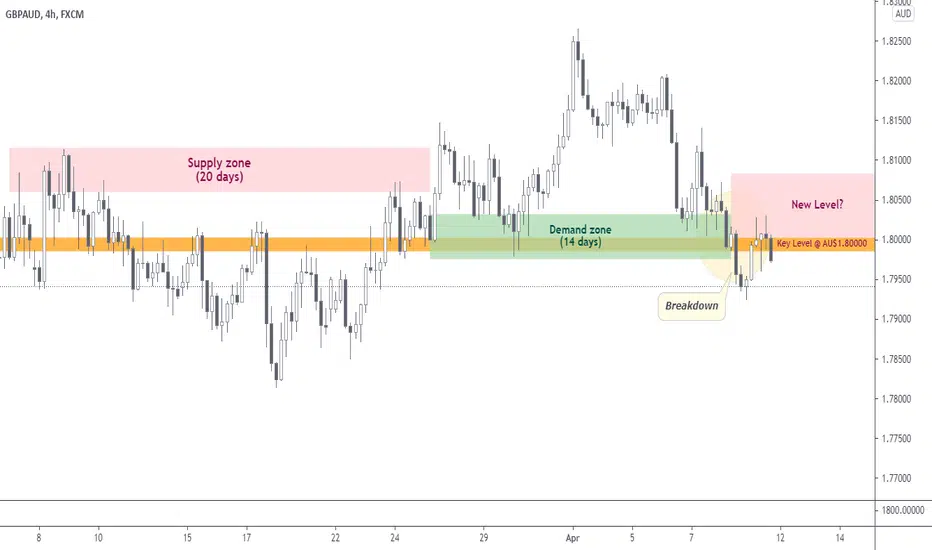
GBPAUD | Perspective for the new week | Follow-upDespite moving over 250pips in our direction since my last publication; the Bullish tendency projected never gained significant traction as the price finally broke down the Bullish Trendline which also coincides with my Key level @ AU$1.80000 during last week trading session (see link below for reference purposes). As my previous Bullish bias appears to slip away considering the recent breakdown of Key level and previous Bullish trendline, I shall be looking forward to Bearish tendencies this coming week(s) around and below my Key level @ AU$1.80000.
Tendency: Downtrend ( Bearish )
Structure: Breakdown | Supply & Demand
Observation: i. It is fascinating how the Key level @ AU$1.80000 has served as a major determinant of the prevailing bias of price action in the last 36days.
ii. Demand zone which has held price "supported" in the last 14days appears to have handed the baton to the Bears as breakdown followed by rejection of this level points at a possible shift in perspective has happened.
iii. My Key level @ AU$1.80000 shall be my yardstick for Bearish expectations in the coming week as any spot below this level is good for me to open a position!
iv. This been said, I am advising that taking this trade requires utmost attention as the tendency of an uptrend can not be ignored considering the observations made in my last publication (see link below) and factors that might disrupt this setup giving way for an immediate rally continuation can happen anytime (hereby considering the Breakdown a false one!)... trade consciously :)!
Trading plan: SELL confirmation with a minimum potential profit of 250 pips.
Risk/Reward : 1:3.5
Potential Duration: 5 to 12days
NB: This speculation might be considered to make individual decisions on the lower timeframe.
Watch this space for updates as price action is been monitored.
Risk Disclaimer:
Margin trading in the foreign exchange market (including foreign exchange trading, CFDs, etc.) has a high risk and is not suitable for all investors. The content of this speculation (including all data) is organized and published by me for the sole purpose of education and assistance in making independent investment decisions. All information herein is for your reference only and I take no responsibility.
You are hereby advised to carefully consider your investment experience, financial situation, investment objective, risk tolerance level, and consult your independent financial adviser as to the suitability of your situation prior to making any investment.
I do not guarantee its accuracy and is not liable for any loss or damage which may result directly or indirectly from such content or the receipt of any instruction or notification therewith.
Past performance is not necessarily indicative of future results.
Potential Anti on $ACI4 pushes followed by a sharp momentum against & consolidation near that bottom of the range. Looks like a very well anti setup to me. Market is still strong, but I do like my chances for a short on a further breakdown.
Potential entry: 18.45 - 18.3.
Potential stop loss: 18.75 - 19.
Trade management: take at least 75% of position off at 1R.
