***Short Opportunity***Looks like will be testing 152 level soon. would be nice if it rallys up to 2day Vwap and fails, so we can short on the way down below 1day vwap.
Breakdown


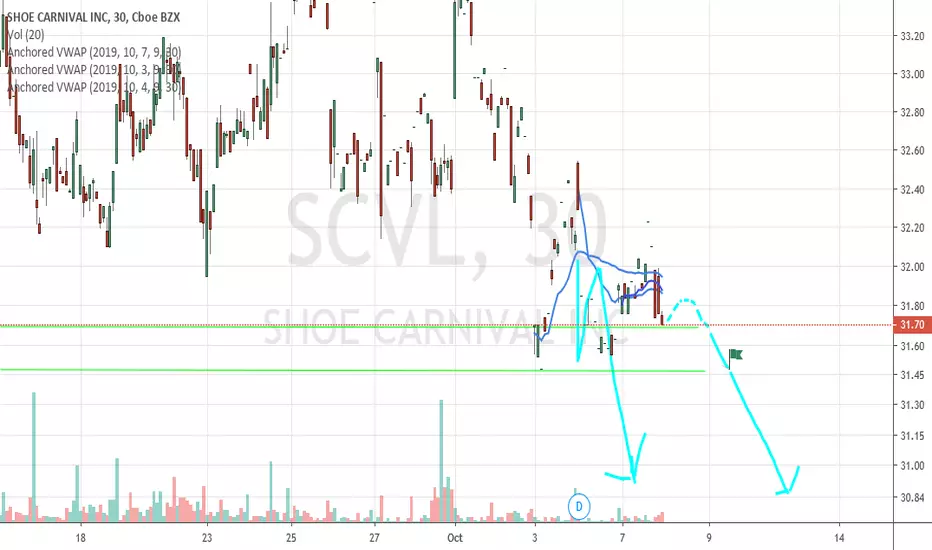
***Short Opportunity***Rally up to 2day VWAP, fail and short on the way down below 1day VWAP. around 31.47 level.


Possible ShortHas very strong support around the 46 range. if it breaks below this level in a convincing way, we may see a large drop.


FKLI - Bearish Breakout From Symmetrical TriangleFKLI - Our index has just broke down from crucial support level at 1,580 and at the same time broke out from symmetrical triangle, which is bearish continuation signal. Stochastic is weakening again. Further downside can be expected towards 1,530


Dow in C leg of ABC Correction: Bounce After or Rejection at TL?Chart says all. Looks quite Bearish but no capitulation as of yet. C waves tend to be fierce and furious. See what it does when Gap fills from 9/04.
Bulls will likely return for another crack at ATH if they can hold the line near 26200. SPX should find support near 2900, at least in this first downdraft. Second support at 2860; breakdown through these levels will likely lead to panic selling and capitulation down to August prices or lower. It is possible a Bear Market is beginning, but too soon to tell.
Have to see if an ATH can be developed by EOY. Trade day-by-day now and hold ur hand close! Rejection from the wedge TL on a bounce could lead to a fully developed 5-wave Elliott impulse downtrend. Failure in China will certainly precipitate this kind of Bearishness.
RUT is getting killed and shows greatest weakness. Expect Flight to Quality to boost US 30 more than NQ, RUT. SPY has been most Bullish of these and might suffer less.
Just an idea, not advice; trade at your own risk!


