Solana (SOL) Cup & Handle (1W Log)BINANCE:SOLUSDT has formed a Cup & Handle pattern on the weekly chart, and arguably already broke out of the handle.
The measured move target based on the linear depth of the cup is ~$510.
Key Levels to Watch
• ~$100: Local low and 0.618 Fib of the cup depth, a typical handle retracement in a Cup & Handle pattern.
• $260: Cup & Handle neckline and key horizontal resistance. A decisive weekly close with strong volume above this level would confirm the pattern and activate the measured move target.
• $510: Measured move target based on the depth of the cup from the neckline.
Considerations
Volume confirmation remains key. A breakout above $260 with strong volume could validate the pattern and open the path to $510.
Breakout!

Maruti Suzuki Chart Breakout Watch | Ascending Triangle PatternNSE:MARUTI
Maruti Suzuki is currently forming a bullish ascending triangle pattern on the 1-hour chart, indicating potential for an upside breakout.
1. Pattern Formation: The price is making higher lows while facing horizontal resistance near the 12,700 zone — forming a classic ascending triangle.
2. Support Zone: Trendline support is holding well, currently near 12,550.
3. Breakout Levels: A confirmed breakout above 12,700 could trigger a sharp move toward the next resistances at 12,888, 13,075, and possibly 13,454.
4. Bullish: Post-breakout, price action is expected to retest and then rally — as shown by the projection arrows on the chart.
5. Volume Confirmation : Watch for volume expansion on breakout to confirm strength.
Trading Plan:
Buy on Breakout : Enter long above 12,700 with targets of 12,888 - 13,075 - 13,454. Use SL below 12,550.
Wait-and-Watch : If price fails to break out, stock may stay range-bound or retest trendline support.
Conclusion:
Price action suggests strength building up. A breakout from this pattern could lead to a fresh rally — ideal setup for short-term swing trades

Bitcoin Ascending Triangle (4H)BINANCE:BTCUSDT might be forming an ascending triangle on the 4H chart, with a horizontal resistance at $105k and support being the resistance of the broadening wedge we identified last week: Bitcoin Ascending Broadening Wedge (4H)
A sustained break above $105k would set the target at $109k, very close to ATH.

DAX WILL KEEP GROWING|LONG|
✅DAX is trading in an uptrend
And the index made a bullish
Breakout of the key horizontal
Level of 23,400 and the breakout
Is confirmed so we are bullish
Biased and we will be expecting
A further bullish move up
LONG🚀
✅Like and subscribe to never miss a new idea!✅
Disclosure: I am part of Trade Nation's Influencer program and receive a monthly fee for using their TradingView charts in my analysis.

OP/USDT Breakout Alert!!🚀 OP Breakout Alert – 100% Potential Incoming?! 👀🔥
Hey Traders! If you're all about high-conviction plays and real alpha, smash that 👍 and tap Follow for more setups that actually deliver! 💹💯
OP has successfully broken out from the falling wedge pattern on the daily timeframe, which historically signals a strong trend reversal. After retesting the breakout zone, price action looks ready for a fresh upside move!
🔹 Entry: CMP and add more up to $0.76
🎯 Targets:
→ $0.98
→ $1.21
→ $1.43
→ Final Target: $1.64
🛑 SL: $0.688
⚙️ Leverage: Low leverage (Max 5x)
📊 Structure:
Falling wedge breakout ✅
Retest holding strong ✅
Volume starting to pick up 📈
We’re watching closely—this setup has the potential to mimic the last 114% rally. Let's see how it unfolds! 🚀
💬 What’s your take on OP from here?

GOLD - Price can continue to decline to support levelHi guys, this is my overview for XAUUSD, feel free to check it and write your feedback in comments👊
A few days ago price reached $3075 level, broke it, and then rose a little, but soon turned around and made correction movement.
Next, price entered to triangle, where it reached support line, at once, and then made an upward impulse.
Price broke $3075 level and soon reached and broke too $3290 level, after which Gold rose to resistance line.
After this, price turned around and corrected $3290 level, but then it came back to resistance line.
But recently, Gold dropped to support line of triangle, breaking $3290 level and making a gap, after which it exited from triangle.
Now I think XAU can make a retest, after exiting, and then continue to decline to $3075 support level.
If this post is useful to you, you can support me with like/boost and advice in comments❤️

XAUUAD UPDATE 15-5-2025This chart is a technical analysis of CFDs on Gold (US$/OZ) with a 1-hour timeframe. Here's a breakdown of the key elements:
Chart Patterns:
1. Falling Wedge Pattern:
A clear falling wedge is outlined with blue trendlines converging downward, typically a bullish reversal pattern.
The price has tested the lower boundary multiple times, suggesting a strong support zone.
2. Projected Breakout:
An upward arrow indicates a possible breakout from the wedge.
The breakout zone appears to aim for the 3,473.994 level, marked with a red line.
A potential rally target is highlighted in a yellow zone, between approximately 3,400 and 3,500.
3. Support & Resistance:
Support: Around 3,122.690 (green line at the bottom).
Resistance: Approximately 3,261.270, with further resistance near 3,473.994.
4. Volume:
There’s steady volume activity, which could indicate accumulation before a breakout.
5. Fib Level:
A Fibonacci retracement level around 0.793, often used to confirm reversal zones.
6. US Economic Events:
Two U.S. flag icons suggest important economic data releases, which might trigger volatility and influence the breakout.
Conclusion:
This chart suggests a bullish outlook for gold, expecting a breakout from the falling wedge and targeting the 3,400–3,500 zone. However, the movement could be influenced by upcoming economic data, so it’s essential to watch for confirmation before acting.
Would you like an interpretation in a different format (e.g., simplified summary or trading plan)?

Monthly Closing above 7.50 - 7.60 will be very healthy!
Monthly Closing above 7.50 - 7.60
would be a very healthy sign.
We may then easily witness upside
towards 8.70 - 9.10 & then 10.50 - 11
Remember it is in a long consolidation
with Slowly moving in an Upward Channel.


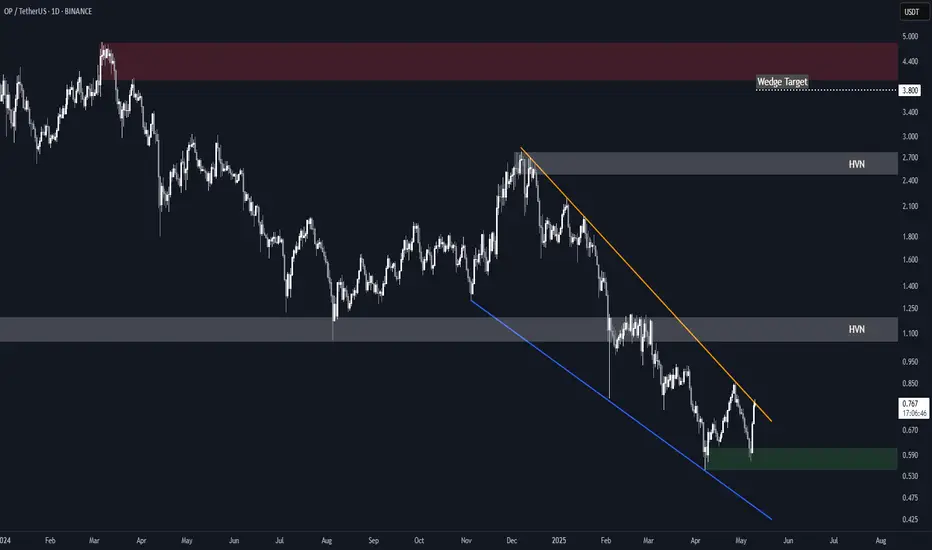
Optimism (OP) Falling WedgeBINANCE:OPUSDT is attempting a breakout from a 14 months long falling wedge.
A sustained break above the resistance in the near term would set the target at $3.80, just shy of the main $4.00-$4.80 supply zone.
Key Levels to Watch
• $0.55-$0.60: Main demand zone and invalidation point for the setup
• $1.00-$1.20: High Volume Node and key S/R dating back to June 2023.*
• $2.50-$2.80: High Volume Node and wedge high point.*
• $4.00-$4.80: Main supply zone.
* These could offer resistance and represent good levels for partial TPs.
DLF BUILDING ABOVE CHANNEL RANGE DLF Limited is one of India's leading real estate development companies, founded in 1946 by Chaudhary Raghvendra Singh. It is headquartered in New Delhi and has developed residential, commercial, and retail properties across Delhi, Gurgaon, Haryana, and other regions.
Key Highlights:
- Industry: Real Estate
- Market Presence: Offices, apartments, shopping malls, hotels, and golf courses
- Major Projects: DLF Cyber City, DLF Mall of India, DLF Emporio, and various residential townships
- Revenue (2024): ₹6,958 crore (US$820 million)
- Net Income (2024): ₹2,724 crore (US$320 million)
Support & Resistance Levels
- Support: 670 INR
- Resistance: 695 INR (Potential breakout level)
- Next Target Levels: 740 INR and 800 INR (If breakout above 695 INR occurs)
Market Sentiment
- Overall Trend: Bullish
- Short-Term Outlook: Positive momentum with potential breakout
Short-Term Target Levels
- Immediate Resistance: 695 INR (Breakout level)
- Next Target: 740 INR (If breakout above 695 INR occurs)
- Higher Target: 800 INR (If momentum sustains)
- Support Levels: 670 INR (Key support zone)

SHYAMMETLSHYAMMETL giving cup & handle breakout with decent increased volume. It is showing strength after recent fall. Now it it sustains above 958 then it may take a fresh ride from hereon. It may take a ride up to 25-27%. Closing below 890 may change my view for it.

Axie (AXS) Structure Analysis (1W - Log)After retesting the ~$2.0 demand zone, BINANCE:AXSUSDT broke out of its recent downtrend and could be headed for an attempt to reclaim the ~$4.0 S/R.
Key Levels to Watch
• ~$2.0: Demand zone dating back to May 2021, and current support. Any sustained break below it would invalidate any bullish TA.
• ~$4.0: Previous multi-year key support, and likely a strong resistance. Reclaiming it would flip the bias to bullish. It also aligns with the 200-day EMA, which has been very relevant for AXS in the past.
• ~$13.0: Multi-year S/R, and a reasonable target if ~$4.0 is reclaimed.
Still in a No-Trade Zone for me, until ~$4.0 is successfully reclaimed.

NZDUSD - NEW BREAKOUT !Hello Traders !
On Monday 12 May, The NZDUSD reached the support level (0.5853 - 0.5830).
The price broke the lower high (change of character).
So, I expect a bullish move🚀
_______________
TARGET: 0.60030🎯

HelenP. I Gold can decline to trend line and then start to growHi folks today I'm prepared for you Gold analytics. If we look at the chart, we can see how the price after several failed attempts holds in a support zone. The structure of this correction has formed beneath the previously broken trend line, and the price is now approaching it from above. What’s important is that buyers previously stepped in around this level, forming a bounce that allowed the market to reach toward the resistance zone near 3350. This area still remains unbroken, making it a magnet for future bullish targets. Currently, price action shows signs of local weakness, but the broader context favors a potential rebound. The confluence between the horizontal support zone and the descending trend line adds extra technical weight to this level. If price can stabilize here, I expect a retest of 3205, and a potential breakout above it could open the way toward my goal at 3260. This scenario assumes continued respect of the trend line as dynamic support. A clean bounce from it would signal renewed bullish interest, especially if backed by momentum on lower timeframes. If you like my analytics you may support me with your like/comment ❤️

MAGIC Breaking Out – Next 100% Move on the Horizon?🚀 MAGIC Breakout Alert – 100% Potential Incoming?! 👀🔥
Hey Traders! If you're all about high-conviction plays and real alpha, smash that 👍 and tap Follow for more setups that actually deliver! 💹💯
MAGIC has finally broken out from a long-standing symmetrical triangle on the 4H chart — a classic bullish reversal pattern. After consolidating tightly, it's now flashing signs of a strong upward impulse! ⚡
📌 Entry: CMP ($0.200) and add more on dips up to $0.195
🎯 Targets: $0.25 / $0.29 / $0.33 / $0.39
🛑 Stoploss: Close below $0.176
⚙️ Leverage: 5x (Max)
✨ Previous breakout delivered over 100% gains — this one could be next!
Chart structure + volume looks perfect. If BTC stays calm, we might witness another explosive move in MAGIC.
💬 What are your thoughts on this setup? Drop your opinions below and don't forget to like & follow for more high-conviction trade setups! 💥

Sail is sailing higher Here's a quick analysis of SAIL (Steel Authority of India Ltd.) stock:
Technical Overview
- Current Price: ₹122.61 INR
- Market Cap: ₹479.14 billion
- P/E Ratio: 22.56 (Moderate valuation)
- Dividend Yield: 1.72% (Stable returns)
- 52-Week Range: ₹99.15 - ₹175.35
Recent Trends
- The stock has been in a downtrend but is showing signs of reversal.
- Key Support Levels: ₹112.40 - ₹118.45.
- Breakout Potential: Analysts suggest a possible bullish trend with a 25% upside target.
Breakout Signals
- Double Rectangle & Falling Wedge Pattern: These formations indicate buyer dominance and a possible bullish trend.
- Key Resistance Level: ₹134 INR—recent trading action suggests a strong push above this level.
- Volume Surge: A 5% price increase with high trading volumes supports the breakout possibility.
Fundamental Insights
- Revenue & Profit: Recent results show degrowth in revenue and operating profit margins.
- Institutional Interest: FIIs (Foreign Institutional Investors) have been increasing their shareholding, which could indicate long-term confidence.
Investment Outlook
- Strengths: Strong institutional backing, potential trend reversal.
- Weaknesses: Near 52-week low, declining revenue.
- Opportunities: If the breakout holds, short-term gains could be significant.
- Threats: Market volatility, global steel demand fluctuations.🚀

KPIGREENKPIGREEN has posted solid numbers. Technically on trendline breakout. now if it crosses and closes above 448 then it may take a new ride from here. 30-35% from here is very much possible provided that 400 it hold 400 support! Volume also increased in last few sessions. But Close above 448 is very important.

Stellar (XLM) Falling Wedge + Inverse Head & ShouldersBINANCE:XLMUSDT has recently broken out of two major bullish patterns:
• Falling Wedge: The breakout above the descending resistance (orange) confirms the wedge setup, with a measured target around $0.70.
• Inverse Head & Shoulders: Breakout confirmed with a measured target around $0.40.
Key Levels to Watch
• $0.30 – 0.618 Fib level. IH&S neckline and current support. A break below it would invalidate the IH&S setup and potentially lead to a retest of the wedge's resistance as support.
• $0.36 – 0.5 Fib level and previous S/R.
• $0.40 – IH&S measured move target.
• $0.50 – 0.236 Fib level and previous resistance / swing high.
• $0.70 – Wedge measured move target.
Volume Analysis
Breakout volume is not as strong as expected, suggesting the need for further confirmation. A continuation with increasing volume would strengthen the bullish case.

SPY BULLISH BREAKOUT|LONG|
✅SPY is trading in an
Uptrend and the index
Made a bullish breakout
Of the key horizontal level
Of 580.00$ and the breakout
Is confirmed so we will be
Expecting a further move up
LONG🚀
✅Like and subscribe to never miss a new idea!✅
Disclosure: I am part of Trade Nation's Influencer program and receive a monthly fee for using their TradingView charts in my analysis.

BTC 15M APEX ENTRY Confirmed by 1H TrendThis 15-minute Apex Entry aligned with the 1H trend, avoiding fakeouts and confirming direction.
The Tenoris Apex Suite uses real-time support/resistance detection and multi-timeframe logic to identify breakout entries with zero lag.
I use this method to focus only on trades that align across key timeframes.
Not financial advice – just sharing how I trade.
For access, see profile bio.

Solana - This just faked out literally everybody!Solana - CRYPTO:SOLUSD - just faked out literally everybody:
(click chart above to see the in depth analysis👆🏻)
Over the course of the past 25 days, Solana dropped a significant -30% and wiped out a ton of bulls before creating a complete reversal. Especially with the current horizontal support level, bulls are taking over again, offering us another major crypto trading opportunity.
Levels to watch: $120, $250
Keep your long term vision!
Philip (BasicTrading)

ETH/USDT: BULL FLAG BREAKOUT!!🚀 Hey Traders! 👋
If you’re finding value in this analysis, smash that 👍 and hit Follow for high-accuracy trade setups that actually deliver! 💹🔥
🔥 #ETHUSDT UPDATE – Ready for the Next Leg?
ETH surged nearly 48% recently and is now consolidating inside a clean parallel channel. After a healthy sideways move, price is starting to push the upper resistance again — a breakout from here could trigger the next rally phase! 🚀
🔸 Pattern: Bullish Flag/Parallel Channel
🔸 Current Structure: Post-pump consolidation
🔸 Watch for: Break above the upper yellow line for confirmation
🔸 Targets: $2,750 – $2,880+
🔸 Invalidation: Break below channel support and $2,430
📈 If bulls hold this zone, we could witness another explosive move! Keep it on your radar.
💬 What do you think? Is ETH gearing up for a breakout? Drop your thoughts below!
📌 Follow for more high-probability setups!
