2nd Consecutive Cap after my call.
2nd Consecutive Cap after my call.
Now 162 - 163 is the Resistance.
Crossing it will lead it towards 170 & then 189-190
Breakout!

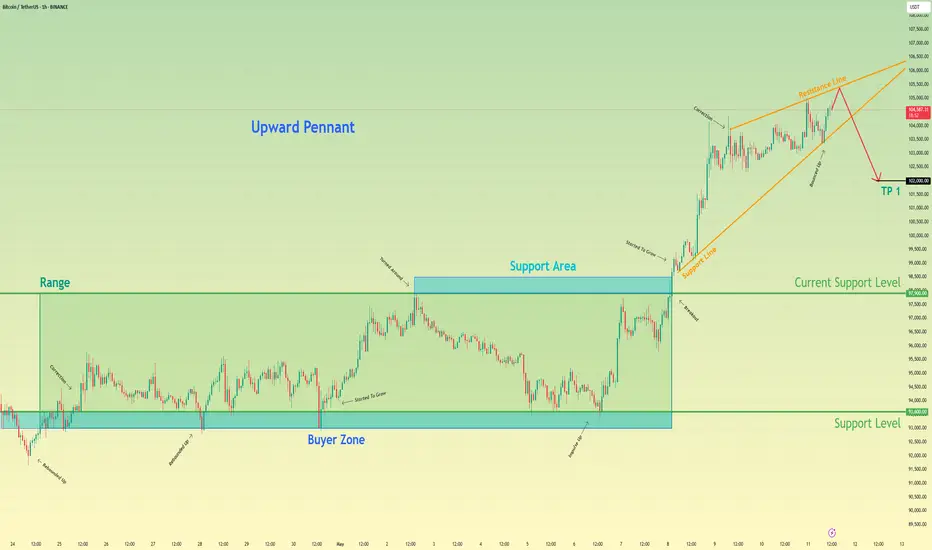
Bitcoin may drop to 102K points, exiting from pennantHello traders, I want share with you my opinion about Bitcoin. After breaking out of a multi-day range and launching a strong impulse from the buyer zone, the price has formed a clear upward pennant pattern. This technical formation often signals a potential slowdown in the bullish momentum, especially when it follows an aggressive move to the upside. The current price action shows that BTC has approached the resistance line of the pennant, but failed to generate further breakout strength. Each new impulse within the structure has weakened, and the market is starting to compress inside narrowing boundaries. The support area has been holding the structure temporarily, but the inability to push through the top of the pennant suggests growing exhaustion among buyers. This setup indicates that BTC may soon break downward from the pennant. So, I expect that it will make a correction that could drive the price down to the 102000 points, thereby exiting from pennant pattern. Please share this idea with your friends and click Boost 🚀
OptionsMastery: Sitting at resistance on BAC!🔉Sound on!🔉
📣Make sure to watch fullscreen!📣
Thank you as always for watching my videos. I hope that you learned something very educational! Please feel free to like, share, and comment on this post. Remember only risk what you are willing to lose. Trading is very risky but it can change your life!

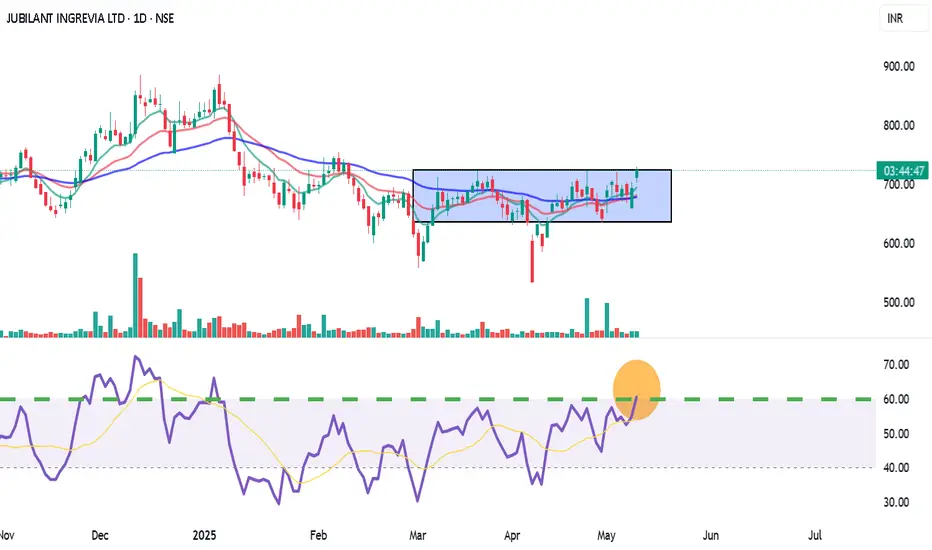
Jubilant Ingrevia (JUBLINGREA) – Short-Term Breakout Trade LTP: ₹726.30 | Recommended Entry: ₹722.00 – ₹723.00
Type: Short-Term Swing / Intraday MTF Trade
✅ Trade Setup:
Breakout above horizontal resistance near ₹725.75
9 EMA has crossed 26 EMA (bullish momentum)
RSI at 60.84 – strong trend, room for upside
BB %B: 0.96 – price pushing upper band = momentum buying
Good volume breakout on daily TF confirms buying interest
🟢 Buy Zone: ₹722 – ₹723
🔁 On retest or 15-min candle close above ₹725.75 with volume
🎯 Targets:
T1: ₹738
T2: ₹750 (supply zone / fib level)
T3: ₹765+ (if breakout sustains in 1H)
🛑 Stop Loss:
Conservative SL: ₹707 (below support + 9EMA)
Aggressive SL: ₹712 (tight SL for intraday)
For Education Purposes Only
CAD_JPY STRONG BULLISH BIAS|LONG|
✅CAD_JPY made a bullish
Rebound from the rising
Support and then broke the
Key horizontal level
Around 105.727 so we are
Bullish biased and after a
Local pullback we will be
Expecting a further
Bullish continuation
LONG🚀
✅Like and subscribe to never miss a new idea!✅
Disclosure: I am part of Trade Nation's Influencer program and receive a monthly fee for using their TradingView charts in my analysis.

GBP_USD STRONG BREAKOUT|SHORT|
✅GBP_USD was holding above
The key horizontal level around 1.3240
For quite some time but now we are
Seeing a strong bearish breakout
Which is confirmed and as the pair
Is making a pullback to retest
The new resistance we will be
Expecting a further bearish
Continuation after the retest
SHORT🔥
✅Like and subscribe to never miss a new idea!✅
Disclosure: I am part of Trade Nation's Influencer program and receive a monthly fee for using their TradingView charts in my analysis.

GBP-USD Bearish Breakout! Sell!
Hello,Traders!
GBP-USD made a bearish
Breakout of the key horizontal
Level around 1.3232 and the
Breakout is confirmed so we
Will be expecting a further
Bearish move down
Sell!
Comment and subscribe to help us grow!
Check out other forecasts below too!
Disclosure: I am part of Trade Nation's Influencer program and receive a monthly fee for using their TradingView charts in my analysis.

EPT/USDT Breakout Alert – Triangle Resolved, Targets Set!🚀 EPT Breakout Alert – 100% Potential Incoming?! 👀🔥
Hey Traders! If you're all about high-conviction plays and real alpha, smash that 👍 and tap Follow for more setups that actually deliver! 💹💯
EPT has just broken out from a symmetrical triangle on the 2H chart, indicating the start of a potential bullish wave. After weeks of consolidation, this breakout looks strong and is supported by increasing momentum.
📌 Entry: Current Market Price (CMP) – $0.0110
📉 Add More on Dip: Down to $0.0104
🎯 Targets:
TP1: $0.0138
TP2: $0.0165
TP3: $0.0194
TP4: $0.0223
🛑 Stop Loss: $0.0092
⚙️ Leverage (Optional): 3x–5x
A clean structure, breakout confirmation, and tight invalidation level make this setup attractive for short-to-mid-term swing traders.
💬 What do you think about this move? Are you in? Drop your thoughts below!

USOIL - Important Breakout !Hello Traders !
The USOIL failed to break the support level (56.047 - 55.102).
Currently, The lower high is broken (Change of Character).
So, I expect a bullish move🚀
________________
TARGET: 63.500🎯

GOLD - Price can break support level and continue to declineHi guys, this is my overview for XAUUSD, feel free to check it and write your feedback in comments👊
Recently price entered to triangle, where it at once bounced from support line, which coincided with support level.
Price rose to resistance line, breaking $3400 level, but soon turned around and dropped below, breaking this level again.
Next, Gold made a gap and continued to fall in a triangle, and later it reached $3215 level, after which bounced up.
Then price exited from triangle, rose to $3400 level and made fake breakout, after which started to decline in falling channel.
In channel, price fell to $3215 level, where at the moment continued to trades close and trying to break this level.
I think Gold can break this level and continue to fall in a falling channel to $3140
If this post is useful to you, you can support me with like/boost and advice in comments❤️

USDCHF - Important Breakout !Hello Traders !
The USDCHF formed a rectangle pattern.
The price broke the resistance level (0.83350 - 0.82931).
This key level becomes new support !
So, I expect a bullish move🚀
________________
TARGET: 0.85890🎯

COFORGE 8100 CE – 29 MAY EXPIntraday to Short-Term Trade Setup (15min/1H)
🟢 Bullish Breakout | Volume Surge Confirmed
🛒 Entry Zone (Buy Above): ₹258–260
🔑 Confirmation on 15min candle close above ₹260 with volume
🎯 Targets:
T1: ₹276
T2: ₹306.50
T3: ₹353.90 (if momentum continues into next session)
🛑 Stop Loss:
SL: ₹230 (on candle close basis for 15min TF)
Conservative SL: ₹240 (if tighter risk appetite)
📊 Indicators Signal:
✅ 9 EMA crossed 26 EMA (momentum confirmation)
✅ RSI at 76.79 – strong, but watch for pullback
✅ BB %B at 0.89 – breakout zone
✅ Clean breakout above resistance (~₹230) with volume spike
✅ Pivot & resistance flip visible on both 15min & 1H TF
For Education Purposes Only

AUDJPY - Bullish Double BottomHello Traders !
On Tuesday 6 May, The AUDJPY reached the support level (92.222 - 91.978).
The price formed a double bottom pattern.
At the moment, The Neckline is broken !
So, I expect a bullish move🚀
_______________
TARGET: 94.240🎯

Bitcoin Flips $94K Into Support — Bullish Momentum BuildsStructure Strengthens:
Bitcoin's technical structure has improved significantly, with price now holding firmly above the $94,000 level — a former resistance that has flipped into solid support after multiple successful retests.
Bullish Trend Confirmation:
This move reinforces the ongoing bullish trend, driven by a broad bottoming formation from February to April and a clear series of higher lows since March.
Investor Confidence:
The consistent accumulation signals strong buying interest from long-term investors, suggesting that market participants are positioning for further upside.
Outlook & Targets:
As long as Bitcoin maintains levels above $94,000, the bullish outlook remains intact. The next near-term targets lie in the $110,000–$115,000 range.
Bitcoin appears well-positioned for the next leg of its rally. 🚀📈
#Bitcoin #BTC #Crypto #TechnicalAnalysis #BullishTrend #Support #Breakout #MarketUpdate #PriceAction #CryptoMarket

OptionsMastery: A potential trend change on NVDA? 🔉Sound on!🔉
📣Make sure to watch fullscreen!📣
Thank you as always for watching my videos. I hope that you learned something very educational! Please feel free to like, share, and comment on this post. Remember only risk what you are willing to lose. Trading is very risky but it can change your life!

WCT Breakout Confirmed – Ready for Lift-Off?🚀 WCT Breakout Alert – 80% Potential Incoming?! 👀🔥
Hey Traders! If you're all about high-conviction plays and real alpha, smash that 👍 and tap Follow for more setups that actually deliver! 💹💯
WCT has finally broken out of its long-standing symmetrical triangle on the 4H timeframe 🔥. After weeks of consolidation, we’re seeing a fresh move building up, hinting at strong momentum ahead.
🔎 Chart Insights:
✅ Breakout above resistance zone ✔️
📈 Retest happening around the breakout zone ✔️
📊 Previous pump: 81% surge! Will history repeat?
Trade Idea:
Entry: Current Market Price (CMP) and add more in dip
Targets: $0.44/$0.48 / $0.56 / $0.68 🎯
Stop Loss: $0.35 🚨
Lev: Use low leverage (Max 5x)
The chart looks clean with solid structure—keep an eye as this can build up for a big move 💥.
💬 What’s your take? Drop your analysis or ride along with this setup!

Breakout in Dave Inc...Chart is self explanatory. Levels of breakout, possible up-moves (where stock may find resistances) and support (close below which, setup will be invalidated) are clearly defined.
Disclaimer: This is for demonstration and educational purpose only. This is not buying or selling recommendations. Please consult your financial advisor before taking any trade.

HelenP. I Euro may break resistance level and rise to trend lineHi folks today I'm prepared for you Euro analytics. If we look at the chart, we can see how the price a long period of slow decline, finally showing early signs of potential reversal. The price has been moving inside a falling wedge pattern, consistently testing lower highs and lower lows. But now, after touching the lower boundary of the structure and reacting near the 1.1200 zone, buyers have stepped in with notable strength. This level aligns not only with the wedge’s base but also with a previous support zone, which adds weight to the current move. The first reaction was sharp, the price rebounded confidently, and started forming higher local lows. That suggests the bearish momentum is weakening, while the structure itself points toward a possible breakout. If the Euro continues to build this upward momentum, it could break through the 1.1285 - 1.1300 resistance zone, which has already acted as a ceiling multiple times. That zone now becomes the key pivot for the next phase of the movement. Given the wedge structure, price behavior near support, and the current momentum, I expect EURUSD may reach the trend line, breaking the resistance level, and continue to grow to the trend line. That's why I set my goal at 1.1320 points, which coincides with the trend line. If you like my analytics you may support me with your like/comment ❤️

Breakout Confirmed: XRP on the Move Toward $4+🚀 XRP Breakout Alert – 70% Potential Incoming?! 👀🔥
Hey Traders! If you're all about high-conviction plays and real alpha, smash that 👍 and tap Follow for more setups that actually deliver! 💹💯
📈 XRP/USDT – Breakout Alert! 🚀
XRP is breaking out from a long-term falling wedge pattern on the 12H timeframe, signaling the potential for a strong bullish move ahead!
🔹 Entry: CMP $2.39 – Add more up to $2.32
🔹 Targets:
• TP1: $2.85
• TP2: $3.32
• TP3: $3.78
• TP4: $4.13
🔻 Stop-Loss: $2.09
⚙️ Leverage: Up to 5x (Trade responsibly)
This structure mirrors the previous 70%+ pump from the same wedge formation. History might just be ready to repeat. 👀
Let’s ride this breakout with tight risk management! 💥

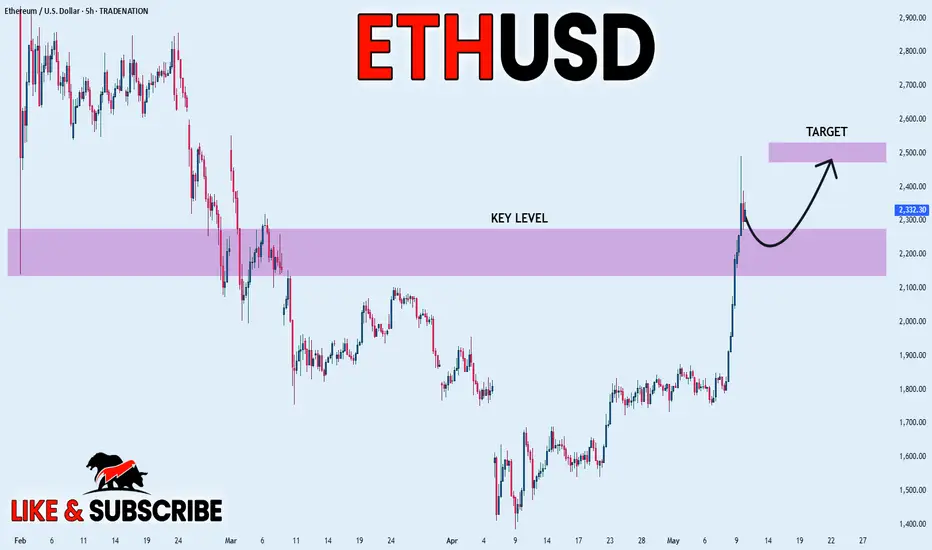
ETHEREUM BULLISH BREAKOUT|LONG|
✅ETHEREUM is growing finally
And the coin broke a key horizontal
Level of 2,200$ and the breakout
Is confirmed so we are bullish biased
And we will be expecting a
Further bullish move up
LONG🚀
✅Like and subscribe to never miss a new idea!✅
Disclosure: I am part of Trade Nation's Influencer program and receive a monthly fee for using their TradingView charts in my analysis.
Ethereum waking up?One of the most disappointing projects in the crypto space in recent years has to be ETH, losing ground on BTC since September '22. Finally ETH looks to have woken up outpacing BTC this week and broken out from the daily downtrend channel and currently at the underside of the DAILY 200 EMA.
BTC.D has printed a SFP and dropped 2% from 65.4% to 63%, could we be seeing a rollover and rotation into altcoins?
How I see it the moving average should cap off this move for now and a retrace towards the breakout area & previous lower high. That would then be the first higher high and higher low of this calendar year, a very bullish change in structure.
A more aggressive bullish scenario in the short term would be a reclaim of the 1D 200 EMA, leaving the inefficiency zone at the breakout level unfilled.
Either way the next HTF target is $2,800 for ETH which would bring price to the range midpoint and a key supply zone with many resting Stop losses.

Gold will continue to grow and exit from pennantHello traders, I want share with you my opinion about Gold. After looking at this chart, we can see how the price of Gold has been developing inside an upward pennant, formed after a powerful impulse from the buyer zone. This earlier move created a strong bullish foundation, supported by consistent reactions from the support area, which has since become a key defensive level. After the breakout from the upper boundary of the previous ascending channel, the price entered a phase of consolidation. However, rather than fading, the price action has remained tightly squeezed between the support line and the resistance trendline, creating the structure of a classic pennant. This pattern usually signals continuation, especially when supported by strong preceding momentum, which is exactly what we’re seeing here. Currently, the price is hovering around the support line of the pennant and has already shown signs of bouncing back up. If this rebound continues, the next logical move is a breakout through the resistance line of the pennant, with the 3450 level as a target. It aligns perfectly with the upper boundary and represents a strong technical TP1. Please share this idea with your friends and click Boost 🚀

PIXEL Breakout Alert: Ready for the Next Leg Up?🚀 PIXEL Breakout Alert – 100% Potential Incoming?! 👀🔥
Hey Traders! If you're all about high-conviction plays and real alpha, smash that 👍 and tap Follow for more setups that actually deliver! 💹💯
PIXEL has broken out from a bull flag on the 4H timeframe after consolidating for weeks. This clean breakout signals a potential trend reversal with strong upside momentum building. 💥
Trade Setup:
👉 Entry: $0.0380–$0.0400 (post-breakout zone)
🎯 Targets:
$0.0455
$0.0520
$0.0630
$0.0770
🛡 Stop-loss: $0.0360 (below channel re-entry)
Why I Like It:
Clear breakout of the falling channel
Strong volume surge confirms momentum
Previous 100% move shows solid potential
If BTC stays stable, this one looks set for a strong run! 🚀 Keep it on your radar.
