ETHEREUM BEARISH BREAKOUT|SHORT|
✅ETHEREUM keeps falling
Down and the price made a
Bearish breakout of the
Key horizontal level of 1600$
And the breakout is confirmed
So we are bearish biased
And we will be expecting a
Further bearish move down
SHORT🔥
✅Like and subscribe to never miss a new idea!✅
Disclosure: I am part of Trade Nation's Influencer program and receive a monthly fee for using their TradingView charts in my analysis.
Breakout!

NATGAS Bearish Breakout! Sell!
Hello,Traders!
NATGAS made a bearish
Breakout of the key horizontal
Resistance of 3.626$ and the
Breakout is confirmed so we
Are bearish biased and we will
Be expecting a further
Bearish move down
Sell!
Comment and subscribe to help us grow!
Check out other forecasts below too!
Disclosure: I am part of Trade Nation's Influencer program and receive a monthly fee for using their TradingView charts in my analysis.

Gold Rejects Channel Highs — Retracement to $3,000 Before HigherGold has printed another clean rejection at the upper boundary of a short-term ascending channel on the 6H timeframe. This latest rejection adds further validity to the structure, suggesting that we may now see a healthy technical pullback toward the equilibrium line of the channel — and potentially down to the lower support boundary near the $3,000 psychological level.
Technical Outlook:
Another rejection from channel resistance confirms structural validity.
1:4 risk-to-reward short opportunity with clear invalidation and confluence.
Targets:
– TP1: $3,005 — channel midline + psychological level
– TP2: $2,955 — previous swing high + dynamic quarterly support
$3,000 psychological levels are often retested before continuation.
Fundamentals & Geopolitical Context (as of April 1, 2025):
Gold's Macro Bull Trend Remains Intact
Despite this short-term setup, the broader macro backdrop continues to support gold:
– Central banks accumulating gold amid global de-dollarization
– Real yields remain negative across key regions
– Oil trading above $100 fuels inflationary pressure
Geopolitical Flashpoints Supporting Volatility
– Russia-Ukraine war shows no signs of easing
– Middle East tensions rising (Israel–Hezbollah conflict)
– Taiwan-U.S.-China escalation continues post-military exercises
Bitcoin Weakness = Gold Rotation Potential
– BTC struggling at $70K, showing early signs of distribution
– Miner pressure increasing ahead of halving
– Targeting possible correction to $50K = capital rotation into gold
Conclusion:
Technical rejection at resistance aligns with macro expectations of a short-term pullback.
$3,000 key psychological level likely to be retested before further upside.
Gold remains in a macro bull market; this move is likely corrective within a larger expansion leg.
Long Term Gold Bull Target $4,200:
Previous Long (Target hit and closed at $3,100):
Previous Intra Long (Target hit and closed at $3,100):

GBPNZD - TECHNICALS & FUNDAMENTALS📊 Technical Analysis – GBPNZD
🔻 Market Context:
Current Price: ~2.2838
The pair has been in a downtrend, forming lower highs and lower lows.
Price recently revisited a previous support zone, indicated by the horizontal line and purple box, showing potential for either a reversal or a continuation.
🔍 Key Zones:
Support Zone: Around 2.2830 – 2.2800
Price is testing this area and has shown a few wicks indicating buyers are present.
Demand Reaction Needed: A bullish candle formation is crucial at this level to signal potential upside.
🔼 Bullish Scenario (Reversal Play):
If a strong bullish candle forms around current levels, it could lead to a push higher toward 2.3000 and potentially 2.3100.
Watch for a break of short-term lower highs with volume confirmation.
🔽 Bearish Scenario (Breakdown Play):
Failure to hold above the current support level (2.2830–2.2800) may result in a deeper drop, targeting the 2.2700–2.2650 area.
The Bear Bias zone (marked on the chart) suggests sellers are active and may continue to push lower if structure breaks.
🧠 Fundamental Probabilities – April 8, 2025
🇬🇧 UK Outlook (GBP):
No major economic data is scheduled today for the UK, but markets remain cautious due to:
Ongoing uncertainty around the BoE’s interest rate stance.
Sticky inflation and mixed signals from recent PMI data.
Pound strength has been mostly reactive to broader risk sentiment and interest rate expectations.
🇳🇿 NZ Outlook (NZD):
Key driver today: NZ Business Confidence & Dairy Auction
If business sentiment remains weak and dairy prices disappoint, NZD could come under pressure.
RBNZ's dovish bias is also lingering in the background; the central bank is expected to maintain or potentially cut rates if economic softness continues.
✅ Summary:
Bias Condition Target
🔼 Bullish Bullish candle at support 2.3000 / 2.3100
🔽 Bearish Break below 2.2800 2.2700 / 2.2650

NATGAS BEARISH BREAKOUT|SHORT|
✅NATGAS formed a head
And shoulders pattern then
Made a bearish breakout of
The neckline which is now
A resistance of 3.850$
And the breakout is confirmed
So we are bearish biased and
We will be expecting a
Further bearish move down
SHORT🔥
✅Like and subscribe to never miss a new idea!✅
Disclosure: I am part of Trade Nation's Influencer program and receive a monthly fee for using their TradingView charts in my analysis.

HelenP. I Gold may continue to fall and break support levelHi folks today I'm prepared for you Gold analytics. After failing to hold above the resistance zone between 3140 and 3155 points, Gold made a sharp reversal. The strong bearish reaction from this area marked the end of the previous bullish momentum and triggered an aggressive sell-off. That move broke several minor support levels and pushed the price all the way down to the current support zone between 3010 and 2990 points. Previously, Gold had shown a stable uptrend, consistently bouncing from the trend line and using it as a dynamic support. Each pullback was met with buying pressure, allowing the price to climb higher. However, this time, after reaching the 3140 resistance level, buyers were overwhelmed by strong selling activity. Currently, Gold is trading just above the key support zone and close to the trend line. This area has acted as a pivot level multiple times, but the latest price action shows hesitation from buyers and growing control from sellers. Given the recent sharp decline, the break from the resistance zone, and the pressure near the current support, I expect Gold to continue falling toward 2960 points — my current goal. If you like my analytics you may support me with your like/comment ❤️

BTC/USD Forming Bullish Falling Wedge – Potential Target📐 2. Technical Pattern – Falling Wedge
A falling wedge forms when the price consolidates between two converging downward-sloping trendlines. It suggests diminishing selling pressure and a likely reversal.
Key Characteristics in This Chart:
Upper Resistance Trendline: Formed by connecting the series of lower highs.
Lower Support Trendline: Formed by connecting the lower lows.
The price respects both boundaries, confirming wedge structure.
Volume generally decreases during the wedge (implied but not shown).
✅ Bullish Implication: Once price breaks above the upper resistance, it often triggers a sharp upward move due to the squeeze of supply and the build-up of demand.
🧱 3. Support and Resistance Zones
🔻 Resistance Zone:
Area: ~100,000 to ~108,000 USD
Marked as a wide horizontal band (beige-shaded area).
Previous price peaks and consolidations suggest this zone is strong supply.
Breakout above this zone could trigger momentum towards the higher target.
🔹 Support Zone:
Area: ~72,000 to ~75,000 USD
Historical reaction level where buyers previously stepped in.
Coincides with the lower wedge boundary and recent bounce points.
Repeated tests strengthen this as a reliable accumulation zone.
🎯 4. Trade Setup Strategy
💼 Entry Strategy:
Trigger: A confirmed breakout above the wedge’s upper trendline (black diagonal line).
Confirmation: A strong bullish daily close above the trendline, ideally with volume spike.
The current price (~77,130) is near the lower boundary—offering a potential early entry or low-risk setup with a tight stop.
📌 Stop-Loss Placement:
Level: 70,916 USD
Below the wedge’s lower support and beneath the broader support zone.
Ensures exit if the pattern fails or bears regain control.
🧭 Target Projection:
Target Price: 114,562 USD
Based on the height of the wedge projected from the breakout point, a standard wedge breakout measurement.
Aligns with historical highs and psychological resistance.
🧮 Risk-Reward Ratio: Assuming entry around 77,130:
Risk (Stop-Loss): ~6,200 points
Reward (Target): ~37,432 points
R:R Ratio ≈ 1:6 – Highly favorable
⚙️ 5. Market Psychology & Price Action Insight
The falling wedge pattern suggests exhaustion of sellers.
Buyers are defending the support zone aggressively—creating higher lows within the wedge.
Each bounce is slightly more aggressive, indicating growing bullish sentiment.
A breakout from the wedge could act as a catalyst for rapid price acceleration as sidelined bulls enter and shorts cover.
📊 6. Summary of the Setup
Component Detail
Pattern Falling Wedge (Bullish)
Timeframe 1-Day Chart
Entry Point Breakout above upper trendline
Stop Loss 70,916 USD
Target 114,562 USD
Support Zone 72,000–75,000 USD
Resistance Zone 100,000–108,000 USD
Risk/Reward Approx. 1:6
Bias Bullish
📌 Final Thoughts
This setup provides a technically sound opportunity with clear invalidation (stop loss) and a well-defined profit target. The risk-to-reward ratio is attractive, and the price structure suggests a bullish reversal is likely, pending a confirmed breakout.

USDJPY Potential Pennant Triple ThreatFirst,
In the Higher Timeframes (4Hr - Weekly), we can see that USDJPY is traveling down a Descending Channel since Jan 10th. Price tried pushing higher in March but ultimately fell back within the Channel beginning of this month (April) resulting only in a False Breakout but also creating a Fair Value Gap from 148.698 - 147.429.
Now down on the Lower Timeframes (15min - 1Hr) we can see that Price has created a Fair Value Gap from 146.546 - 146.226 with current Price Action forming a Pennant Pattern just above this FVG which lines up with Previous Highs (Past Resistance Level) and with Volume Decreasing, suggests we could see a Breakout soon! Now Based on the Pennant Pattern being Neutral meaning can break either way, creates the first 2 Bullish Scenarios being either a Breakout and Retest of the Pennant pattern going Bullish OR Bearish.
*Breakout will be Validated if followed by an Increase in Volume!
Scenario 1 -If BULLISH BREAKOUT - The Retest will come at the Falling Resistance of the Pattern.
Scenario 2 -If BEARISH BREAKOUT - This could suggest Price is looking to "Fill The Gap" being the FVG
** If Scenario 2 happens, this Price Movement could be looking to fulfill a Fibonacci Retracement of the Swing Low @ 145.041 to the Swing High @ 146.904, where the 38.2% Level lays at the Upper Limit of the FVG and the 50% Level lays at the Lower Limit of the FVG with the Consequent Encroachment right in the middle @ 146.385.
—Both of this ideas suggest USD will need to gain strength which could mean fundamentally:
FOMC Meeting Minutes on Wednesday, April 9th & CPI (Consumer Price Index), the instrument used to measure Inflation, on Thursday, April 10th released results will be heavily relied on to see if there's anymore input on potential effects of Tariffs.
Scenario 3 - Fair Value Gap Inversion could suggest bad news fundamentally is released for USD and gives JPY Bears (Sellers) the ability to pull price down, keeping Price Consolidated further within the HTF Descending Channel.

EUR/GBP Analysis Double Bottom Breakout Toward TargetOverview of the Chart
This chart displays a EUR/GBP daily timeframe setup, highlighting a Double Bottom Pattern, a well-known bullish reversal formation. The pattern consists of two consecutive lows at a similar price level, followed by a breakout above a key resistance zone. This setup suggests a potential trend reversal from bearish to bullish.
Technical Analysis Breakdown
1. Double Bottom Formation (Reversal Signal)
Bottom 1: The first low was established after a prolonged downtrend, where the price found support and bounced higher.
Bottom 2: Price revisited the same support area but failed to break lower, indicating that sellers are losing strength and buyers are stepping in.
A double bottom pattern signals that the asset is forming a strong base and is likely to move higher after breaking the neckline (resistance level).
2. Support and Resistance Levels
Support Level (~0.8322):
This level acted as a demand zone, preventing further downside.
It marks the price area where buyers accumulated positions, leading to a reversal.
Resistance Level (~0.8500):
This level previously acted as a supply zone, where sellers controlled the price.
A breakout above this level is crucial to confirm the bullish trend continuation.
3. Breakout Confirmation & Retest Expectation
The price successfully broke above the resistance zone, confirming a bullish reversal.
A potential retest of the broken resistance (now turned support) could occur before further upside movement.
Traders often wait for this retest to confirm that the breakout is genuine before entering a position.
4. Price Target Projection
Based on the measured move strategy, the expected target is calculated by measuring the height of the double bottom pattern and projecting it above the breakout zone.
Target Price: 0.8742, aligning with historical resistance levels.
5. Stop Loss Placement
Stop loss at ~0.8322 (below the double bottom support).
This ensures risk is managed in case of an invalid breakout or a false move.
Trading Plan & Execution Strategy
📌 Entry Strategy:
✅ Breakout Entry: Buy after the breakout above resistance.
✅ Retest Entry: Wait for a pullback to the previous resistance (now support) before entering.
📌 Risk Management:
🔹 Stop Loss: Placed below the recent support at 0.8322 to limit downside risk.
🔹 Take Profit: First target at 0.8742 based on the double bottom structure.
📌 Market Outlook:
A successful breakout and bullish momentum could push prices toward the target.
If the price fails to hold above the breakout zone, a deeper retracement could occur before continuing higher.
Conclusion
The EUR/GBP pair has formed a bullish double bottom reversal pattern, signaling a potential uptrend continuation. The key levels to watch include 0.8500 (resistance turned support) and 0.8742 (target projection). Traders should monitor price action around the breakout zone for confirmation and consider risk management strategies before entering a position.

Clear DayTrading strategy video. The "Inside Bar"🔉Sound on!🔉
📣Make sure to watch fullscreen!📣
Thank you as always for watching my videos. I hope that you learned something very educational! Please feel free to like, share, and comment on this post. Remember only risk what you are willing to lose. Trading is very risky but it can change your life!

HelenP. I Euro will rise a little and then drop to support levelHi folks today I'm prepared for you Euro analytics. After breaking the structure of the previous downtrend, Euro showed a powerful bullish impulse, which allowed the price to exit the downward channel and move confidently higher. This breakout was supported by the trend line, which began to act as dynamic support throughout the rise. The bullish movement reached a local high near the 1.11 area before losing momentum. Soon after reaching that high, the price began to decline, pulling back to the area of the trend line and testing the support zone between 1.0950 and 1.0970. This zone aligns with Support 1 at the 1.0950 level and was already tested multiple times in recent price action. Although the trend line provided some temporary support, the strength of buyers has clearly faded. Currently, EUR/USD is trading just above the trend line, but price action suggests pressure is shifting back to the downside. Given the rejection from higher levels and the repeated tests of support, I expect the pair to decline further toward the 1.0950 target — my current goal. If you like my analytics you may support me with your like/comment ❤️

"Gold Approaching Key Support – Will Bulls Take Control?"🔹 Market Structure:
Gold is currently in a corrective phase after a strong bullish run, facing a pullback from recent highs around $3,160. The price has now approached a key horizontal support zone near $2,980 - $3,020.
🔹 Key Levels:
✅ Resistance: ~$3,160 (previous high)
✅ Horizontal Support: ~$2,980 - $3,020 (marked in blue)
✅ Target Level: ~$3,099 (potential bounce area)
🔹 Potential Scenarios:
1️⃣ Bullish Reversal: If the price finds support in the marked zone and forms bullish confirmation (e.g., hammer candle, bullish engulfing), we could see a retest of $3,099 and potentially higher levels.
2️⃣ Breakdown Scenario: If support fails, gold may see further downside towards $2,950 or lower.
🔹 Trading Plan:
📈 Buy Setup: Look for bullish confirmation near support (~$3,020) with a target of $3,099 - $3,120.
📉 Sell Setup: If support breaks, short positions could target $2,950 - $2,920.
🔸 Bias: Bullish above support, bearish below it.
🔸 Risk Management: Use a stop-loss below support (~$2,980) to manage risk.
Would you like me to refine this further or add any indicators like RSI, Moving Averages, etc.? 🚀

Solana - The Bullrun Is Not Over Yet!Solana ( CRYPTO:SOLUSD ) might create another move higher:
Click chart above to see the detailed analysis👆🏻
As we are speaking Solana is sitting at the exact same level as it was about 3.5 years ago in the end of 2021. In the meantime we saw a lot of volatility and Solana is now once again retesting a major previous support level. Despite the harsh recent drop, the bullrun remains valid to this day.
Levels to watch: $120, $250
Keep your long term vision,
Philip (BasicTrading)

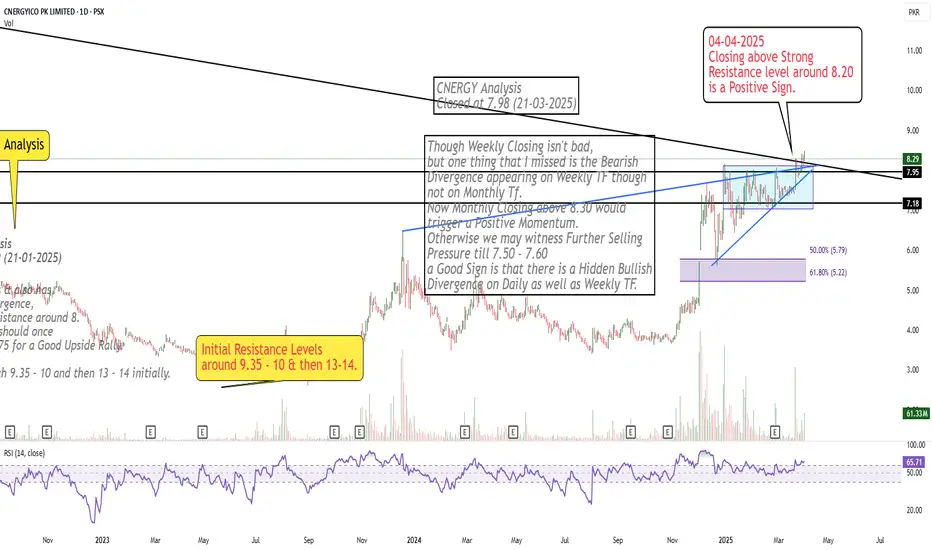
Crossed Important Resistance Area
Closing above Strong
Resistance level around 8.20
is a Positive Sign.
Euro will rise a little more and then make correction to 1.0950Hello traders, I want share with you my opinion about Euro. Earlier, the price started to grow from the lower region near 1.0730, where it bounced off the buyer zone between 1.0690–1.0730 points and entered a strong upward movement. This impulse helped Euro break through previous resistances and approach the upper boundary of the support area, which lies between 1.0950–1.0990 points. After reaching a local high, the price formed a pennant pattern, consolidating within narrowing trend lines while respecting both the support and resistance structure. During this phase, the pair remained stable, building pressure before making the next move. Recently, EUR made a strong breakout to the upside, exiting the pennant and continuing its bullish rally. The price surged rapidly and now trades above the current support level at 1.0950, reaching fresh highs in this local trend. I expect the price to reverse soon from the current overbought region and begin a decline toward the support area, which now acts as a potential pullback zone. My target for this corrective movement is the 1.0950 level, which aligns perfectly with the current support level and the upper boundary of the support zone. Please share this idea with your friends and click Boost 🚀

ATOM ANALYSIS📊 #ATOM Analysis
✅There is a formation of Falling Wedge Pattern on daily chart with a good breakout and currently retests from the major resistance zone and again trading around its major resistance zone 🧐
Pattern signals potential bullish movement incoming after a successful breakout of resistance zone
👀Current Price: $4.800
🚀 Target Price: $6.300
⚡️What to do ?
👀Keep an eye on #ATOM price action and volume. We can trade according to the chart and make some profits⚡️⚡️
#ATOM #Cryptocurrency #TechnicalAnalysis #DYOR

AUDUSD Bears "Flag Down" Potential OpportunitiesOn the Technical Analysis stand-point, FX:AUDUSD has been Consolidating in an Ascending Channel since the beginning of this year after having a sharp decline which started in October last year. Now the past 6 Months, Price Action seems to be forming a strong Continuation Pattern, the Bear Flag!
Based on the Retracement from the Swing High @ .6942 to the Swing Low @ .60872, Price has made a 38.2% Retracement to .64081, resulting in a False Break, pushing Price back into Pattern!
Price has been trading Under the 200 EMA since the start of the "Flagpole" and with the separation between it and the 34 EMA Band, feeds the Bearish Bias after we see Price heavily rejected after touching the 34 EMA Band!
*Once Price makes a Breakout of the Rising Support of the Channel -> Bear Flag Confirmed
*Increase in Volume after Break -> Breakout Validated
If we get a True Breakout that is Validated by the checklist of factors, we could be looking at great opportunities to take FX:AUDUSD down to the current 5 Year Low of .55063 set back in March 16th 2020 (Initial Outbreak of Covid) based on the Flagpole and Potential Extension of a Valid Break and Retest of the Bear Flag!
Now, Fundamentally what is driving the Weaker Aussie Dollar is the fear of the impact of what the US Tariffs will do to Australia's "Key Trading Partners" being China, Japan and South Korea all being high on the Reciprocal Tariff List. Because of this, the RBA has now priced in 100 Basis Points worth of Rate Cuts to come with the expectations of a "dampened broader outlook for global trade and economic growth."
www.tradingview.com
Stay Tuned!

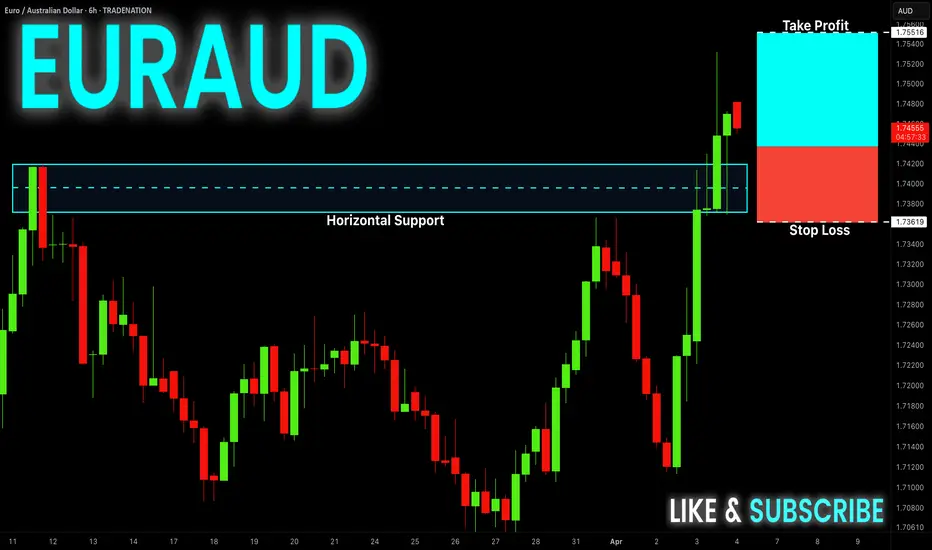
EUR-AUD Free Signal! Buy!
Hello,Traders!
EUR-AUD is trading in a
Strong uptrend and the
Pair made a bullish breakout
And a retest of the key
Horizontal level of 1.7420
And is going up now so
We can enter a long trade
On a local pullback with
The Take Profit of 1.7551
And the Stop Loss of 1.7362
Buy!
Comment and subscribe to help us grow!
Check out other forecasts below too!
Disclosure: I am part of Trade Nation's Influencer program and receive a monthly fee for using their TradingView charts in my analysis.
BULLISH RSI DIVERGENCE ON REZOLVE AI (RZLV) 1D CHARTA bullish RSI divergence appeared to gather more strength on the 1 hour chart today. This could possibly signal a bullish up trend. The London based company provides AI solutions for commerce. Rezolve recently closed an acquisition of GroupBy, an ECommerce company, and has recently been featured favorably in articles by Nasdaq and others.

AUD-JPY Will Keep Falling! Sell!
Hello,Traders!
AUD-JPY made a bearish
Breakout then made a retest
And is going down again
So we are bearish biased
And we will be expecting
A further bearish continuation
Sell!
Comment and subscribe to help us grow!
Check out other forecasts below too!
Disclosure: I am part of Trade Nation's Influencer program and receive a monthly fee for using their TradingView charts in my analysis.

EUR/USD Analysis Ascending Triangle Breakout – Bullish TargetOverview of the Chart:
The chart represents the EUR/USD (Euro to U.S. Dollar) pair on a 1-hour timeframe, showcasing a bullish ascending triangle breakout. The pattern indicates an upward continuation in the trend after a period of consolidation. This analysis will break down the key elements of the chart, the technical structure, and the potential trading strategy.
1. Market Structure & Key Zones
A. Market Curve Area (Early Trend Development)
The price started with a strong bullish trend leading up to the formation of the triangle.
The curved trendline suggests a gradual increase in buying pressure, indicating that the market was preparing for a larger breakout.
B. Resistance and Support Levels
Resistance Level (Red Arrow & Blue Box):
This level acted as a price ceiling where sellers previously dominated.
The market attempted multiple times to break this resistance before successfully breaching it.
Support Level (Green Arrow & Yellow Zone):
The price consistently found buyers at this level, reinforcing a higher low structure.
The rising support line within the triangle indicated strong accumulation by buyers.
2. Chart Pattern: Ascending Triangle Formation
The price action formed an ascending triangle, which is a well-known bullish continuation pattern.
The higher lows (trendline support) indicated buyers were gaining control, gradually pushing the price toward the resistance.
Eventually, the resistance was broken with strong bullish momentum, confirming a valid breakout.
3. Breakout Confirmation & Retest
The breakout above the resistance level came with high volume, indicating strong market participation.
After the breakout, a minor pullback (retest) occurred, confirming previous resistance as new support.
The price surged upward after the retest, validating the bullish trade setup.
4. Trade Setup & Risk Management
A. Entry Strategy
A trader would enter a buy (long) position after confirming the breakout.
Entry Trigger:
Either at breakout (high-risk, early entry)
Or after a successful retest (safer entry)
B. Stop Loss Placement
A stop loss is placed below the previous support level at 1.07276, ensuring risk is limited in case of a false breakout.
C. Target Projection
The target price is measured using the height of the triangle added to the breakout level.
Based on this calculation, the projected target is around 1.12838.
5. Conclusion & Trading Plan
The EUR/USD pair has executed a clean ascending triangle breakout, signaling further bullish movement.
The trading plan suggests:
✅ Entry: Buy after breakout confirmation or retest.
✅ Stop Loss: Placed below 1.07276 for risk management.
✅ Take Profit: Targeting 1.12838, based on the pattern’s height projection.
This setup presents a high-probability long opportunity in a trending market, with proper risk management to protect against potential reversals.

CFX ANALYSIS📊 #CFX Analysis
✅There is a formation of Falling Wedge Pattern on daily chart with a good breakout and currently retests from the major resistance zone🧐
Pattern signals potential bullish movement incoming after a successful retest
👀Current Price: $0.0775
🚀 Target Price: $0.1210
⚡️What to do ?
👀Keep an eye on #CFX price action and volume. We can trade according to the chart and make some profits⚡️⚡️
#CFX #Cryptocurrency #TechnicalAnalysis #DYOR

Potential rise in the price of the euro/dollarHello traders
The upward momentum is strong and there is a correction. I expect the price to continue its trend and break the top.
