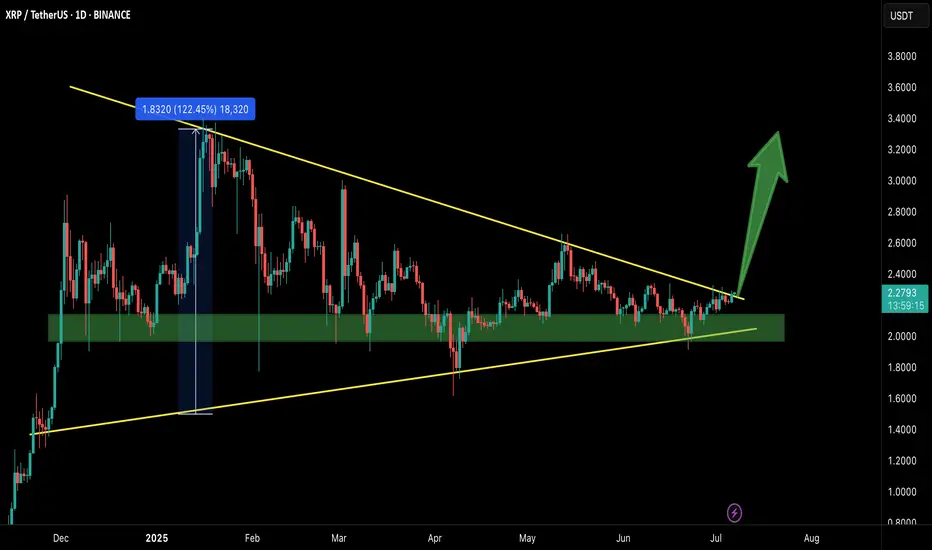
XRP/USDT – Breakout Confirmed!Hey Traders — if you're into high-conviction setups with real momentum, this one’s for you.
XRP has finally broken out from the massive symmetrical triangle on the 1D timeframe after holding the green support zone like a champ.
This structure has been compressing for months, and with this breakout, momentum could be shifting in favor of the bulls.
Entry: Current Market Price (CMP)
Add More: On dips above $2.20
Targets: $2.60 / $2.95 / $3.40 / $3.80
Stop Loss: $2.05
Leverage: 5x–10x
As long as price stays above the breakout zone, this setup holds strong potential. Keep a close eye for volume confirmation and follow-through.
Let’s see how this plays out. Will update as it unfolds.
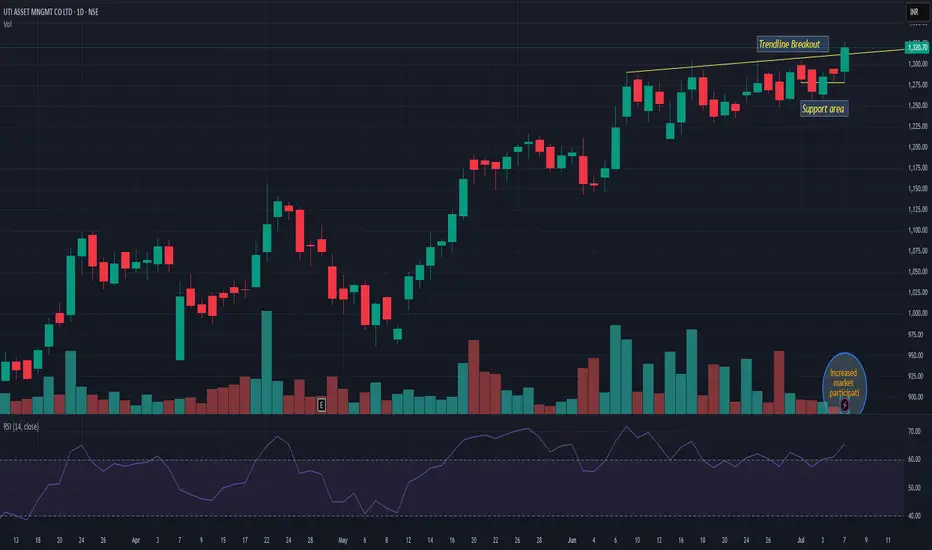
Breakout!
UTIAMCUTIAMC giving trend-line breakout with increased volume. It is trending just 5=7% away from ATH. 1250 seems strong support and on upper side it may trade above 12-15%. Keep it on radar
Bitcoin (BTCUSD) - Daily Price Uptrend, Resistance Breakout TestBitcoin (BTCUSD) has been in a recent Daily price Uptrend, rallying up from the $100,000 price support level.
A SMA Golden Cross printed on May 21st, 2025.
Bitcoin price is attempting a resistance zone test and has yet to breakout and hold above the $111,000 to $112,000 price zone.
Resistance levels: $110,000 , $112,000 , $117,000 , $121,000.
Support levels: $108,000 , $107,000 , $105,000 , $104,000 , $100,000.
Recent crypto industry, government legislation news, and institutional crypto purchases have helped to keep Bitcoin price above $100,000 support.
Stock market correlation volatility could also affect the crypto market and prices for the next 30 to 45 days.

Gold Gains Strength as the Dollar Wobbles – What’s Next?Hello, my dear friends – let’s take a fresh look at gold after yesterday’s moves!
At the moment, gold is trading steadily around 3,345 USD as the market awaits tonight’s highly anticipated U.S. Nonfarm Payrolls report. Yesterday’s ADP data caused a mild shake in sentiment, showing the first drop in private sector employment in over two years. This immediately fueled expectations that the Federal Reserve could move to cut interest rates sooner than expected — putting pressure on the U.S. dollar and offering support to gold as a non-yielding safe haven.
Meanwhile, the DXY (U.S. Dollar Index) has slipped to its lowest level in nearly three years, making dollar-denominated assets like gold more attractive to international investors. On top of that, lingering geopolitical tensions and ongoing strong central bank buying continue to reinforce gold’s role as a long-term store of value.
From a technical perspective on the H4 timeframe, gold is showing a very tight structure after breaking out of a prolonged downtrend channel. Price is currently consolidating between 3,330 and 3,360 USD, with a clearly defined bullish formation: higher highs and higher lows — a strong signal that the uptrend is starting to take shape again.
The key level to watch now is 3,358 USD. If price breaks above this level with convincing buying momentum, I expect gold to enter a new bullish leg toward 3,390 – 3,407 USD, aligning with the Fibonacci 1.618 extension — often a magnet for price during strong trends. On the other hand, if there’s a short-term pullback, the support zone around 3,327 – 3,318 USD will be critical, offering a potential re-entry point for buyers looking to ride the next wave up.
This is not a phase for impulsive decisions — but it’s definitely not a moment to be passive either. The breakout could come fast, and only prepared traders will be ready to act.

Apple Is Climbing the Fibonacci Channel Ladder – Step 5 Ahead?On the monthly chart, Apple (AAPL) is steadily moving within a well-defined ascending Fibonacci channel, like climbing a ladder — step by step.
The price is currently testing Step 4 , a zone that has acted as a strong resistance barrier.
Despite the pressure here, the structure still appears bullish, and even a minor pullback might simply be a pause before the next move.
If momentum picks up, we could soon see a breakout toward the next step — targeting 234 at Step 5.
The trend remains technically intact unless the channel is broken, and the overall formation still leans toward continuation.

AMAZON Will Keep Growing! Buy!
Hello,Traders!
AMAZON is trading in an
Uptrend and the stock made
A breakout and retest of the
Key horizontal support
Of 218$ and is going up again
So we are bullish biased
And we will be expecting
A further bullish move up
Buy!
Comment and subscribe to help us grow!
Check out other forecasts below too!
Disclosure: I am part of Trade Nation's Influencer program and receive a monthly fee for using their TradingView charts in my analysis.

EUR/USD breakout awaiting EUR/USD has not provided a clear structure over the past week or two. The pair appears to be in consolidation, building liquidity on both sides of the current range. At the moment, I’m waiting for a decisive breakout, ideally followed by distribution within the monthly supply zone, although that zone is still some distance away.
This week, my focus will be on whether a new supply zone forms, closer to current price. If price sweeps the nearby equal highs and then shows signs of reversal, this could give us a fresh supply area to work from. Alternatively, if price moves lower, I’ll be looking at the 8-hour demand zone around 1.16000 for a possible long setup.
Confluences for EUR/USD:
- Although price has been slightly bullish, the current consolidation phase suggests a potential reversal could be on the horizon.
- Liquidity is building on both sides of the range, making a reaction from the monthly supply zone increasingly probable.
- There’s significant downside liquidity still untapped, such as Asia session lows, which could serve as short-term targets.
- For clearer confirmation, we still need a decisive break in market structure to the downside.
P.S. If price sweeps the lower liquidity and moves into the 8-hour demand zone near 1.16000, I will be watching for accumulation to form and signs of bullish intent from there.

Riding the Wave: Breakout Trading with Elliott Wave AnalysisHello Friends,
Welcome to RK_Chaarts,
Today we're going Analyze the chart of " HASBRO. " to identify a trend change opportunity.(Educational Post).
Let's get started!
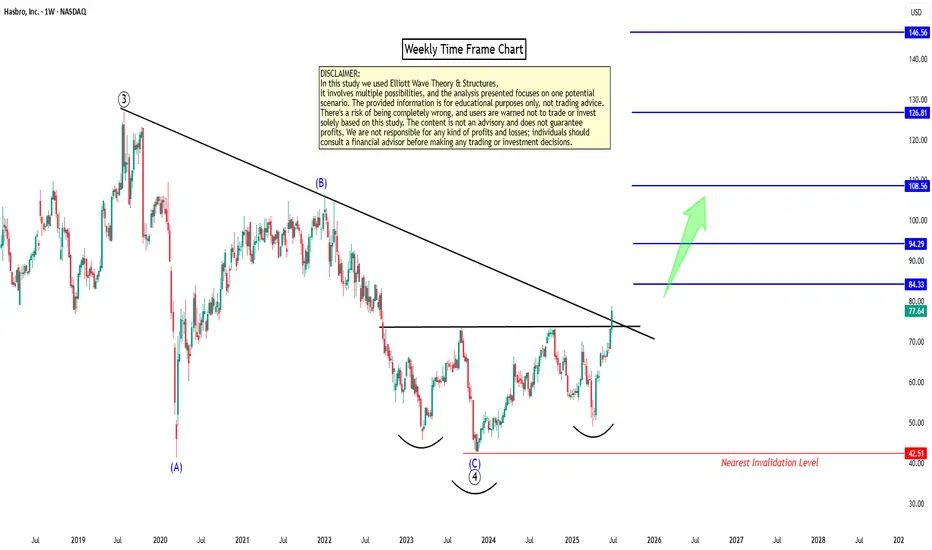
Today, we analyzed the weekly chart of "HASBRO" using Elliott Waves theory and chart patterns. We clearly observed that the July 2019 top, with a high of 126.87, completed a primary degree Wave ((3)) in Black. The recent bottom in November 2023, around 42.69, marked the end of primary degree Wave ((4)) in Black. Since then, the price has formed a higher high and low, indicating a potential reversal.
The recent weekly candle close has broken out of the Resistance trendline and also confirmed an inverted head and shoulders breakout along with good breakout in RSI on weekly-cum-monthly time frames. This suggests that we may be unfolding a primary degree Wave ((5)) in Black, which should consist of five sub-divisions of Intermidiete degree in Blue. Based on the chart, it appears that Intermidiete degree Waves (1) and (2) in Blue are complete, and Wave (3) may have started.
Resistance Trendline Breakout with Inverted Head n Shoulder Breakout
RSI Breakout on Weekly
RSI Breakout on Monthly
Major EMAs Support on Daily, Weekly & Monthly
Both Elliott Wave theory, EMAs support, Trendline Breakout and chart pattern Breakout indicates that the price is likely to move higher from here. However, please note that technical analysis is a game of probabilities, and there's always a chance of being wrong.
To mitigate this risk, we've marked an invalidation level around 42.69. If this level is breached, our analysis would be invalidated.
Projecting the target for Wave ((5)) using the 123.6% of Wave ((4)) measurement, we get a long-term target of around 146.56. This is a possible target, but please keep in mind that this is an educational study and not a trading tip or advice.
Before making any trading decisions, please conduct your own analysis or consult with a technical expert or financial consultant.
I am not Sebi registered analyst.
My studies are for educational purpose only.
Please Consult your financial advisor before trading or investing.
I am not responsible for any kinds of your profits and your losses.
Most investors treat trading as a hobby because they have a full-time job doing something else.
However, If you treat trading like a business, it will pay you like a business.
If you treat like a hobby, hobbies don't pay, they cost you...!
Hope this post is helpful to community
Thanks
RK💕
Disclaimer and Risk Warning.
The analysis and discussion provided on in.tradingview.com is intended for educational purposes only and should not be relied upon for trading decisions. RK_Chaarts is not an investment adviser and the information provided here should not be taken as professional investment advice. Before buying or selling any investments, securities, or precious metals, it is recommended that you conduct your own due diligence. RK_Chaarts does not share in your profits and will not take responsibility for any losses you may incur. So Please Consult your financial advisor before trading or investing.
Strong multimonth breakout BPCLThe oil major company witnessed a consolidation breakout and closed at multimonth highs on weekly scale ..
volumes are healthy
rsi very strong
stock above key ema areas .

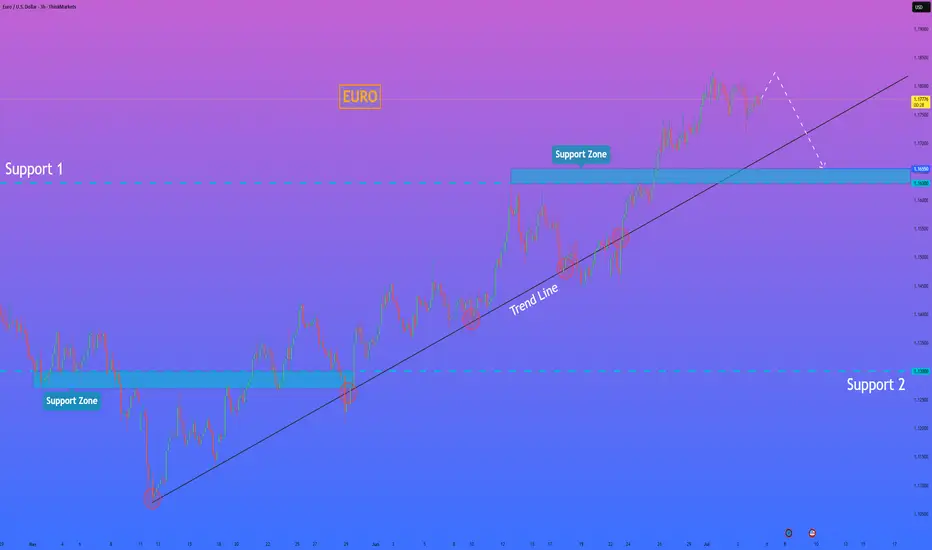
HelenP. I Euro may soon reverse and test support near $1.1655Hi folks today I'm prepared for you Euro analytics. If we look at the chart, EURUSD has been climbing steadily within an uptrend, bouncing multiple times from the trend line and making higher highs. However, despite the recent bullish structure, the pair is now showing signs of slowing momentum. The price is approaching a possible turning point near the top, and the latest candles show hesitation. Now the pair is trading near 1.1790 and still staying above the trend line, but I believe it may rise a bit more and then break down below the trend line. Once this structure is broken, I expect sellers to take control and push EURUSD toward the nearest support zone between 1.1655 and 1.1630 points. This zone acted as a key level in the past and may serve as the next area of interest for buyers. Given the extended movement and potential loss of bullish pressure, I remain bearish and expect EURUSD to move down to retest support. The level of 1.1655 is my current goal. If you like my analytics you may support me with your like/comment ❤️
Disclaimer: As part of ThinkMarkets’ Influencer Program, I am sponsored to share and publish their charts in my analysis.
Breakout on Vodafone?Looks like a Head and shoulders reversal, plus breakout this week. Too early to say though as it still needs confirmation. Could still be a fake-out?
This is not a solicitation to trade in Vodafone shares.

EUR/JPY: Bullish Setup on 170.00 Breakout & Dovish BoJWe've identified a compelling, high-conviction long trade setup on EUR/JPY, perfect for a limit order right now. This trade leverages a powerful combination of fundamental divergence and a confirmed technical breakout, setting the stage for quick execution and potential profit! 🎯💰
Fundamental Rationale: 🌍📊
Japanese Yen (JPY) Weakness: The JPY is under significant bearish pressure. 📉 The Bank of Japan's (BoJ) persistently dovish monetary policy, keeping interest rates at historic lows, creates a wide interest rate differential. This fuels "carry trades," where investors borrow low-yielding JPY to invest in higher-yielding currencies like the Euro, increasing JPY supply. Recent weak economic data, including a decline in Tokyo CPI, reinforces expectations that the BoJ will not hike rates in 2025. Additionally, a global "risk-on" sentiment diminishes the JPY's safe-haven appeal, leading to capital outflow and sustained Yen depreciation. 🐻📉
Euro (EUR) Stability: While the Euro isn't showing explosive bullish momentum, its relative stability provides a crucial counter-balance to the weakening Yen. 🇪🇺 The European Central Bank (ECB) is inclined to maintain its current policy, and recent Eurozone inflation data hasn't significantly altered expectations for further rate cuts in H2 2025. This steady footing, paired with the pronounced JPY weakness, creates a compelling bullish case for EUR/JPY. The Euro's role is to be a stable anchor against a fundamentally weak JPY, allowing the cross to climb. ⚖️
Technical Setup: 📊✨
Decisive Breakout Confirmed: EUR/JPY has achieved a powerful and decisive breakout above the critical psychological resistance of 170.00 and its previous yearly high of 169.75. This is a monumental technical event! Such a sustained move above key long-term barriers signals strong underlying buying pressure and confirms a "new trigger for the bulls," indicating a high probability of continued uptrend. 🚀⬆️
High-Probability Entry Strategy: Our entry strategy is designed for a quick and successful fill. Following the confirmed breakout, we anticipate a classic "breakout and retest" phenomenon, where price pulls back to retest the former resistance (now new support). By placing a limit order slightly below the current market price, at 170.10, we aim to catch this anticipated pullback, securing an optimal entry with a tighter risk profile. 🔄🎯
Clear Resistance Target: Our single Take Profit target is strategically set at 170.90, just below the next significant resistance: the 78.6% Fibonacci retracement level at 170.93. This level, derived from a previous long-term decline, represents a key area where price might encounter resistance. Targeting slightly below it increases the probability of the TP being hit before any potential reversal. 🎯✅
Trade Parameters: 📋✨
Currency Pair: EUR/JPY 💶🇯🇵
Direction: Long (Buy) ⬆️
Entry (Limit Order): 170.10
Take Profit (TP): 170.90
Stop Loss (SL): 169.60
Risk-Reward Ratio: 1.6:1 (A favorable ratio for a high-probability setup!) ✅

SEI Long – Breakout with Relative Strength & Trend ContinuationSEI is showing strong relative strength and has just broken out of recent structure. We’re watching for a higher low to form above the $0.22 zone, confirming trend continuation and unlocking upside liquidity.
📌 Trade Setup:
• Entry Zone: Around $0.22
• Take Profit Targets:
o 🥇 $0.29
o 🥈 $0.39
o 🥉 $0.49
• Stop Loss: Daily close below $0.19

EIHotel,1W , Bullish it has formed a flag Pattern and ready to breakout of pattern , wait until weekly strong close and take the trade with proper risk management and proper position sizing .
Follow for more Swing Ideas Like this

AjantaPharma ,1W , Bullish it has Formed a Very Good Pattern in Weekly and giving Breakout ,Take the Trade after Strong Weekly Close and put the Sl below its Swing low and Follow Proper Risk Management
Follow for More Swing Ideas like this

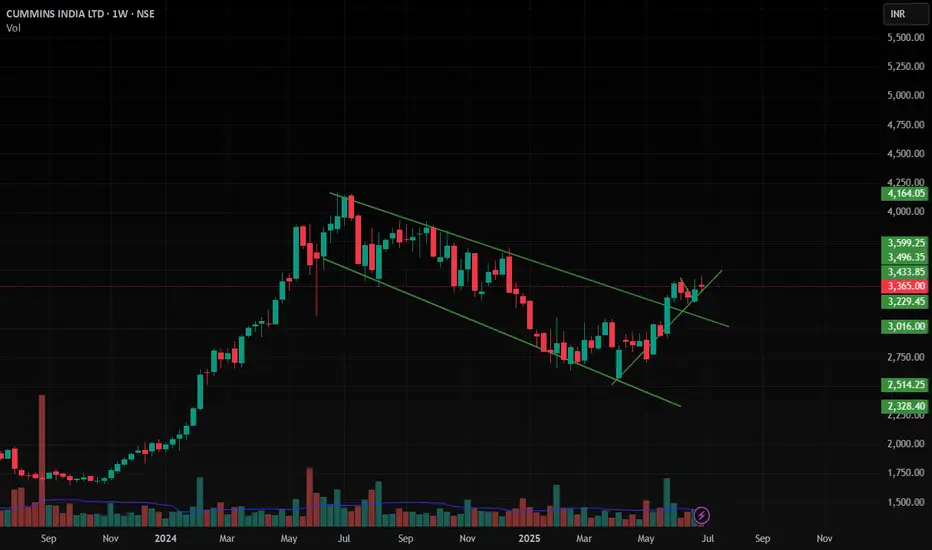
Cumminsind , 1W, Bullishit has Formed a very Good Pattern and Given a Breakout with Good Volume and now it is Trending to Up side ,
Follow proper position sizing and Risk Management
Follow for More Swing Ideas Like this
Ultracemco , 1W , Bullish As Ultracemco is Formed pattern and giving Breakout Now , Watch Carefully after Weekly Confirmation and Take Trade and follow proper Position Sizing and Risk according to your account size
follow for More Swing Ideas like this

EUR-JPY Will Keep Growing! Buy!
Hello,Traders!
EUR-JPY is trading in an
Uptrend and the pair broke
The key horizontal level
Of 169.814 and the breakout
Is confirmed so after a potential
Retest of the support cluster
Of the rising and horizontal
Support lines below we will
Be expecting a bullish continuation
Buy!
Comment and subscribe to help us grow!
Check out other forecasts below too!
Disclosure: I am part of Trade Nation's Influencer program and receive a monthly fee for using their TradingView charts in my analysis.

EUR/USD: A Perfect Storm for BullsThis is a high-conviction long setup based on a powerful combination of macroeconomic divergence and a confirmed multi-year technical breakout.
The Non-Farm Payrolls report has now been released, and the resulting price dip has created what I believe is an ideal entry opportunity to align with the dominant bullish trend.
The Fundamental Why 📰
NFP Aftermath: Yesterday's NFP report was a mixed bag that ultimately reinforces the case for Fed rate cuts. The headline number beat expectations, causing an initial USD rally and a dip in EUR/USD. However, the underlying details like wage growth were soft. Crucially, the market continues to price in a 96% probability of a Fed rate cut by September, a figure that was unchanged by the data. The core driver of USD weakness—a dovish Fed—remains firmly intact.
Resilient EUR 🇪🇺: In contrast, the ECB has signaled it is at or near the end of its easing cycle. Economic data from core Eurozone countries is stabilizing, providing the Euro with relative strength.
Risk-On Sentiment 💹: The broader market remains in a "risk-on" mood, which is typically negative for the safe-haven USD. Gold is soaring and equities are near all-time highs, confirming the anti-dollar flow.
The Technical Picture 📊
The Secular Breakout 🚀: The most significant event is the breakout of a decade-long downtrend resistance line. This is a major structural shift. The pair has also achieved a monthly and quarterly close above the critical 1.1500 handle, turning a historic resistance level into a new support floor.
The Impulsive Uptrend 🌊: On the 4-hour chart, the price is in a clear ascending channel. The post-NFP dip represents a healthy correction within this uptrend, bringing price back toward key support.
Key Levels 🔑:
Support Zone: The dip has brought price directly into the key support confluence between 1.1700 and 1.1760, making this an ideal area to enter long.
Resistance Zone: Major resistance still sits at 1.1900, making it a prudent take-profit target.
Strategy & Risk Management 🧠
The stronger-than-expected NFP headline has provided the exact pullback this strategy was designed for. The dip presents a prime opportunity to buy into the dominant uptrend at a more favorable price. Instead of chasing the market, we are now positioned to enter on a technically sound correction.
Good luck, and trade safe!
Trade Parameters ✅
Pair: EUR/USD
Direction: Long / Buy 🟢
Entry Type: Limit Order
Entry Price: 1.1745
Stop-Loss: 1.1685 (60 pips) 🔴
Take-Profit: 1.1895 (150 pips) 🎯
Risk/Reward Ratio: 2.5 : 1

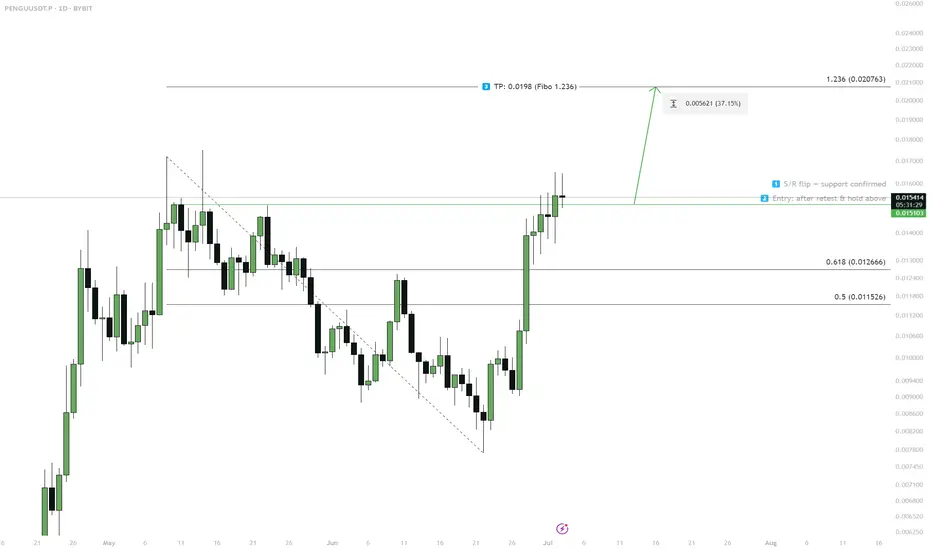
PENGU — S/R Flip & Breakout Scenario1. S/R flip at 0.0151 — wait for retest
2. Enter on successful hold above 0.0151
3. Target: 0.0198 (Fibo 1.236)
4. If fails to hold above 0.0151 — scenario invalid
GBP_CAD BEARISH BREAKOUT|SHORT|
✅GBP_CAD broke the key structure level of 1.8580
While trading in an local downtrend
Which makes me bearish
And as the retest of the level is complete
Bearish continuation will follow
SHORT🔥
✅Like and subscribe to never miss a new idea!✅
Disclosure: I am part of Trade Nation's Influencer program and receive a monthly fee for using their TradingView charts in my analysis.

EUR-AUD Bearish Breakout! Sell!
Hello,Traders!
EUR-AUD was trading along
The rising support line but
Now we are seeing a bearish
Breakout so we are bearish
Biased and we will be expecting
A further bearish move down
Sell!
Comment and subscribe to help us grow!
Check out other forecasts below too!
Disclosure: I am part of Trade Nation's Influencer program and receive a monthly fee for using their TradingView charts in my analysis.

RSKD - breakout confirmed, now waiting for retestRiskified (RSKD) shows a textbook breakout setup: daily triangle plus 4H bullish flag. Price already broke out and is now retesting the 0.618 Fibonacci retracement at $5.21, which also matches the flag resistance flip and EMA cluster. This is a clean buy zone with strong technical alignment.
Volume spiked during the breakout, trend structure remains intact, and moving averages are converging — usually a precursor to strong moves. The current pullback is orderly, and if buyers show strength on this retest, the price could target $6.00, then $6.54, and potentially $7.25 (1.618 extension).
Fundamentally, Riskified offers fraud prevention tech for e-commerce. The business is benefiting from global growth in online transactions and improved margin control. While still unprofitable, recent quarters showed progress toward positive operating leverage and strong client acquisition.
Tactical plan:
— Entry on confirmation from $5.21 retest
— TP1: $6.00
— TP2: $6.54
— TP3: $7.25
— SL: below $4.90 or $4.43 support zone
You’ve been watching this one. The triangle broke. The pullback is clean. Maybe it’s time to stop watching and start participating.
