EURUSD - 2 ScenariosHello Traders !
On Tuesday 11 March, Th EURUSD reached the resistance level (1.09374 - 1.09058).
So, We have 2 Scenarios:
BULLISH SCENARIO:
If the market breaks above the resistance level and closes above that,
We will see a bullish move📈
TARGET: 1.11580🎯
BEARISH SCENARIO:
If the price breaks and closes below the neckline,
We will see a huge bearish move📉
TARGET: 1.06350🎯
Breakout!

IP/USDT: BREAKOUT ALERT!!🚀 Hey Traders! IP Breakout Alert – 80% Move on the Horizon? 👀🔥
If you’re pumped for this setup, smash that 👍 and hit Follow for premium trade ideas that actually deliver! 💹🔥
🔥 IP/USDT – Massive Breakout in Play! 🚀
IP is breaking out from a triangle on the 4H timeframe and looks primed for a 70-80% upside move. This setup has huge potential, making it a must-watch trade. 💥
💰 Trade Setup:
📍 Entry: $6.10 – $6.35
🎯 Targets: $6.96 / $7.84 / $8.92 / $11.2 📈
🛑 Stop-Loss: $5.78
⚡ Leverage: Use low lev (Max 5x)
🔎 Strategy:
✅ Enter with low leverage now
✅ Add more on dips and ride the breakout momentum 🚀
💬 What’s Your Take?
Are you bullish on IP’s breakout potential? Share your targets, analysis, and predictions in the comments! Let’s crush it and lock in those gains! 💰🔥🚀

CAD_JPY POTENTIAL LONG|
✅CAD_JPY made a bullish
Breakout of the key horizontal
Level of 104.800 and the breakout
Is confirmed which reinforces our
Bullish bias and makes us expect
A further move up after the
Retest of the new support
LONG🚀
✅Like and subscribe to never miss a new idea!✅
Disclosure: I am part of Trade Nation's Influencer program and receive a monthly fee for using their TradingView charts in my analysis.

CRUDE OIL Will Go Up After Pullback! Buy!
Hello,Traders!
CRUDE OIL is trading in a
Local uptrend and the price
Made a strong bullish breakout
Of the key horizontal level
Of 68.40$ so after a pullback
And a retest of the new support
We will be expecting a further
Bullish move up
Buy!
Comment and subscribe to help us grow!
Check out other forecasts below too!
Disclosure: I am part of Trade Nation's Influencer program and receive a monthly fee for using their TradingView charts in my analysis.

BTCUSD 2H | Breakout Flow + BOS Confirmation – CelestiaPipsBTC is slowly developing a breakout structure on the 2H timeframe .
Multiple bullish BOS points and a solid NY session demand base formed.
Price is currently retesting the breakout zone after sweeping short-term liquidity.
If price holds this zone, we could see continuation toward 88,900.
I’ve mapped out the entire flow – BOS, entry zone, and final target.
Watch how price reacts from this level.
— Shared by CelestiaPip

ETH/USD – Bullish Breakout & Buying OpportunityEthereum has broken out of a descending channel and is consolidating near a key support zone. The price action suggests a potential bullish continuation, with a buying opportunity forming above the $2,000 - $2,100 support level.
Key Levels to Watch:
Support: ~$2,000, ~$1,800
Resistance Zone: ~$2,250
Target: ~$2,530
Trading Plan:
Buy Entry: On breakout and retest above $2,250
Stop-Loss: Below $2,000
Take-Profit: $2,530
If Ethereum successfully breaks resistance with volume confirmation, it could rally toward $2,500+, making this a strong bullish setup. Keep an eye on price action for confirmation. 🚀

TAO ANALYSIS🔮 #TAO Analysis 💰💰
🌟🚀 As we can see that #TAO is trading in a symmetrical triangle and given a perfect breakout. But there is an instant resistance. If #TAO breaks the resistance 1 then we will see a good bullish move in few days . 🚀🚀
🔖 Current Price: $271
⏳ Target Price: $305
#TAO #Cryptocurrency #DYOR

ARC ANALYSIS🔮 #ARC Analysis
💲💲 #ARC is trading in a Symmetrical Triangle Pattern. If the price of #ARC breaks and sustain the higher price then will see a pump. Also there is an strong support zone. We may see a retest towards the support zone first and then a reversal📈
⁉️ What to do?
- We have marked crucial levels in the chart . We can trade according to the chart and make some profits. 🚀
#ARC #Cryptocurrency #Support #Resistance #DYOR

GOLD 1H | Demand Zone Reaction & Breakout Plan – CelestiaPipsGOLD on the 1H timeframe is reacting from a previously tested demand zone around 3000 .
Watching for a clean break & retest above 3044 for bullish continuation toward 3065.
Trendline break could act as early confirmation.
Structure-based idea shared by CelestiaPips.

(XAU/USD) Bearish Reversal After Head & Shoulders Formation."
Overview:
The price action of Gold (XAU/USD) on the 2-hour timeframe indicates a potential bearish move. A Head & Shoulders pattern has formed, signaling a possible trend reversal. The market recently tested a resistance level and is now showing signs of weakness.
Key Levels:
🔹 Resistance: $3,044 - $3,055 (Rejection Zone)
🔹 Sell Entry: Below $3,028 (Break of Support)
🔹 Support Level: Around $2,980 (First Key Level)
🔹 Target: $2,940 - $2,931 (Final Bearish Target)
Analysis:
✅ Price has broken below the neckline of the Head & Shoulders pattern, confirming a potential sell-off.
✅ A retest of the broken support as resistance could offer a better entry for shorts.
✅ If the price holds below $3,028, further downside toward $2,940 is expected.
✅ Bullish invalidation if price breaks back above $3,044.
Trade Idea:
📉 Sell below: $3,028
🎯 Target: $2,940
🛑 Stop Loss: Above $3,044
This setup aligns with technical analysis principles, with risk-to-reward favoring sellers. Monitor price action for confirmation before entering a trade.
🚀 What’s your view on Gold? Comment below!

Will this same bars pattern on CHZ repeat?Welcome back dear reader, for another Chilliz post.
As i've been analyzing the chart further my eye fell on the bars pattern from May till October 2020, and noticed that it looks ALOT like the current bars pattern.
The market structure it would form would also make alot of sense from a traders perspective. Allow me to explain while i have your attention.
The only sellers remaining now are from 2021 or earlier, so we might stay in this area for a couple of weeks for people to capitulate. Those that got in earlier are eager for a break-even and will probably get that end of this month or beginning of April. Then around the latter half of May we might see 0.20$ followed by a retest of the lower bounds forming a perfect W as traders suspect it to be the absolute end of the bullmarket. Only for it to be followed by a quick recovery and a massive blowoff top!
Target: Remains around 3$ (The fractal would indicate 17$ and a market cap of 160B, at 3$ it would be 28B which isn't too farfetched)
Stoploss: 0.032$
Final remarks: Do i know for certain that it will happen? No, but the charts tell us a different story.
Rustle

WHAT WILL BE THE NEXT MOVE OF GOLD ?🚀 GOLD (XAU/USD) – High-Probability Trade Setups! 🚀
Hey, traders! Hope you're all geared up for another exciting week in the markets! 🏆 As we get ready for the market open, let’s break down what’s next for Gold (XAU/USD).
📊 Last Week’s Recap
📈 Gold hit 3057, but before the market closed, we saw a strong rejection pushing price back down. Now, Gold is stuck in a range between 3024 resistance and 3020 support—meaning we need a breakout before taking action!
💡 No-trade zone = 3020 - 3024 ❌ Stay out until a breakout happens!
Two Possible Trading Scenarios
🔵 Scenario 1: Buy Above 3024
📌 If a 30M candle closes above 3024, we wait for the next candle to wick down while keeping the previous low safe.
📌 Once price breaks the high of the previous closed candle, we enter buys targeting 3034! 🚀
✅ Break-even after 40 pips—lock in those profits! 💰
🔴 Scenario 2: Sell Below 3020
📌 If a 30M candle closes below 3020, we wait for the next candle to wick up while keeping the previous high safe.
📌 Once price breaks the low of the previous closed candle, we enter sells targeting 3011! 📉
✅ Break-even after 40 pips—protect your capital!
📍 Final Trade Plan
📊 BUY above 3024 🎯 TP: 3034
📊 SELL below 3020 🎯 TP: 3011
📢 Don’t chase trades! Let the market confirm and follow the plan! 📈🔥 #XAUUSD #GoldAnalysis #ForexTrading #SmartMoney

Kotak Mahindra Bank Consolidation Rectangle Breakout.Kotak Mahindra Bank is Consolidating since 2021 in a Rectangle Pattern.
Breakout of the level 2050 with the Volume increase.
CMP 2079
It should Retest 2050 again and then rally towards atleast 2500
Lets! Hope for the Best!

NZD-USD Free Signal! Sell!
Hello,Traders!
NZD-USD made a bearish
Breakout of the key horizontal
Level of 0.5755 so we are
Bearish biased and we can
Enter a short trade with the
Target Level of 0.5695 and
The Stop Loss of 0.5775
Sell!
Comment and subscribe to help us grow!
Check out other forecasts below too!
Disclosure: I am part of Trade Nation's Influencer program and receive a monthly fee for using their TradingView charts in my analysis.

Nestle - Long term Bottom formation and Breakout for investmentSupport b/w 2100-2150 since Dec 24 has been holding
50 month SMA at 2106— very strong & rarely breaks
200 week SMA rarely breached & now at 2132
Moving averages: Crossed 20/50/100 day SMA
MACD: Daily +ve, Weekly +ve, Monthly -ve
Daily CCI > 100 (bullish)
Resistance Levels:
- 2280 (range)
- 2380-2400 : 2380 (100 week SMA), 2387 (parallel), 2394 (50 week SMA)—converging soon.
Break above 2280 likely coming week, but break above 2380-2400 with volume needed for long term breakout.
2100 support intact currently
At 2268-2280: Strong 2100 support. Buy on every dip for long term or on 2280 breakout.
Target - 2700 in 06 months
Long term Stop loss- below 2100
For short swing- Target 2380 if it breaks & closes above 2280, make 2270 as stop loss

BTC/USD Trading Analysis – Double Bottom & Rising Wedge BreakoutThis BTC/USD 4-hour chart showcases a potential bullish breakout setup based on technical patterns, key support and resistance levels, and price action analysis. The chart suggests a trend reversal following a downtrend, with signs of bullish momentum building up.
Let's break down the full technical analysis, covering the chart structure, key levels, price patterns, and trading strategy.
1. Market Structure & Identified Patterns
A. Double Bottom Reversal – Strong Bullish Signal
A double bottom pattern has formed, which is a bullish reversal signal that indicates the end of a downtrend.
This pattern consists of two significant low points (Bottom 1 and Bottom 2) near the $80,000 - $81,000 support zone.
The pattern confirms strong buying interest at this level, preventing further price drops.
A breakout above the resistance level would confirm the pattern’s validity, signaling a move toward higher targets.
B. Rising Wedge Formation – Potential Bullish Breakout
The price action is consolidating in a rising wedge, forming higher highs and higher lows within a narrowing range.
A rising wedge often suggests a potential breakout.
Since this wedge forms after a double bottom, the breakout is expected to be bullish, rather than a bearish breakdown.
If the price breaks above the wedge’s upper trendline, it will confirm a strong upward momentum.
2. Key Support & Resistance Levels
Support Levels:
Major Support Zone (80,000 – 81,000):
This level has been tested twice, confirming buyer strength.
It serves as the foundation for the double bottom pattern.
Stop Loss Level (72,921):
If the price drops below this level, it would invalidate the bullish setup.
This level is strategically placed to manage risk and protect against potential downturns.
Resistance Levels:
First Resistance Zone (95,000 – 100,000):
This is a critical level, as the price has faced multiple rejections here.
A breakout above this zone would confirm a strong bullish trend continuation.
Take Profit Targets:
TP1 (108,481): The first take-profit target aligns with previous highs and is a logical point for partial profit booking.
TP2 (114,372): This is the second profit target, calculated based on Fibonacci extensions and historical price movements.
3. Trading Strategy & Execution Plan
A. Entry Strategy
To execute a successful trade, we need to wait for confirmation of the breakout.
Ideal Entry: After a strong breakout above 95,000 – 100,000, indicating bullish momentum.
Confirmation Factors:
Increased trading volume → Signals strong buying interest.
Candle close above resistance → Confirms breakout.
Retest of broken resistance as support → Strengthens bullish continuation.
B. Risk Management
Stop Loss Placement: Below 72,921, ensuring limited downside risk.
Risk-to-Reward Ratio: The trade setup aims for a 1:3 or better risk-to-reward ratio.
C. Potential Scenarios
✅ Bullish Breakout:
If BTC breaks and holds above 95,000 – 100,000, we can expect a rally toward 108,481 (TP1) and 114,372 (TP2).
❌ Bearish Rejection:
If BTC fails to break resistance, it could retest 80,000 or drop lower, invalidating the bullish setup.
4. Final Thoughts – What to Expect?
This BTC/USD 4-hour chart analysis provides a high-probability bullish trade setup, supported by:
✅ Double Bottom Formation → Strong Reversal Signal
✅ Rising Wedge Breakout Potential → Momentum Building
✅ Key Resistance Breakout Levels Identified
📌 Conclusion:
If Bitcoin breaks above 95,000 – 100,000, expect a major bullish move toward 108,481 and beyond. However, if resistance holds, we might see a retest of lower support levels. Risk management is essential for a successful trade execution. 🚀

Insmed (INSM) - Breakout Opportunity 📌 Insmed ( NASDAQ:INSM ) – Breakout Opportunity
Insmed is a clinical-stage biopharmaceutical company focused on serious and rare lung diseases. The stock more than doubled in May 2024 following positive Phase 3 results for its drug Brensocatib. The FDA has granted Priority Review, with a PDUFA date set for August 12, 2025 — and commercial launch expected in H2 2025.
Technical Overview:
Since the massive gap up in May 2024, INSM has been trading inside a well-defined horizontal channel between:
🔻 Support: $61.65
🔺 Resistance: $84.82
Currently, price is near the upper third of the range (~$79.92), showing signs of renewed momentum with rising volume and RSI trending higher.
Plan
----
📍 Entry: Daily close above $85 with strong volume ( >2.5M )
Targets
🎯 Target 1: $94 (+11%)
🎯 Target 2: $106 (+25%)
🛑 Stop: $82 (-4.7%)
Risk ratio:
🟠 Target 1: > 2:1
🟢 Target 2: > 5:1
---
📊 Key Indicators to Watch:
✅ RSI > 60 with upward slope
✅ MACD bullish crossover
✅ Break above 20-day EMA with volume
✅ Volume expansion on green candles
⚠️ This content is for informational and educational purposes only and does not constitute investment advice ⚠️

AUD_CAD SHORT SIGNAL|
✅AUD_CAD is going down
And the pair made a bearish
Breakout of the key horizontal
Level of 0.9007 which is now
A resistance so we are bearish
Biased and we will be able
To enter a short trade on Monday
With the TP of 0.8970 and
The SL of 0.9030
SHORT🔥
✅Like and subscribe to never miss a new idea!✅
Disclosure: I am part of Trade Nation's Influencer program and receive a monthly fee for using their TradingView charts in my analysis.

EUR/USD Trading Analysis – Falling Wedge Breakout StrategyChart Overview
The EUR/USD 1-hour chart presents a classic falling wedge pattern, which is a bullish reversal setup indicating that selling momentum is weakening and a breakout to the upside is imminent. This chart provides a structured trading plan, highlighting support and resistance levels, entry points, stop-loss placement, and a target price.
Traders can use this setup to capitalize on the potential bullish move while effectively managing risk. Let’s break it down step by step.
1. Understanding the Falling Wedge Pattern
A falling wedge is formed when price action moves within two downward-sloping trendlines that converge. It signals decreasing bearish pressure, as the price forms lower highs and lower lows within a narrowing range. The decreasing range indicates that sellers are losing control, and an upside breakout is likely.
In this chart, we observe the following key characteristics of a falling wedge:
✅ Two converging downward trendlines that contain price movement.
✅ Lower highs and lower lows showing seller exhaustion.
✅ Decreasing volume as the price approaches the breakout zone.
✅ Support near 1.08000, which has held price several times before.
A breakout above the wedge signals a shift from bearish to bullish sentiment, making this a strong trade setup.
2. Key Support & Resistance Levels
🔹 Support Level (Demand Zone)
The horizontal blue zone at 1.07898 – 1.08000 is a critical support level.
This level has been tested multiple times, making it a strong demand zone where buyers step in.
The falling wedge bottom aligns with this area, reinforcing its importance.
If price stays above this zone, it confirms the potential for a bullish breakout.
🔹 Resistance Level (Supply Zone)
The resistance zone at 1.09300 - 1.09839 has acted as a barrier to upward movement.
Price previously reversed from this zone, making it a logical take-profit area.
If the breakout happens, this level will be tested again.
A break above 1.09839 would signal further bullish momentum.
3. Trading Strategy – Step-by-Step Execution
📌 Entry Confirmation
To enter this trade with confidence, traders should wait for a confirmed breakout above the wedge.
A strong bullish candle breaking above the wedge’s upper trendline signals entry.
Ideally, a pullback and retest of the breakout level would provide additional confirmation before entering long.
📌 Stop-Loss Placement
Risk management is key, and stop-loss placement should be strategic to avoid unnecessary losses.
A stop-loss is set just below 1.07898, slightly under the recent low.
This placement ensures protection against false breakouts.
📌 Take-Profit Target
The take-profit target is set at 1.09839, aligning with key resistance and the projected wedge breakout distance.
This level has historically acted as resistance, making it an ideal zone to exit profits.
Partial profit-taking can be considered near 1.09300, before the final target.
📌 Risk-to-Reward Ratio
With a tight stop-loss and a higher profit target, this trade offers a favorable risk-reward ratio (RRR).
A minimum RRR of 1:3 is recommended, meaning potential reward is three times the risk taken.
4. Expected Market Behavior & Possible Scenarios
📊 Scenario 1: Bullish Breakout Confirmation 🚀
If price breaks and closes above the wedge, we expect a rally towards 1.09300 - 1.09839.
Pullback to retest the breakout zone would further confirm bullish strength.
Strong volume would validate the breakout, leading to a high-probability move.
📉 Scenario 2: Bearish Breakdown (Invalidation) ❌
If price breaks below 1.07898, the bullish setup is invalidated.
A downside move could push the price lower, possibly towards 1.07500 or below.
Traders should exit long positions if this scenario unfolds.
5. Additional Technical Indicators for Confirmation
To strengthen this trade setup, traders can use:
✅ RSI (Relative Strength Index) – Look for RSI divergence or a move above 50, confirming bullish strength.
✅ MACD (Moving Average Convergence Divergence) – A bullish crossover on MACD would reinforce the breakout.
✅ Volume Analysis – A spike in volume at the breakout level adds confidence in the move.
6. Conclusion & Trading Plan
This falling wedge setup suggests a high-probability bullish breakout if the price confirms above the resistance zone.
🔹 Trading Plan Summary:
✅ Wait for a breakout above the wedge before entering.
✅ Confirm breakout with a retest or strong bullish candle.
✅ Set stop-loss below 1.07898 to limit downside risk.
✅ Take profit at 1.09839, securing profits at resistance.
This strategy offers an excellent risk-to-reward ratio, making it a well-structured trade setup. Always manage risk and avoid premature entries without confirmation.
📌 TradingView Tags for Maximum Visibility
#EURUSD #Forex #TechnicalAnalysis #FallingWedge #Breakout #PriceAction #ForexSignals #SupportResistance #TradingSetup #DayTrading #SwingTrading

EUR_CAD SHORT SIGNAL|
✅EUR_CAD is going down
Now and the pair made a
Bearish breakout of the local
Key level of 1.5580 which is now
A resistance so we are locally
Bearish biased and we will be
Expecting a further move down
So a short trade can be entered
With the TP of 1.5480 and
The SL of 1.5600
SHORT🔥
✅Like and subscribe to never miss a new idea!✅
Disclosure: I am part of Trade Nation's Influencer program and receive a monthly fee for using their TradingView charts in my analysis.

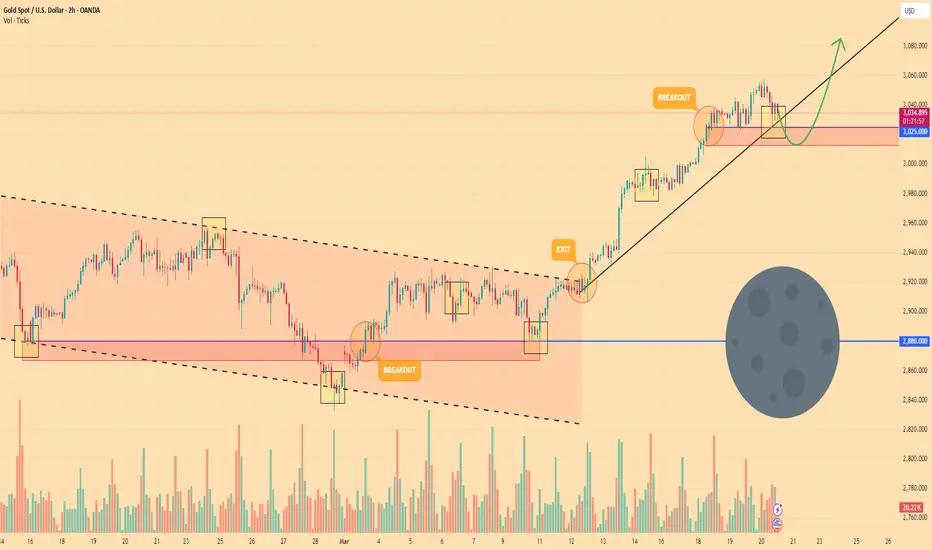
GOLD - Price can decline to support area and then start to growHi guys, this is my overview for XAUUSD, feel free to check it and write your feedback in comments👊
Recently price started to decline to falling channel and soon reached $2880 level and then rose to the resistance line.
Then price bounced and in a short time declined to support line of the channel breaking $2880 level.
But soon, Gold bounced from line and broke $2880 level again and some time traded near resistance line.
Next, price made a correction to $2880 level and then started to grow and soon exited from falling channel.
After this Gold reached $3025 level, broke it, and is now traded near this level, which coincides with support line.
So, in my opinion, Gold can decline to support area and then it bounce up to $3085, breaking the support line.
If this post is useful to you, you can support me with like/boost and advice in comments❤️
Breakout ExpectedMonthly Closing above 18.40 will trigger
further upside.
Long Consolidation Breakout Expected.
Bullish on Weekly TF.
Hidden Bullish Divergence on Weekly TF.

EUR-CAD Free Signal! Sell!
Hello,Traders!
EUR-CAD made a bearish
Breakout of the key horizontal
Level of 1.5528 so we are
Bearish biased so we can
Enter a short trade with
The Take Profit of 1.5454
And the Stop Loss of 1.5576
Sell!
Comment and subscribe to help us grow!
Check out other forecasts below too!
Disclosure: I am part of Trade Nation's Influencer program and receive a monthly fee for using their TradingView charts in my analysis.
