SILVER Bullish Breakout! Buy!
Hello,Traders!
SILVER is trading in an uptrend
And the price made a bullish
Breakout of the key horizontal
Level of 3266$ and the brekaout
Is confirmed so we are bullish
Biased and we will be expecting
A further bullish continuation
Buy!
Comment and subscribe to help us grow!
Check out other forecasts below too!
Disclosure: I am part of Trade Nation's Influencer program and receive a monthly fee for using their TradingView charts in my analysis.
Breakout!

New day, new DOUBLED stock $RAY $0.87 to $2.14Doesn't matter what the market is doing!
Our stocks still double! 💯
It's time to adjust your trading strategy to get ahead
Trading NASDAQ:NVDA NASDAQ:TSLA competing with wall street sharks for 10% 20% over weeks or months is not it!
It's much easier taking money from retail shortsellers as they get squeezed into vertical +100% +200% moves

GBPCAD - NEW BREAKOUT !Hello Traders !
On the weekly time frame, The GBPCAD price broke the resistance (1.84164 - 1.82638).
This key level becomes new support !
So, I predict a bullish move🚀
_____________
TARGET: 1.89450🎯

EURUSD - BULLISH SCENARIOHello Traders !
On Friday 7 March, The EURUSD reached the resistance level (1.09374 - 1.08834).
Let's expect the BULLISH SCENARIO:
If the market breaks above the resistance level and closes above that,
We will see a bullish move📈
TARGET: 1.11580🎯

Some Positivity Seen...0.5% Fib level retracement &
Also, Confirmed HL around 29 - 30.
Important Support lies around 32.50 - 34.70
Should not Break 29, otherwise, we may witness
further Selling Pressure.
If 36.30 is Sustained, we may witness 38 - 38.50
which is again a Strong Resistance.
Stock will be in uptrend again if is Sustains 38.50
& it may hit 49 - 50 again. Also because , it seems
as now it is Re-testing the Breakout level around 34.50 - 35.

41K is Coming?Will the 200-week simple moving average waiting around 41K meet us or will we continue to rise with a reaction from the fib levels? My personal opinion is that the bull never started. We just made a new high. Now it's time for a new low.

Alibaba - This Chart Is Pretty Beautiful!Alibaba ( NYSE:BABA ) is perfectly respecting structure:
Click chart above to see the detailed analysis👆🏻
With a rally of about +80% within a couple of weeks, Alibaba is clearly showing signs of bulls completely taking over. This pressure was not unexpected though after we perfectly witnessed the major trendline breakout a couple of months ago and a retest of the confluence of support.
Levels to watch: $140, $110
Keep your long term vision,
Philip (BasicTrading)

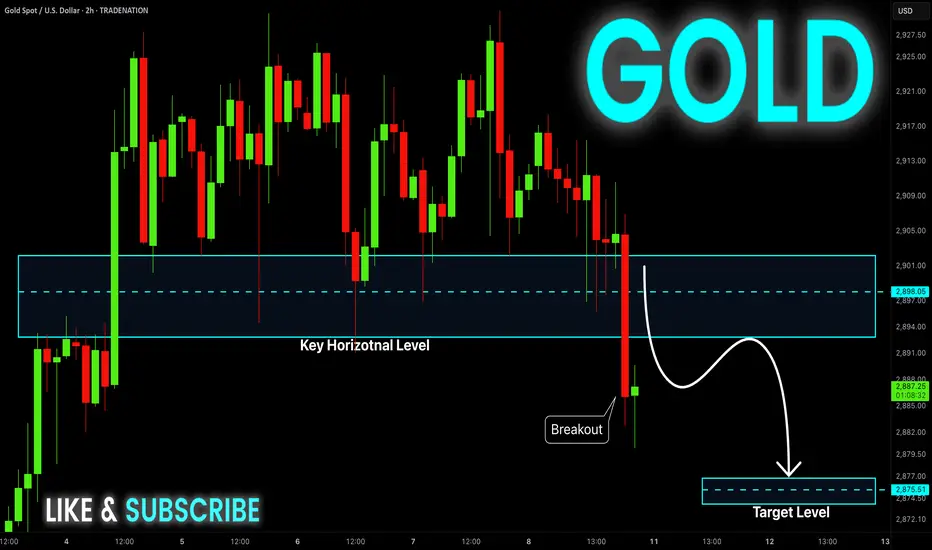
GOLD Risky Short! Sell!
Hello,Traders!
GOLD made a bearish
Breakout of the key
Horizontal level of 2900$
And the breakout is confirmed
So we are locally bearish
Biased and we will be
Expecting a further move down
Sell!
Comment and subscribe to help us grow!
Check out other forecasts below too!
Disclosure: I am part of Trade Nation's Influencer program and receive a monthly fee for using their TradingView charts in my analysis.
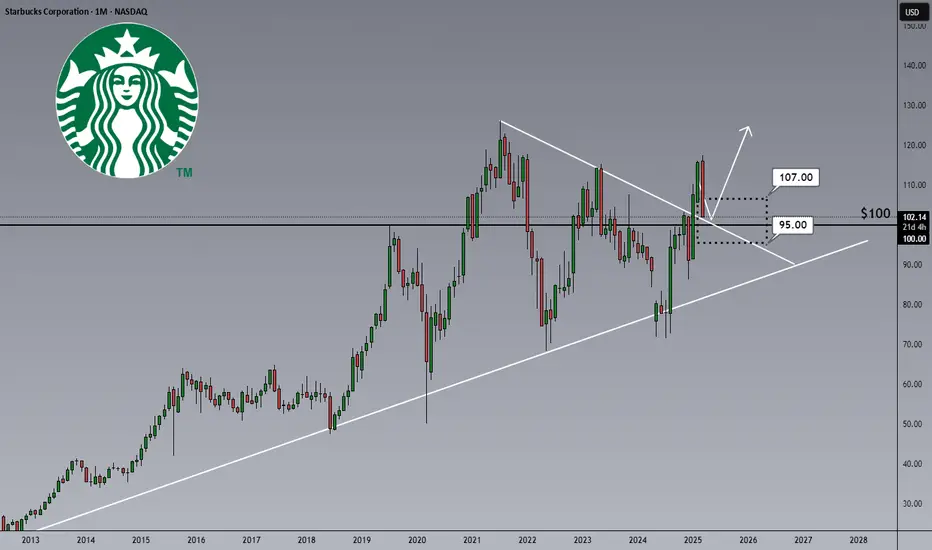
Starbucks Retesting The Breakout Area!Hi,
It has broken out of a three-and-a-half-year downtrend, confirmed with monthly candle closes. Today we are retesting the breakout area with psychological number $100 inside of it.
Cheers,
Vaido
#BTC: IS THE BULL MARKET OVER??🚀 Hey Traders!
If you're finding value in this analysis, smash that 👍 and hit Follow for high-accuracy trade setups that actually deliver! 💹🔥
Is the Bull Market Over? 🤔
The big question on everyone's mind—Has the bull market ended? My answer is NO! Let’s break it down:
📊 Technical Perspective:
As you can see in the chart, BTC recently broke out from an inverse head and shoulders pattern on the weekly timeframe. This current dip? It’s nothing but a healthy retest of the breakout ($72k-$75k). Once BTC successfully confirms this retest, we should see a strong push to the upside. Patience is key!
🌍 Fundamental Perspective:
1️⃣ Institutional Adoption: Big players like BlackRock, Fidelity, and global hedge funds continue accumulating BTC, Also adopting by some big countries like US proving confidence in the long-term trend.
2️⃣ ETF Inflows: Bitcoin Spot ETFs have seen billions in inflows—indicating that traditional finance (TradFi) is betting on BTC’s future.
3️⃣ Macroeconomics: With the Fed slowing down rate hikes, liquidity might start flowing back into risk assets, benefiting BTC and crypto as a whole.
🔍 The Key Level to Watch:
A successful bounce from the neckline of this pattern will confirm strength and could send BTC soaring to new highs!
🔥 What’s your take? Drop your thoughts in the comments, and let’s navigate this market together! 🚀💰

Resistance on the Edge? A breakout in Sight!In our previous analysis, we anticipated a price drop—and it played out perfectly, securing 10,315.6 pips in profit.
What’s Next?
Now, after analyzing multiple timeframes, we see that the price has bounced off the 2nd large channel’s middle line, a key support level respected multiple times in the past. Currently, it’s trading around 2915.44, near our resistance zone at 2922.
Since March 4 (Tuesday), the price has been testing this level repeatedly, suggesting that the resistance is weakening. If 2922 breaks, our next targets will be:
📍 2940 – Next resistance zone
📍 2949 – First price target
📍 2968 – Second price target
🛡 A trader’s first goal is survival. Profits come second.
🔑 Take care of your losses, and the profits will take care of themselves.
Stay disciplined and trade wisely. Happy trading!

NATGAS BULLISH BREAKOUT|
✅NATGAS is trading in an
Uptrend and the price made
A strong bullish breakout
Of the key level of 4.400$
Which is now a support
So we will be expecting
A further bullish move up
LONG🚀
✅Like and subscribe to never miss a new idea!✅

Global liquidity breakoutA weighted sum of global liquidity has just broken out of a falling wedge, signaling a clear cash injection into the financial system. This breakout suggests an imminent shift in market conditions, as liquidity expansion typically fuels risk-on sentiment across equities, crypto, and commodities. Since this is a lagging indicator, markets are expected to react soon, with asset prices likely to follow the upward momentum driven by increased liquidity.
The formula aggregates the total assets of major central banks, including the Federal Reserve, Bank of Japan, People’s Bank of China, and European Central Bank, while adjusting for currency exchange rates to reflect their true impact in USD terms. Liquidity-draining factors such as the Reverse Repo (RRP) and the Treasury General Account (TGA) are subtracted to provide a clearer picture of the actual liquidity available in the system.

DGB ANALYSIS🔮 #DGB Analysis - Breakout 🚀🚀
💲💲 In daily time-frame,Falling Wedge Pattern is forming and a good breakout is done. And a small retest is done, now we would see a good reversal move in #DGB ✅ 💯🚀
💸Current Price -- $0.00955
📈Target Price -- $0.001544
⁉️ What to do?
- We have marked crucial levels in the chart . We can trade according to the chart and make some profits. 🚀💸
#DGB #Cryptocurrency #Breakout #DYOR

Could LUNC be preparing to make a comeback?LUNC has been trading below equilibrium for about two years now, following a horrific loss in value that completely destroyed its reputation and shattered the wealth of tens of thousands of investors. However, the charts seem to indicate that LUNC could experience a 300% to 500% price increase by early 2026, perhaps even sooner.
I'm by no means a fan of LUNC and would avoid it like the plague if I were you. Regardless, the "wealth transfer" community across a wide variety of platforms seems convinced that God is telling them to buy this coin, as it will make them all wealthy beyond their wildest imaginations. Either that, or they live in states where cannabis is legal and are abusing the privilege. But time will tell if these people are LUNAtics or not.
Good luck, and always use a stop-loss!

Amazon - Catch The Parabolic Rally Now!Amazon ( NASDAQ:AMZN ) will start the parabolic rally:
Click chart above to see the detailed analysis👆🏻
Just a couple of months ago, we finally saw the expected all time high breakout on Amazon. Following the overall governing rising channel pattern, I simply do expect the acceleration of the current rally, the creation of a parabolic rally, but maybe we will see a bullish retest first.
Levels to watch: $180, $400
Keep your long term vision,
Philip (BasicTrading)

Could Cardano Bulls "Raise The Flag" To $2??COINBASE:ADAUSD has some very interesting Price Action happening with the decline starting from beginning of December 2024 forming what looks to be a Descending Channel with the potential to become a Bull Flag!
With a Bull Flag being a Continuation Pattern, we can expect a higher probability of a Bullish Break to this Channel to continue in the trend it was following prior to falling into this Consolidation Period.
Last week we saw a huge Bullish Candle form and Break the Channel after testing the March 2024 Highs, the 200 EMA @ .7719, along with the Linear Regression or "True Trendline" of the Descending Channel.
Other indicators suggest Bullishness as well with the RSI staying above 50 in Bullish Territory and we can see a large amount of Volume entering this Weekly Candle with 2 days and 19 hours left until Close at the time of publishing.
*If Cardano can continue to find Support and is able to make a Valid Bullish Break of this Channel, based off the "Flagpole" or Rally, prior to price falling into Consolidation, we can expect a potential 120% gain from the Break, potentially sending price up to test the overhead Resistance Zone in the ( $1.85 - $2.15 ) Range!
3/7 - The White House will be holding the very first U.S. Crypto Summit to make plans to start bringing cryptocurrency into a U.S. Crypto Strategic Reserve
www.tradingview.com

Nvidia - The +50% Rally Is Inevitable!Nvidia ( NASDAQ:NVDA ) is about to create a false breakdown:
Click chart above to see the detailed analysis👆🏻
After the -12% drop on Nvidia last month, Nvidia actually broke the final support trendline towards the downside. However bulls are about to break it again towards the upside, which would confirm the false bearish breakdown, leading to a short squeeze rally of about +50%.
Levels to watch: $140, $200
Keep your long term vision,
Philip (BasicTrading)

$2.80 to $4.50 in 30 minutes$2.80 to $4.50 in 30 minutes 💥 Been waiting for this NASDAQ:GV trade whole days since morning Buy Alert and reconfirmation in after $2.50 held support strongly before the move 🚀
Called out 3 trades today, all 3 of them reached my pre-planned max target areas 🎯 They were NASDAQ:GV NASDAQ:CDXC NASDAQ:MASS
Excited for new ones tomorrow

Gold (XAUUSD) - Inverse Head & Shoulders Breakout Setup!Hello everyone, i hope you all will be doing good in your life and your trading as well, let's discuss about Gold and it is showing a strong bullish setup with an inverse head and shoulders pattern on the 1-hour chart . This means buyers are stepping in , and a breakout above the $2,930-$2,932 neckline could push prices higher toward the next resistance at $2,954-$2,960 . A stop-loss around $2,910-$2,906 can help manage risk in case of a pullback. Watch for volume confirmation when the breakout happens—it’ll add more strength to the move!
If Gold breaks out and holds above the neckline , we could see a good upside rally as buyers take charge. But if it fails to sustain, we might see some consolidation or even a drop. Best approach? Wait for a clean breakout and retest before jumping in. Stay sharp, manage risk, and trade smart!
Disclaimer: This analysis is for educational purposes only. Please consult a financial advisor before making investment decisions.
If you Found this helpful? Don’t forget to like, share, and drop your thoughts in the comments below.

GBP_CHF SWING LONG|
✅GBP_CHF made a bullish
Breakout of the key horizontal
Level of 1.1400 and the breakout
Is confirmed so we are bullish
Biased and we will be expecting
A further move up and a retest
Of the horizontal resistance
Above around 1.1606
LONG🚀
✅Like and subscribe to never miss a new idea!✅

Gold - A Bullish Close Would Be Insane!Gold ( TVC:GOLD ) has to close bullish now:
Click chart above to see the detailed analysis👆🏻
Just since the end of 2022, Gold rallied about +80% which is simply unbelievable looking at the already significant market cap of the precious metal. However this bullrun does not seem to be over and if Gold confirmes the trendline breakout, another rally of +40% will follow soon.
Levels to watch: $4.000
Keep your long term vision,
Philip (BasicTrading)

Chainlink - Preparing for trend reversalBINANCE:LINKUSDT (1D CHART) Technical Analysis Update
LINK is currently trading at $16.39 and currently we are seeing trend reversal and heading towards breakout from the bearish trend, if the price continues the bullish momentum we expect a clear breakout and bullish start of the bullish trend.
Entry level: $ Enter after breakout 18
Stop Loss Level: $14
TakeProfit 1: $ 20
TakeProfit 2: $ 22
TakeProfit 3: $ 26
TakeProfit 4: $ 30
TakeProfit 5: $ 35
Max Leverage: 2x
Position Size: 1% of capital
Remember to set your stop loss.
Follow our TradingView account for more technical analysis updates. | Like, share, and comment your thoughts.
Cheers
GreenCrypto
