GBP/USD: Bulls in Control… For Now! Key Levels to Watch Hello Folks
GBP/USD is holding strong above 1.2533, and I see a potential bullish move toward 1.2805 if momentum continues. But I’m staying flexible—if price breaks below 1.2450, my bias shifts, and I’ll look for downside targets instead. 📊
📍 Here’s how I see it:
✅ Bullish above: 1.2533 → 1.2627 → 1.2650 → 1.2805 🚀
❌ Bearish shift below: 1.2450 → 1.2378 👀
💡 My Plan:
As long as GBP/USD stays above 1.2533, I’m bullish and expecting a push toward 1.2805 📈
If price drops below 1.2450, I’ll reconsider and look for shorts instead 📉
⚠️ No need to rush—let the market confirm the move!
Breakout!

SPX SPY Trading Range or BO? Daily Chart Analysis - 5 Mar 2025
• The market traded lower earlier in the day. The market then reversed higher for most of the day around noon time. The SPX then pulled back off its high in the final 30 minutes of the day.
• The bulls see the market trading in a broad bull channel and want the move to continue for months. They want an endless pullback bull trend.
• They want a retest of the all-time high (Dec 6) followed by a breakout and trend resumption. They see the current move as a bull leg within the trading range.
• They want a reversal from a double bottom bull flag (Jan 13 and Mar 4) and a wedge (Feb 25, Feb 28, and Mar 4).
• They hope the bottom of the 22-week trading range will act as support. They want a failed breakout below the January 13 low.
• At the least, they want a retest of the middle of the trading range (around the 20-day EMA).
• If the market trades lower, they want the November 4 or October 3 low to act as support.
• The bears got a reversal from a higher high major trend reversal, a wedge top (Dec 6, Jan 24, and Feb 19), and a smaller double top (Jan 24 and Feb 19).
• They see the market as being in a 22-week trading range.
• They hope to get a bear leg to retest the January 13 low followed by a breakout below. They got it yesterday (Mar 4).
• Next, the bears want a breakout below the January 13 low, followed by a measured move based on the height of the 22-week trading range.
• If the market trades higher, they want the bear trend line or the 20-day EMA to act as resistance.
• They want at least a small second leg sideways to down to retest the March 4 low.
• So far, the market is trading in a 22-week trading range.
• The SPX broke below the January 13 low yesterday (Mar 4) and traders want to see if there are any follow-through selling.
• Or will the market form a pullback, followed by a second leg sideways to down to retest the March 4 low after that?
• Traders may BLSH (Buy Low, Sell High) within the trading range until there is a breakout from either direction with follow-through buying/selling.
• The bears must create a strong breakout below the January 13 low with follow-through selling to convince traders a breakout could be underway.

Meta - The Breakout Is About To Be Confirmed!Meta ( NASDAQ:META ) is attempting the breakout:
Click chart above to see the detailed analysis👆🏻
Over the past couple of months, we have been witnessing an incredible rally of about +750% on Meta. Looking at the long term reverse triangle pattern, this rally was not unexpected and such is the breakout. We still need to see confirmation, but then Meta will target the four digit level.
Levels to watch: $700, $1.000
Keep your long term vision,
Philip (BasicTrading)

Potential rise for goldHello traders
there is an upward momentum and an expanding correction pattern, another upward wave is expected.

Morning Star Formation on Daily TF.Morning Star Formation on Daily TF.
No Bearish Divergence yet that has matured.
a Very Important Support lies arround 173.50 - 177.50
Beautifully printed HL & Moving Up now.
Crossing & Sustaining 194 may lead it towards
200+ with ultimate target around 230.

Falling Resistance Trendline Breakout on 2 hr Timeframe.Hello everyone, i hope you all will be doing good in your life and your Trading as well. Today i have analysed gold chart and found it has given breakout of falling resistance trendline, i am expecting momentum for upside in this. Probability is high it should travel towards our target area. The volume has been increasing, suggesting strong buying interest, and the RSI at 62.32 is in the bullish zone, confirming the upward momentum. Additionally, the MACD crossover adds further confidence to this bullish setup. The ideal entry point is when the price breaks above the resistance at 2,955.16 . Set the stop loss just below the support level at 2,860.96 to manage risk. For targets, consider aiming for 2,965.00 , 2,975.00 , and 2,985.00 , with the final target around 2,995.00 . If the breakout holds, this setup could present a strong uptrend continuation.
Disclaimer:- This analysis is for educational purposes only. Please trade responsibly and consult a financial advisor before making any decisions.
If you found this analysis helpful, don’t forget to like, follow, and share your thoughts in the comments below! Your support keeps me motivated to share more insights. Let’s grow and learn together—happy trading!

Breakout in Organogenesis Holdings Inc...Chart is self explanatory. Levels of breakout, possible up-moves (where stock may find resistances) and support (close below which, setup will be invalidated) are clearly defined.
Disclaimer: This is for demonstration and educational purpose only. This is not buying or selling recommendations. Please consult your financial advisor before taking any trade.

Breakout in ADT Inc...Chart is self explanatory. Levels of breakout, possible up-moves (where stock may find resistances) and support (close below which, setup will be invalidated) are clearly defined.
Disclaimer: This is for demonstration and educational purpose only. This is not buying or selling recommendations. Please consult your financial advisor before taking any trade.

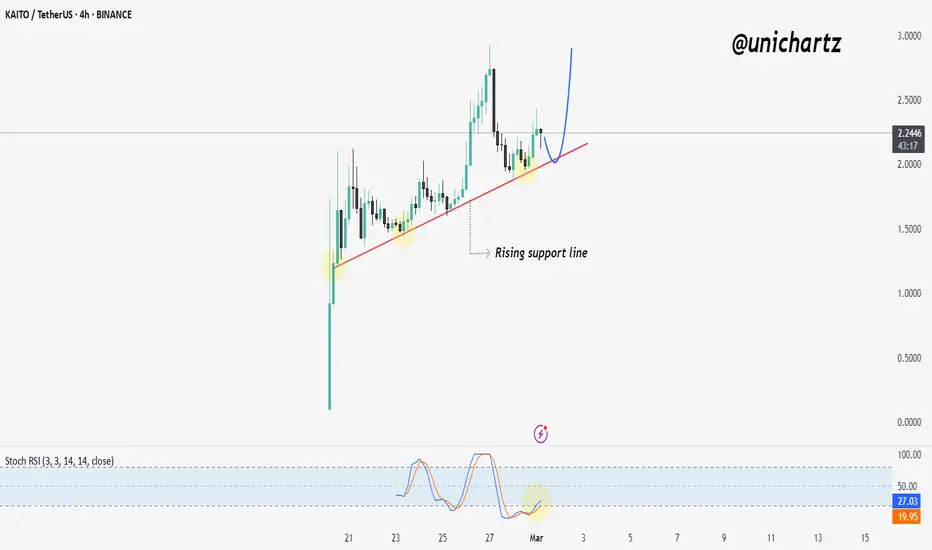
KAITO Holding Rising Support – Is a Big Move Coming?$KAITO/USDT is respecting a rising support line, with price bouncing multiple times from this level. The current retest suggests a potential bullish continuation, especially with the Stochastic RSI in the oversold zone, indicating a possible reversal.
If the trendline holds, we may see a strong upward move, targeting previous highs around $2.50 - $3.00. However, a break below the support could invalidate the bullish outlook.
DYOR, NFA
Dead Bitcoin soon will break 92K support (Bye 100K and Hi 80K) As we mentioned a lot major support which is 92K$ is holding price from falling now for 8Th times and each time a support or resistance touch it gets weaker and soon this support will also break to the downside and below 90K$ we are looking for massive dump and fall and start of bear market for at least 2-3 months and this would be correction and rest for market and bitcoin and after that we are looking for rise and next phase pump for the market and maybe targets like 130K$ and more.
So for now we are looking for correction and dump like the red arrows and for confirmation of bear market and dump major support zone should break soon.
DISCLAIMER: ((trade based on your own decision))
<<press like👍 if you enjoy💚

USDJPY - BULLISH SCENARIOHello Traders !
On Thursday 20 FEB, The USDJPY reached the support level (149.356 - 148.639) and failed to break it !
So, We have a bullish scenario:
If the price breaks and closes above the lower high (150.733 - 150.469),
We will see a bullish move🚀
_______________
TARGET: 153.700🎯

AUDUSD - Fake BreakoutHello Traders !
The AUDUSD failed to break the resistance level (0.63142 - 0.63449).
The higher low is broken (change of character).
So, I expect a bearish move📉
_______________
TARGET: 0.62100🎯

DOTUSDTRange Breakout: The pair has been trading within a range, and the breakout from this range signals potential bullish momentum. A breakout indicates that the price is ready to move out of its consolidation phase, with buyers now in control.
Trendline Breakout: The price breaking above a key trendline further confirms a shift from a bearish or neutral market sentiment to a more bullish one. This is a strong signal that upward momentum is building.

Xrp - Market Structure Is Just Super Bullish!Xrp ( CRYPTO:XRPUSD ) is still 100% dominated by bulls:
Click chart above to see the detailed analysis👆🏻
With the massive +650% rally over the past couple of months, Xrp perfectly broke out of a long term ascending triangle formation. We already saw a retest of this previous resistance which is now turned support and Xrp is now simply starting the continuation of the bullish rally.
Levels to watch: $2.0, $4.0
Keep your long term vision,
Philip (BasicTrading)

Bullish on All Time Frames.Bullish on All Time Frames.
Crossing & Sustaining 208 will lead
it towards 260 - 265 & then 300+
Immediate Supports lies around 200 &
then around 183 - 187
Fresh Entry can be made once 208 is
Sustained.

$NASDAQ:AISP breaking resistance for a 35%++ upsideNASDAQ:AISP broke it's double bottom pattern resistance with some upside potential.
Entry Point: At the current price OR (as I suspect there will be a retest of the $6 resistance) somewhere around $6
Price Target: $8.14 - 35% from the $6 resistance.

TAOUSD Breakout and Retest Confirms Bullish StructureTAOUSD has shown strong bullish potential after breakout of two key patterns. The first pattern was a wedge, which formed between May and September 2024. This pattern is typically a bullish reversal signal, and as expected, the breakout led to a strong rally. After reaching new highs, the price then entered a bearish channel, which served as a corrective phase rather than a trend reversal. Recently, TAOUSD successfully breakout of this bearish channel and has now retested the breakout zone around $411, confirming previous resistance as a new support level.
Currently, the $400 – $411 zone acts as a critical support area that needs to hold for further upside continuation. If the price maintains strength above this level, the next key resistance to watch is $480, where previous price rejections occurred. In the medium term, the major bullish target lies at $705 – $730, aligning with a previous major high. From a trading perspective, aggressive entries can be considered around $410 – $420 during this retest, while conservative traders may wait for confirmation with a strong breakout above $480. A stop-loss should ideally be placed below $400, as a breakdown below this level could invalidate the bullish outlook.
For confirmation, volume strength should be monitored, as a breakout with low volume may indicate weakness or a potential fakeout. Additionally, broader market sentiment, particularly Bitcoin’s trend, could influence TAOUSD’s price action.

Breakout in Innodata Inc...Chart is self explanatory. Levels of breakout, possible up-moves (where stock may find resistances) and support (close below which, setup will be invalidated) are clearly defined.
Disclaimer: This is for demonstration and educational purpose only. This is not buying or selling recommendations. Please consult your financial advisor before taking any trade.

Leap Ahead with a Dynamic Setup: Trading with Andrew’s PitchforkThe Leap Trading Competition: A Chance to Trade Micro Euro Futures
TradingView’s "The Leap" Trading Competition provides an opportunity for traders to apply their futures trading strategies in a competitive environment. Participants can trade select CME Group futures contracts, including Micro Euro Futures (M6E).
This article presents a structured trade setup using Andrew’s Pitchfork, a technical tool that helps define potential trend direction and breakout levels. The setup involves two intersecting pitchforks near a key UFO support level, signaling the possibility of either an uptrend continuation or a confirmation of a new downtrend.
Understanding Andrew’s Pitchfork and Market Structure
Andrew’s Pitchfork is a technical analysis tool used to identify trend channels by plotting three parallel lines from a major price swing. The tool helps traders anticipate support, resistance, and breakout levels based on median lines.
In this setup, two pitchforks define opposing market structures. The green pitchfork represents an uptrend, suggesting that price could continue higher. The red pitchfork represents a developing downtrend, indicating a possible reversal. The intersection of these pitchforks at a key UFO support level marks an important decision point for the market.
The Dynamic Trade Setup: Long and Short Scenarios
In a long trade scenario, entry is confirmed if price breaks above the Upper Median Line (UML) of the red pitchfork. The target for the trade is the Median Line (ML) of the green pitchfork, representing trend continuation. A stop loss is placed below entry at a distance that ensures a minimum 3:1 reward-to-risk ratio.
In a short trade scenario, entry is confirmed if price breaks below the Lower Median Line (LML) of the green pitchfork. The target for the trade is the Median Line (ML) of the red pitchfork, confirming further downside movement. A stop loss is placed above entry at a distance that maintains a minimum 3:1 reward-to-risk ratio.
Because the UML, LML, and ML levels change dynamically with each bar, breakout levels and targets must be adjusted accordingly. If price remains inside the pitchfork structure, the setup remains neutral until confirmation occurs.
Contract Specifications and Margin Requirements
Euro FX Futures (6E) details:
Full contract specs: 6E Contract Specifications – CME Group
Contract size: €125,000
Tick size: 0.00005 per EUR/USD ($6.25 per tick)
Margin requirements depend on broker conditions and market volatility, currently around $2,600 per contract.
Micro EUR/USD Futures (M6E) details:
Full contract specs: M6E Contract Specifications – CME Group
Contract size: €12,500 (1/10th of 6E)
Tick size: 0.0001 per EUR/USD ($1.25 per tick)
Lower margin requirements provide access to traders with smaller accounts, currently around $260 per contract.
M6E offers a lower-cost alternative to 6E, making it a useful instrument for adjusting position sizes and managing risk effectively. Traders should consider market conditions and leverage when determining position sizes.
Execution and Trade Management
Before executing a trade, price must confirm a breakout by fully breaking above UML for long trades or below LML for short trades. Additional confirmation through volume trends, momentum indicators, or candlestick patterns may help validate the move.
If price does not confirm the breakout, the setup remains invalid. If price re-enters the pitchfork channel, traders should reassess market structure before taking a new position. Stop losses should be maintained at levels that align with a structured risk-reward plan.
Conclusion
Andrew’s Pitchfork provides a structured approach for trading trend continuation and reversals. This setup allows for both long and short breakout opportunities, depending on how price reacts at key pitchfork levels.
For traders in The Leap Trading Competition, this setup highlights the importance of disciplined execution, waiting for confirmation, and managing risk effectively when trading futures.
When charting futures, the data provided could be delayed. Traders working with the ticker symbols discussed in this idea may prefer to use CME Group real-time data plan on TradingView: www.tradingview.com - This consideration is particularly important for shorter-term traders, whereas it may be less critical for those focused on longer-term trading strategies.
General Disclaimer:
The trade ideas presented herein are solely for illustrative purposes forming a part of a case study intended to demonstrate key principles in risk management within the context of the specific market scenarios discussed. These ideas are not to be interpreted as investment recommendations or financial advice. They do not endorse or promote any specific trading strategies, financial products, or services. The information provided is based on data believed to be reliable; however, its accuracy or completeness cannot be guaranteed. Trading in financial markets involves risks, including the potential loss of principal. Each individual should conduct their own research and consult with professional financial advisors before making any investment decisions. The author or publisher of this content bears no responsibility for any actions taken based on the information provided or for any resultant financial or other losses.

EUR/USD is bullish now after this breakoutDESCENDING WEDGE PATTERN BREAKOUT :
FX:EURUSD has broken out of a descending wedge pattern with strong confirmation indicating market will go upwards till the target equivalent to the max width of the pattern
STRONG SUPPORT ZONE TESTED :
market has recently tested a strong support zone which it had tested earlier two times and had gone upwards indicating strong upward momentum for the currency pair
PROFIT TARGET :
level is 1.05274

Ethereum’s Accumulation Phase Ends – What’s Next?Ethereum has successfully broken above the accumulation zone, indicating a potential bullish continuation. The price is now approaching a critical descending trendline resistance (blue line), where a breakout could trigger further upside momentum.
Key Observations:
Breakout from Accumulation: The price has cleared a consolidation phase, suggesting renewed buying interest.
Next Resistance (Green Box): The immediate hurdle is the descending trendline resistance within the green box. A breakout and successful retest of this level could push the price toward the next major resistance.

MKR ANALYSIS📊 #MKR Analysis : Update
✅There was a formation of Falling Wedge Pattern on daily chart with a huge breakout 🧐
We could expect more bullish move if #MKR breaks the major resistance zone.
👀Current Price: $1.537
🚀 Target Price: $2.060
⚡️What to do ?
👀Keep an eye on #MKR price action and volume. We can trade according to the chart and make some profits⚡️⚡️
#MKR #Cryptocurrency #TechnicalAnalysis #DYOR

FARTCOIN: Breakout Alert! 200-300% Move Incoming?🚀 Hey Traders! Ready to Catch the FARTCOIN Explosion? 👋💨
If you’re pumped for this setup, smash that 👍 and hit Follow for elite trade ideas that actually deliver! 💹🔥
💎 FARTCOIN is breaking out! It's blasting out of a falling wedge pattern on the 4H time frame, signaling a potential 200-300% surge! Now’s the time to grab some and ride the wave! 📈
📌 Entry Range: CMP – Add more up to $0.36
🎯 Target: 200-300% upside!
🛑 Stop Loss: $0.324
⚡ Leverage: Spot or low leverage (Max 5x)
💬 What’s Your Take?
Are you bullish on FARTCOIN’s breakout potential? Drop your analysis, predictions, or strategies in the comments! Let’s secure those gains together! 💰🔥
