OKLO — when nuclear momentum breaks resistanceSince late 2024, OKLO had been consolidating inside a clear rectangle between $17 and $59. The breakout from this long-term range triggered a new bullish impulse. The price has since returned to retest the breakout zone, now aligned with the 0.618 Fibonacci retracement at $51.94. The retest has completed, and the price is bouncing upward, confirming buyer interest.
Technically, the trend remains firmly bullish. The price closed above the prior range, EMAs are aligned below, and the volume spike during breakout supports genuine demand. The volume profile shows a clean path toward $100, indicating limited resistance ahead. The structure suggests a controlled rally rather than an exhausted move.
Fundamentally, OKLO is a next-generation SMR (Small Modular Reactor) company focused on delivering compact, efficient nuclear power solutions. Following its public debut via SPAC and recent capital injection, OKLO is transitioning from development to implementation. Institutional interest is holding strong, and the broader move toward decarbonization and energy independence places the company in a strategic position.
Target levels:
— First target: $100 — psychological and technical resistance
— Second target: $143 — projected from prior range breakout
OKLO isn’t just another clean energy ticker — it’s a quiet disruptor with nuclear potential. The chart broke out. The volume confirmed. Now it’s time to see if the market follows through.
Breakout!

DXY Swing Short! Sell!
Hello,Traders!
DXY keeps falling down
And the index broke the
Key wide horizontal level
Around 97.800 which is now
A resistance and the breakout
Is confirmed so we are very
Bearish biased and we will
Be expecting a bearish
Continuation on Monday
Sell!
Comment and subscribe to help us grow!
Check out other forecasts below too!
Disclosure: I am part of Trade Nation's Influencer program and receive a monthly fee for using their TradingView charts in my analysis.

RSI Flashes Warning on EURUSD: Critical Level Under Watch!Good morning traders,
If the EURUSD pair breaks below the 1.16729 level due to an RSI divergence, the next potential target could be around 1.16093.
Keep in mind that a break below 1.16729 may also signal a potential trend reversal.
I've marked the pivot points for you on the chart for better clarity.
Additionally, it's crucial to keep an eye on current economic data and news releases as part of your fundamental analysis.
I meticulously prepare these analyses for you, and I sincerely appreciate your support through likes. Every like from you is my biggest motivation to continue sharing my analyses.
I’m truly grateful for each of you—love to all my followers💙💙💙

CHF-JPY Local Long! Buy!
Hello,Traders!
CHF-JPY is trading in a strong
Uptrend and the pair made a
Bullish breakout from the bullish
Triangle pattern and is now seems
To be consolidating above the
Support cluster around 180.740
So we are bullish biased and
We will be expecting a further
Bullish move up on Monday
Buy!
Comment and subscribe to help us grow!
Check out other forecasts below too!
Disclosure: I am part of Trade Nation's Influencer program and receive a monthly fee for using their TradingView charts in my analysis.

Gold Extends Decline Amid Easing Safe-Haven DemandGold continues its downward trajectory as safe-haven sentiment weakens. Geopolitical tensions between Iran and Israel appear to be easing following a ceasefire agreement, reducing the perceived need for defensive assets such as gold.
At the same time, the market is reassessing its expectations regarding U.S. monetary policy. With the Federal Reserve unlikely to cut interest rates in the near term—and concerns about inflation resurfacing due to potential tax policy changes under former President Donald Trump—gold is facing a dual source of short-term pressure.
Investor sentiment is currently shifting toward riskier assets, as capital flows increasingly favor equities over gold. This risk-on environment has further eroded demand for traditional safe havens.
From a technical perspective, gold failed to break above the $3,350 level, signaling waning bullish momentum. This may indicate the onset of a short-term corrective phase.
On the political front, recent remarks by Donald Trump—including the possibility of a long-term diplomatic solution with Iran and discussions around replacing Fed Chair Jerome Powell—have introduced additional volatility into global financial markets.
Furthermore, according to market data I have reviewed, gold sales in the second quarter have shown signs of slowing. Buyers are becoming more cautious amid elevated price levels, while many investors are choosing to take profits, contributing to an increasingly two-sided market dynamic.
Despite this, I maintain a positive medium- to long-term outlook for gold. The U.S. dollar is currently at its weakest point in three and a half years, offering significant support. Notably, central banks managing over $5 trillion in assets are planning to increase their gold reserves within the next one to two years—a strong structural driver for gold’s long-term growth.
In summary, I believe gold is currently experiencing short-term corrective pressure due to a combination of geopolitical developments, interest rate expectations, and shifting investor sentiment. However, its long-term outlook remains solid, supported by a weaker dollar, global macroeconomic risks, and continued central bank accumulation.

USD-CHF Will Fall! Sell!
Hello,Traders!
USD-CHF keeps falling down
And the pair broke the key
Horizontal level of 0.8090
Decisively so we are bearish
Biased and we will be expecting
A further move down next week
Sell!
Comment and subscribe to help us grow!
Check out other forecasts below too!
Disclosure: I am part of Trade Nation's Influencer program and receive a monthly fee for using their TradingView charts in my analysis.

DXY STRONG DOWNTREND CONTINUES|SHORT|
✅DXY is going down currently
In a strong downtrend and the index
Broke the key structure level of 98.000
Which is now a resistance,
And after the pullback
And retest, I think the price
Will go further down next week
SHORT🔥
✅Like and subscribe to never miss a new idea!✅
Disclosure: I am part of Trade Nation's Influencer program and receive a monthly fee for using their TradingView charts in my analysis.

Gold may bounce up from support line of channel to 3330 pointsHello traders, I want share with you my opinion about Gold. Previously, the price broke out of a symmetrical triangle and moved confidently toward the seller zone. However, it failed to consolidate there and formed a downward channel, where price action has remained since. The movement inside this channel has been consistent, respecting both the resistance and support lines. After reaching the lower boundary, the price bounced up and approached the resistance area (3290 - 3300), which now acts as a key short-term obstacle. This zone was tested multiple times and served as support earlier, making it a strong technical level. Currently, the price is trading just below this zone and forming a base for the next move. I expect a possible retest of the support line of the downward channel, which may provide the impulse needed for a new upward move. In my opinion, the price will rebound from the bottom of the channel and start to grow toward the current resistance level at 3300. If this level is broken and confirmed via a retest, I expect continued movement toward the channel’s upper resistance line. That’s why I set my TP 1 at 3330 points, right near the resistance line of the channel. Please share this idea with your friends and click Boost 🚀
Disclaimer: As part of ThinkMarkets’ Influencer Program, I am sponsored to share and publish their charts in my analysis.

GOLD 4H: not all that glitters is bullish...The 4H chart shows a clean descending triangle breakdown. Price failed to reclaim the trendline and was rejected under both MA50 and MA200. The bounce into 3325–3340 was absorbed — classic liquidity sweep and fade. Volume confirms bearish control.
Technically, the breakdown below 3320 opens the way toward $3293 (1.0 Fibo), $3250 (1.272 extension), and final target at $3195 (1.618), where buyers might step in. RSI supports the continuation without signs of reversal. Structure broke — and the market is telling us where it's heading.
Tactical plan:
— Entry at market or on a retest of $3325–3335
— Targets: $3293 → $3250 → $3195
— Stop: above $3340 (above MA50 and broken trendline)
When gold looks shiny, smart traders look deeper. This breakout isn’t golden — it’s a trap for late bulls.

You like expulsive moves?Price is squeezing into the falling wedge against the 10.2 - 10.5 support zone. I think is going to break out soon. SL Triggers if a daily candles CLOSES below the support zone as shown.

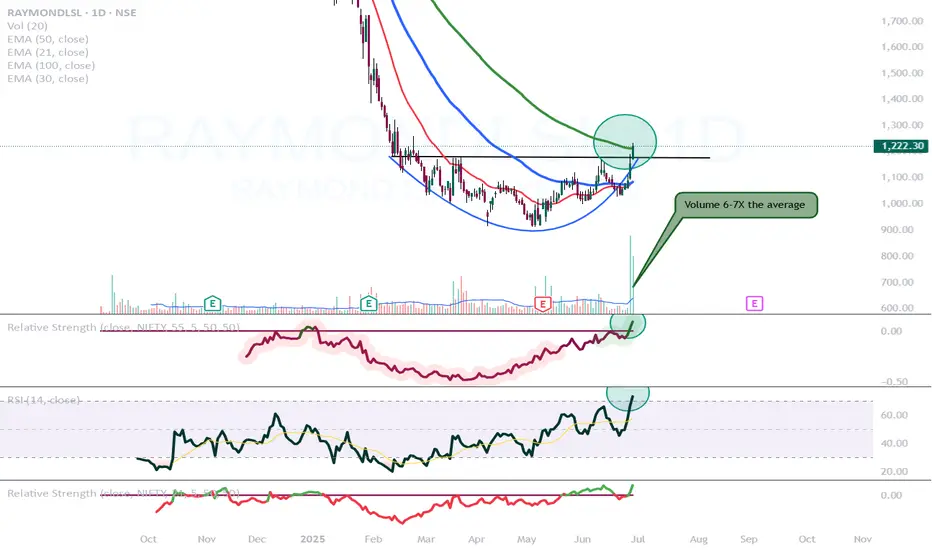
Raymond Lifestyle is looking good!NSE:RAYMONDLSL
- After a 5 month long consolidation now breaking out.
- This is looking like a stage 2 breakout.
- Relative strength turned positive.
- RSI is above 70 indicating very high momentum
- Volume is also very good on the break out candle. Also we can observe that volume is higher on the green candles and lower on the red ones.
- Today it closed above its 100 day exponential moving average as well.
EUR/JPY Analysis – Flag Breakout Signals Further UpsideHello Traders,
It's been a while. I trust you are good.
Kindly find below my analysis of EURJPY currency pair.
Overview:
EUR/JPY has been consolidating within a bullish flag pattern, characterized by lower highs and lower lows over the past few trading sessions. Price action has now broken above the flag’s resistance, indicating a possible continuation of the broader bullish trend.
Idea:
The breakout above the bullish flag suggests that bulls are regaining control. Price is currently hovering around 169.370, having just cleared the wedge’s resistance line.
Key levels to monitor:
1. Support Zone: Around 169.200–169.300
2. Resistance Level: 169.699
Trade setup:
Entry: On a successful breakout or break and retest of 169.200–169.300.
Stop Loss: Below 168.816 (beneath the flag's support and recent swing low).
Targets: TP1: 169.699, TP2: 170.000–170.200
Conclusion:
EUR/JPY has broken out of a bullish flag pattern, signaling momentum shift in favor of buyers. If price sustains above the breakout zone or clears 169.699 resistance, we may see an extended rally toward the 170.000 mark. Trade with caution.
Cheers and happy trading.

USD_CHF BEARISH BREAKOUT|SHORT|
✅USD_CHF broke the key structure level of 0.8050
While trading in a strong downtrend
Which makes me bearish
And I think that after the retest of the broken level is complete
A bearish continuation will follow
SHORT🔥
✅Like and subscribe to never miss a new idea!✅
Disclosure: I am part of Trade Nation's Influencer program and receive a monthly fee for using their TradingView charts in my analysis.

DOW JONES Will Keep Growing! Buy!
Hello,Traders!
US30 is trading in an
Uptrend and the index broke
The key horizontal level
Around 43,200 and the
Breakout is confirmed so
We are bullish biased
And we will be expecting a
Further bullish move up
Buy!
Comment and subscribe to help us grow!
Check out other forecasts below too!
Disclosure: I am part of Trade Nation's Influencer program and receive a monthly fee for using their TradingView charts in my analysis.

XPTUSD 1W:While Everyone Watches Gold, Platinum Quietly Wakes UpGold gets the headlines — but platinum just broke two years of silence with a clean, high-volume breakout from a symmetrical triangle on the weekly chart. And this isn’t noise — this is the structural shift traders wait for.
Price has been coiled inside a compressing wedge since early 2022. Equal highs. Equal lows. Stop hunts both ways. The classic “shake out before take off.” Now? The breakout is in. And the weekly candle closed above resistance with volume confirmation. Oh, and while we're at it — the 50MA just crossed above the 200MA, signaling a long-term trend reversal.
Target? Measure the triangle height: ~398 points. That projects a breakout target of 1440 USD, which aligns perfectly with previous institutional rejection zones.
But this isn’t just about the chart.
🔹 South Africa, the top global supplier, is struggling with energy and production cuts;
🔹 The Fed is pausing rate hikes — the dollar weakens, metals rally;
🔹 Demand from hydrogen tech, clean energy, and industrial catalysts is on the rise.
Translation? Smart money has been accumulating. The move from 965–1070 was just the ignition. The drive hasn’t started yet.
So while everyone fights over gold highs, platinum sits at the base of a move no one's prepared for — except those who know how accumulation ends.
🧭 Key support: 965–985
📍 Resistance zone: 1150–1180
🎯 Measured target: 1440+

US100 BULLISH BREAKOUT|LONG|
✅US100 is going up
Now and the index made a bullish
Breakout of the key horizontal
Level of 22,222 and the breakout
Is confirmed so we are bullish
Biased and we will be expecting
A further bullish move up
LONG🚀
✅Like and subscribe to never miss a new idea!✅
Disclosure: I am part of Trade Nation's Influencer program and receive a monthly fee for using their TradingView charts in my analysis.

ARKK: when a breakout isn’t just a breakout-it’s a runway to $91On the weekly chart, ARKK has broken out of a long-standing ascending channel, ending a year-long consolidation phase. The breakout above $71.40, with a confident close and rising volume, signals a transition from accumulation to expansion. The move came right after a golden cross (MA50 crossing MA200), further confirming institutional interest. Price has already cleared the 0.5 and 0.618 Fibonacci retracements — and the 1.618 extension points to $91.40 as the next technical target.
Momentum indicators like MACD and stochastic remain bullish with room to run. Volume profile shows low supply above $75, which could fuel an acceleration toward the target zone.
Fundamentally, ARKK remains a high-beta, high-risk vehicle — but one with focus. The ETF is positioned around next-gen tech: AI, robotics, biotech, and automation. Assets under management now exceed $9.3B with +$1.1B net inflow in 2025. YTD return stands at 37%, and its top holdings (TSLA, NVDA, COIN) are back in favor. This isn’t just a bet on innovation — it’s diversified exposure to a full-blown tech rally.
Tactical setup:
— Entry: market $69.50 or on retest
— Target: $80.21 (1.272), $91.40 (1.618 Fibo)
Sometimes a breakout is just technical. But when there’s volume, a golden cross, and billions backing it — it’s a signal to buckle up.

Anatomy of a Breakout: How to Spot It Before It Fakes You OutFew things in trading are as appealing as a breakout. The chart tightens, volume starts to stir, headlines align, your alerts start going off , and suddenly — boom! Price explodes above resistance. Your adrenaline spikes and you pop open that long.
But just as often, that breakout turns out to be nothing more than an expensive head fake. Price stalls. Sellers swoop in. Your stop gets clipped. And now you’re sitting there, blinking at your screen, “Welp… that was quick.”
Welcome to the bittersweet world of breakouts — where opportunity and deception dance like partners at a high-stakes poker table.
📢 What Is a Breakout, Really?
Let’s get the basics out of the way: A breakout happens when price pushes beyond a key support or resistance level that’s been holding for a while.
That level could be a previous high, a consolidation range, a trendline, or a psychological number that traders obsess over because humans love round numbers (did someone say Bitcoin BITSTAMP:BTCUSD at $120,000 ?).
The logic is simple: Once price clears a well-watched level, trapped shorts have to cover, new longs pile in, and momentum feeds on itself. That’s the dream scenario.
But markets aren’t always that generous. For every clean breakout, there are a few fakeouts lurking — luring in overeager traders with the promise of easy money before slamming the door shut.
⚠️ Why Breakouts May Fail
If breakouts were easy, we’d all be rich. The problem is that breakouts attract a special kind of crowd: late-to-the-party momentum chasers, breakout algorithm bots, and retail traders who read one blog post about technical analysis.
The moment price nudges above resistance, FOMO kicks in. Volume surges. But if the move isn’t backed by genuine institutional buying (you need lots of billions to move the needle nowadays), it quickly becomes what seasoned traders call a “liquidity vacuum” — thin air where the only participants are you, a few equally optimistic Reddit threads, and market makers more than happy to take the other side.
Sometimes breakouts fail because:
The move lacked volume confirmation.
Macro headlines shifted mid-breakout.
A key level was front-run, and the real buyers have already taken profit.
It was a deliberate trap set by larger players to hunt stops before reversing.
Or — more often — the market just needed an excuse to shake out weak hands before resuming the actual move later.
🍸 Volume: The Truth Serum
Let’s be very clear: Breakouts without volume are like dating profiles without photos — you should be suspicious.
When real breakouts occur, you’ll usually see strong accompanying volume. That’s your proof that big players — funds, institutions, serious money — are committing to the move. No volume? Maybe the summer vibes are already here .
Smart traders wait for confirmation:
Is volume above average relative to recent sessions?
Is price holding above the breakout level after the initial pop?
Are follow-through candles printing convincingly?
Are we seeing continuation across related sectors or instruments?
Without these signs, that breakout candle may just be a cruel joke.
🤯 Breakout Psychology
Breakouts prey on two of the most dangerous emotions in trading: greed and urgency. The market whispers, “If you don’t get in now, you’ll miss it.”
This is where breakout psychology becomes more dangerous than the chart itself. Once a breakout happens, most traders are no longer analyzing — they’re reacting. They buy late, set tight stops below the breakout level, and become easy prey for stop-hunting algorithms.
✨ Types of Breakouts
Not all breakouts are created equal. Here’s the lineup you should be watching for:
Clean Breakouts:
The rarest and most beautiful. Strong move, high volume, sustained momentum. You’ll know it when you see it — or after you’ve hesitated and missed it.
Fakeouts (a.k.a. False Breakouts):
Price nudges just past resistance, triggers breakout orders, then swiftly reverses. Designed to shake out breakout traders before resuming the original trend.
Break-and-Retest Setups:
Often the highest-probability trades. Price breaks out, then pulls back to retest the former resistance (now support). If buyers defend this retest, you’ve got confirmation.
News-Driven Breakouts:
Triggered by earnings, economic data, or political events. Volatile, fast, and often unsustainable unless backed by real fundamental shifts.
📈 The “Pre-Breakout Tell”: Reading the Tape
Good breakout traders aren’t just watching levels — they’re watching how price behaves near those levels in advance.
Tight consolidation? Lower volatility into resistance? Declining volume as price grinds higher? That often signals an impending breakout as supply dries up.
Conversely, choppy action with large wicks and erratic volume often signals indecision — ripe conditions for failed breakouts and fakeouts.
Tape-reading matters. The cleaner the structure before the breakout, the better your odds.
💰 Breakout Traders Need Thick Skin
Even with perfect analysis, breakout trading requires accepting that many will fail. That’s the game. Your job isn’t to nail every breakout — it’s to size your positions properly , keep losses small when faked out, and let the clean breakouts run when you catch one.
Stop-loss discipline is everything. Breakouts are binary events: you’re either right quickly, or you’re cutting the trade quickly. There’s no room for “maybe it’ll come back.”
The most painful breakouts are the ones that fake out, stop you, then continue in your original direction. Every breakout trader has lived that nightmare. Accept it. Build it into your risk plan.
👉 Takeaway: Prepare the Setup, Anticipate the Fakeout
Breakouts will always be part of every trader’s playbook. But they require discipline, experience, and an iron stomach. The market loves to tempt you with early signals — your job is to separate signal from noise.
Pro tip: Start your day by checking the Economic calendar and browsing the latest news — staying informed (and witty) helps you build better context for smarter decisions.
So before you chase that next breakout candle, ask yourself:
Is volume there?
Is the broader market supportive?
Have I managed my risk before clicking buy?
Because in trading, the only thing worse than missing a breakout… is getting faked out and blowing up your account chasing it.
Now over to you : Are you a breakout trader or a fakeout victim? Share your best (or worst) breakout stories — we’ve all been there.

GBP_USD WILL KEEP GROWING|LONG|
✅GBP_USD broke the key structure level of 1.3620
While trading in an local uptrend
Which makes me bullish biased
And I think that after the retest of the broken level is complete
A rebound and bullish continuation will follow
LONG🚀
✅Like and subscribe to never miss a new idea!✅
Disclosure: I am part of Trade Nation's Influencer program and receive a monthly fee for using their TradingView charts in my analysis.

EUR_USD BULLISH BREAKOUT|LONG|
✅EUR_USD is going up
Now and the pair made a bullish
Breakout of the key horizontal
Level of 1.1630 and the breakout
Is confirmed so we are bullish
Biased and we will be expecting
A further bullish move up
LONG🚀
✅Like and subscribe to never miss a new idea!✅
Disclosure: I am part of Trade Nation's Influencer program and receive a monthly fee for using their TradingView charts in my analysis.

Nasdaq 100 Near Breakout – Eyes on 22,200 ResistanceThe Nasdaq 100 is approaching a critical technical level at 22,200. This resistance marks the upper boundary of recent consolidation and aligns with prior rejection zones. A clean break above this threshold could trigger a sharp upside move, possibly propelling the index into uncharted territory.
Geopolitical tensions have eased, and the dollar’s renewed weakness is supporting risk appetite, particularly in the tech-heavy Nasdaq. Strong earnings from key sectors are reinforcing bullish sentiment, with investors increasingly pricing in a favorable macro backdrop.
Technically, momentum is building. Price action has formed a series of higher lows, and buying pressure is intensifying near resistance. A breakout above 22,200 could ignite a strong rally, driven by stop orders and fresh bullish entries.
That said, traders should remain cautious. While the breakout setup is promising, a retracement toward support zones—such as 21,500 or the 20-day moving average—remains possible, especially if upcoming inflation or macro data disappoints.
For now, the 22,200 level remains the key to watch. A daily close above this level would shift the bias clearly higher, confirming breakout strength and potentially accelerating gains toward 22,800 or beyond.

SOXL 1D — With a base like this, the ride’s worth itOn the daily chart of SOXL, since early March, a textbook inverse head and shoulders pattern has formed and is now in its activation phase. The left shoulder sits at $16.67, the head at $7.21, and the right shoulder at $15.11. The symmetry is classic, with volume stabilization and a narrowing range — all the elements are in place.
The key moment was the breakout through the descending daily trendline around $19.00. Price didn’t just pierce the level — it held above it, signaling a phase shift. There was an attempt to break through the 0.5 Fibonacci level at $19.60, which led to a pullback — not on heavy selling, but on decreasing volume. This wasn’t a rejection, it was a pause.
This pullback serves as a retest of the breakout zone and the 20-day moving average. The overall structure remains bullish: price stays above all key EMAs and MAs, RSI climbs past 60, and the candlestick structure is stable. Volume rises during up moves and fades during pullbacks — classic signs of reaccumulation.
The measured target from the pattern is $32.00, calculated from the head-to-neckline height projected from the breakout point. As long as price holds above $18.40, the setup remains intact. A break above $19.60 with confirmation would open the door to acceleration.
This isn’t a momentum play — it’s a setup months in the making. The structure is there, the confirmation is there, and most importantly — the price behavior makes sense. With a base like this, the ride ahead looks worth taking.

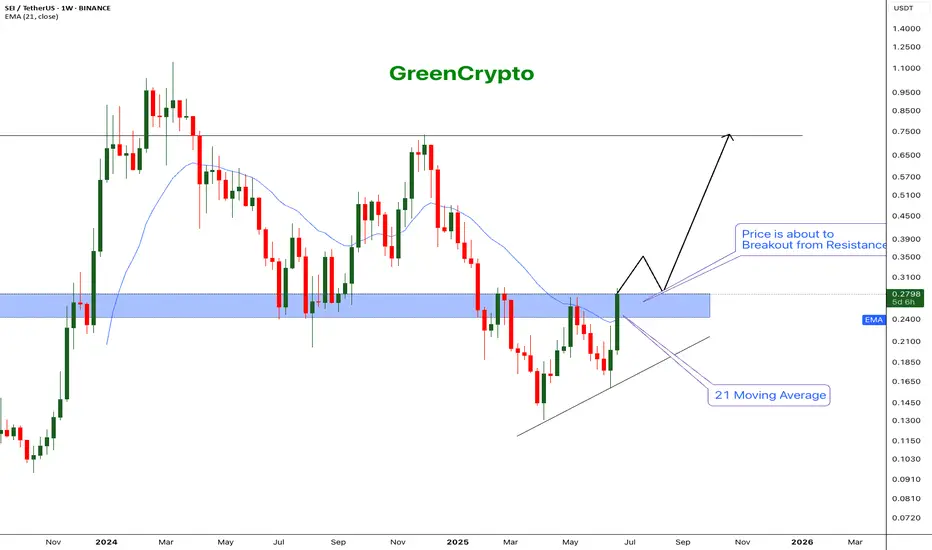
SEI - The next big runner$BINANCE:SEI/USDT (1W CHART) Technical Analysis Update
SEI is currently trading at $0.2785 and showing overall bullish sentiment
Price successfully breached the 21 EMA and now price is trading near one of the major resistance zone.
If the weekly candles closes above the resistance then we can expect further bullish momentum.
I'm expecting the price to easily break the resistance and hit the next major resistanc e around 0.75
Entry: After close above resistance (0.285)
StopLoss: 0.18
TakeProfit 1: 0.3506
TakeProfit 2: 0.4962
TakeProfit 3: 0.7367
Don't forget to keep stoploss!
Follow our TradingView account for more technical analysis updates. | Like, share, and comment your thoughts.
Cheers
GreenCrypto