Xrp - All Structure Is Finally Broken!Xrp ( CRYPTO:XRPUSD ) is heading for two digits:
Click chart above to see the detailed analysis👆🏻
Over the past three months alone, Xrp rallied about +550%, perfectly following the expected triangle continuation breakout. Since there is literally no resistance above the current levels, it is quite likely that Xrp will now rally all the way up to the psychological two digits.
Levels to watch: $10.0
Keep your long term vision,
Philip (BasicTrading)
Breakout!

KAVA ANALYSIS📊 #KAVA Analysis
✅There is a formation of Descending triangle pattern on 1 day chart with a breakout 🧐
Pattern signals potential bullish movement incoming after a consolidation
👀Current Price: $0.5050
🚀 Target Price: $0.5600
⚡️What to do ?
👀Keep an eye on #KAVA price action and volume. We can trade according to the chart and make some profits⚡️⚡️
#KAVA #Cryptocurrency #TechnicalAnalysis #DYOR

UJ Prepping Falling Wedge Breakout To Start 2025?FX:USDJPY starts 2025 in what appears to be a Falling Wedge, but following the 50% Fibonacci Retracement based from the Low @ 148.639 to start December 2024 to the High @ 158.874 last month, Price seems to may be ready to setup for a Bullish Break of this Pattern.
To see if FX:USDJPY has truly Broken Out of the Falling Wedge, here are some signals:
1) While price travels lower in the Falling Wedge, we can see Volume picks up the lower price goes
2) The Breaking Candle following the 2nd 50% Retracement touch generates a good amount of Bullish Volume compared to the similarly sized printed Bullish Candle following the 1st 50% Retracement touch (both candles marked in yellow to compare)
3) Following this Break, we see RSI Break above the 50 mark moving into Bullish territory.
** Buy Opportunities will come if Price successfully retest the Break of the Falling Resistance and finds Support.
-- Beware of a False Break if Price decides to fall back down Below the Falling Resistance too soon before a legitimate test.

Leap Ahead with a Regression Breakout on Crude OilThe Leap Trading Competition: Your Chance to Shine
TradingView’s “The Leap” Trading Competition presents a unique opportunity for traders to put their futures trading skills to the test. This competition allows participants to trade select CME Group futures contracts, including Crude Oil (CL) and Micro Crude Oil (MCL), giving traders access to one of the most actively traded commodities in the world.
Register and compete in "The Leap" here: TradingView Competition Registration .
This article breaks down a structured trade idea using linear regression breakouts, Fibonacci retracements, and UnFilled Orders (UFOs) to identify a long setup in Crude Oil Futures. Hopefully, this structured approach aligns with the competition’s requirements and gives traders a strong trade plan to consider. Best of luck to all participants.
Spotting the Opportunity: A Regression Breakout in CL Futures
Trend reversals often present strong trading opportunities. One way to detect these shifts is by analyzing linear regression channels—a statistical tool that identifies the general price trend over a set period.
In this case, a 4-hour CL chart shows that price has violated the upper boundary of a downward-sloping regression channel, suggesting the potential start of an uptrend. When such a breakout aligns with key Fibonacci retracement levels and existing UnFilled Orders (UFOs), traders may gain a potential extra edge in executing a structured trade plan.
The Trade Setup: Combining Fibonacci and a Regression Channel
This trade plan incorporates multiple factors to define an entry, stop loss, and target:
o Entry Zone:
An entry or pullback to the 50%-61.8% Fibonacci retracement area, between 74.60 and 73.14, provides a reasonable long entry.
o Stop Loss:
Placed below 73.14 to ensure a minimum 3:1 reward-to-risk ratio.
o Profit-Taking Strategy:
First target at 76.05 (38.2% Fibonacci level)
Second target at 77.86 (23.6% Fibonacci level)
Final target at 78.71, aligning with a key UFO resistance level
This approach locks in profits along the way while allowing traders to capitalize on an extended move toward the final resistance zone.
Contract Specifications and Margin Considerations
Understanding contract specifications and margin requirements is essential when trading futures. Below are the key details for CL and MCL:
o Crude Oil Futures (CL) Contract Details
Full contract specs: CL Contract Specifications – CME Group
Tick size: 0.01 per barrel ($10 per tick)
Margin requirements vary based on market conditions and broker requirements. Currently set around $5,800.
o Micro WTI Crude Oil Futures (MCL) Contract Details
Full contract specs: MCL Contract Specifications – CME Group
Tick size: 0.01 per barrel ($1 per tick)
Lower margin requirements for more flexible risk control. Currently set around $580.
Choosing between CL and MCL depends on risk tolerance and account size. MCL provides more flexibility for smaller accounts, while CL offers higher liquidity and contract value.
Execution and Market Conditions
To maximize trade efficiency, conservative traders could wait for a proper price action into the entry zone and confirm the setup using momentum indicators and/or volume trends.
Key Considerations Before Entering
Ensure price reaches the 50%-61.8% Fibonacci retracement zone before executing the trade
Look for confirmation signals such as increased volume, candlestick formations, or additional support zones
Be patient—forcing a trade without confirmation increases risk exposure
Final Thoughts
This Crude Oil Futures trade setup integrates multiple confluences—a regression breakout, Fibonacci retracements, and UFO resistance—to create a structured trade plan with defined risk management.
For traders participating in The Leap Trading Competition, this approach emphasizes disciplined execution, dynamic risk management, and a structured scaling-out strategy, all essential components for long-term success.
When charting futures, the data provided could be delayed. Traders working with the ticker symbols discussed in this idea may prefer to use CME Group real-time data plan on TradingView: www.tradingview.com - This consideration is particularly important for shorter-term traders, whereas it may be less critical for those focused on longer-term trading strategies.
General Disclaimer:
The trade ideas presented herein are solely for illustrative purposes forming a part of a case study intended to demonstrate key principles in risk management within the context of the specific market scenarios discussed. These ideas are not to be interpreted as investment recommendations or financial advice. They do not endorse or promote any specific trading strategies, financial products, or services. The information provided is based on data believed to be reliable; however, its accuracy or completeness cannot be guaranteed. Trading in financial markets involves risks, including the potential loss of principal. Each individual should conduct their own research and consult with professional financial advisors before making any investment decisions. The author or publisher of this content bears no responsibility for any actions taken based on the information provided or for any resultant financial or other losses.

Can Bulls Flip GU "On Its Head" @ 38.2% Level?Last week we saw FX:GBPUSD attempt to Break Above the 1.25 Resistance Zone that its been struggling with since November 2024 and was sent back down underneath following the Fed's decision to Hold Interest Rates.
We can see that Price so far seems to be following a Head & Shoulders layout where Price now is declining down to the Low that formed the "Left Shoulder" @ ( 1.23745 - 1.23518 )
What makes this Price Range so favorable is that if you take the Fib Retracement Tool from the Low of the "Head" @ 1.20991 to the 2nd Touch of the "Neckline" @ 1.25232, the 38.2 % Retracement Level lands right at the potential Support level of the "Left Shoulder"
-If Price finds Support at this level, we can suspect the Low to form the "Right Shoulder" then for Price to work back up to the "Neckline" for a Break and Close for Confirmation of Pattern to then look for more Buying Opportunities!
*Price Breaking and Closing the Neckline, signaling Confirmation of Pattern, will deliver a 90% Success Rate to the expected Bullish outcome.
*Watch for Increase in Volume after Price is Successfully Supported by Low of Left Shoulder and RSI to maintain Above 50!
Fundamentally,
GBP:
Final Manufacturing PMI - Monday
Final Services PMI - Wednesday
Construction PMI/Bank Rate - Thursday
USD:
ISM Manufacturing PMI - Monday
JOLTS - Tuesday
ADP Non-Farm Employment/ISM Services PMI - Wednesday
Unemployment Claims - Thursday
AVG Hourly Earnings/ADP Non-Farm Employment/Unemployment Rate - Friday

GBPJPY - Change of CharacterHello Traders !
The GBPJPY failed to create a new higher high !
The price broke the last higher low (change of character).
So, I expect a bearish move📉
_____________
TARGET: 190.820🎯

MANTA/USDT: Breakout Alert: 60-70% Upside Incoming!🚀 Hey Traders! MANTA Breakout Incoming! 👋
If this setup gets you hyped, smash that 👍 and hit Follow for high-quality trade setups that deliver real results! 💹🔥
MANTA is looking bullish and ready to explode! 📈 It’s breaking out of a falling wedge on the 4-hour timeframe, signaling a potential 60-70% upside move. Now’s the time to long and add on dips!
🔹 Entry Range: CMP – Add more up to $0.63
🎯 Targets:
✅ Target 1: $0.76
✅ Target 2: $0.85
✅ Target 3: $0.94
✅ Target 4: $1.10
🛡 Stop Loss (SL): $0.59
⚙️ Leverage: Use low leverage (Max 5x)
💬 Your Thoughts?
Are you bullish on MANTA’s breakout? Drop your analysis, predictions, or strategies in the comments! Let’s ride this wave and lock in those gains together! 💰🔥

XVG - on the "VERGE" of breaking out!Hello TradingView Family / Fellow Traders. This is Richard, also known as theSignalyst.
📈 XVG has been in a correction phase trading within the falling blue channels.
🏹As XVG approaches the lower bound of the channels, which lines up perfectly with the demand zone marked in red, it would be an attractive zone (at least for me) to look for longs.
🏹On the other hand, for the bulls to take over long-term, a break above the last major high marked in blue around $0.015 is needed.
For now, we wait! ⏱️
📚 Always follow your trading plan regarding entry, risk management, and trade management.
Good luck!
All Strategies Are Good; If Managed Properly!
~Rich

SOUTHBANK - BUY SOUTHBANK - BUY NOW
Key points :
South Indian Bank strong Fundamentals .
Stock PE - 5.47
Industry PE - 10.8
Stock Price Trade at Below Book Value ..
Company Price - Possible to Double
Technical :
Monthly - Take Support
Day - Symmetrical Triangle Pattern Breakout
Entry - 25.45 Rs
Target - 35.55 Rs
Stoploss - 21 Rs
Expected - 39 %
This is Only for My Trade Setup . Dont follow Blindly . Take Educational Purpose Only .
We not any responsiblities for Profit and loss ..
Thank You . Happy Trading ..

JASMY/USDT: BREAKOUT ALERT!!🚀 Hey Traders! Ready to Catch the JASMY Breakout? 👋
If this setup excites you, smash that 👍 and hit Follow for top-tier trade ideas that deliver real results! 💹🔥
JASMY is looking strong and bullish! 📈 It has broken out of a falling wedge on the 4-hour timeframe and successfully retested the breakout level. Now, it’s primed for a major move! Long some here and add on dips.
🔹 Entry Range: $0.031 - $0.033
🎯 Targets:
✅ Target 1: $0.038
✅ Target 2: $0.046
✅ Target 3: $0.054
✅ Target 4: $0.060
🛡 Stop Loss (SL): $0.0282
⚙️ Leverage: Use low leverage (Max 5x)
💬 Your Thoughts?
Are you bullish on JASMY’s breakout potential? Drop your analysis, predictions, or strategies in the comments! Let’s ride this wave and secure those gains together! 💰🔥

GOLD WILL KEEP GROWING|LONG|
✅GOLD is trading in a
Strong uptrend along the
Rising support line and the price
Is now making a bullish breakout
Of the key horizontal level
Of 2786$ which reinforces our
Bullish bias and makes us expect
A further bullish move up
LONG🚀
✅Like and subscribe to never miss a new idea!✅

Meta Platforms - The Breakout Rally To $1.000!Meta Platforms ( NASDAQ:META ) is about to break out:
Click chart above to see the detailed analysis👆🏻
Ever since Meta Platforms - formerly known as Facebook - was listed on the Nasdaq, this stock has been creating new all time highs over and over again. Also over the past couple of months, momentum was pretty strong and a triangle breakout seems inevitable.
Levels to watch: $650, $1.000
Keep your long term vision,
Philip (BasicTrading)

USD-CHF Will Keep Growing! Buy!
Hello,Traders!
USD-CHF broke the falling
Resistance line, made a
Retest and is going up now
So we are locally bullish baised
And we will be expecting
A further bullish continuation
Buy!
Comment and subscribe to help us grow!
Check out other forecasts below too!

CELR/USDT: 80%+ PROFIT POTENTIAL SETUP!!🚀 Hey Traders! Ready to Catch the CELR Breakout? 👋
If this setup excites you, smash that 👍 and hit Follow for high-quality trade ideas that actually deliver! 💹🔥
CELR is looking primed for a breakout! 📈 It's breaking out from a falling wedge pattern on the 6-hour timeframe, signaling a potential 80-90% upside move! Now’s the time to long and add on dips.
🔹 Entry Range: $0.0146 - $0.0154
🎯 Targets:
✅ Target 1: $0.018
✅ Target 2: $0.022
✅ Target 3: $0.025
✅ Target 4: $0.028
🛡 Stop Loss (SL): $0.0135
⚙️ Leverage: Use low leverage (Max 5x)
💬 What’s Your Take?
Are you bullish on CELR’s breakout potential? Drop your analysis, predictions, or strategies in the comments! Let’s ride this wave and secure those gains together! 💰🔥

EURJPY - Change of CharacterHello Traders !
The EURJPY failed to create a new higher high !
Currently, The last higher low is broken (change of character).
So, I expect a bearish move📉
_____________
TARGET: 160.300🎯

XPR looks to be setting up for a big move to the upside soon!The XPR chart (not to be confused with XRP) is looking fantastic right now, and the upper wedge that the price is currently trading in closely resembles the lower wedge from the initial breakout. The Gaussian channel is cinching up as the wedge runs out of real estate. As a speculative play, XPR could very well make a move similar to the one XCN recently made, generating a 5X return—or perhaps even a 10X if enough momentum rolls in.
Good luck, and always use a stop-loss!

NZD-JPY Bearish Breakout! Sell!
Hello, Traders!
NZD-JPY is going down
Now and broke the key
Horizontal level of 87.700
Which is now a resistance
And the breakout is confirmed
So we are locally bearish biased
Now and we will be expecting a
Further bearish move down
Sell!
Comment and subscribe to help us grow!
Check out other forecasts below too!

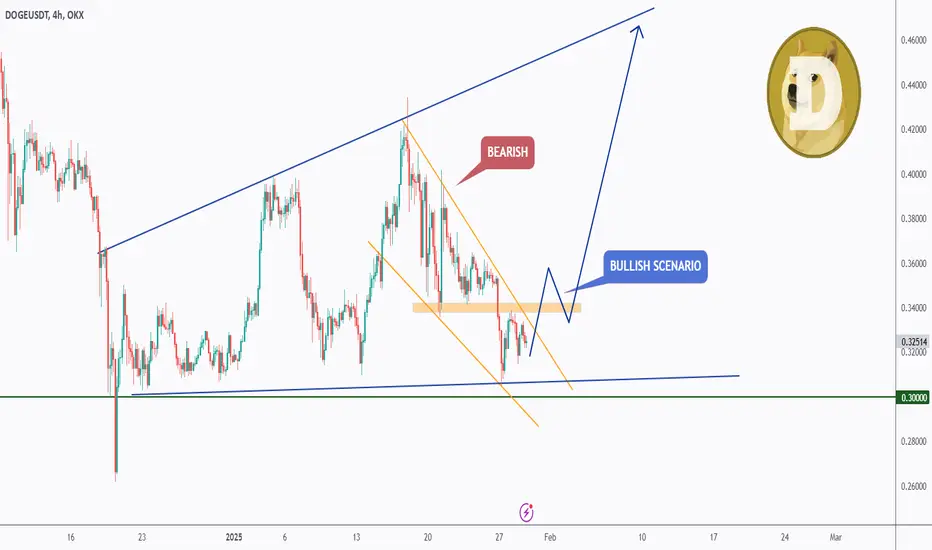
DOGE - DOGS vs BEARSHello TradingView Family / Fellow Traders. This is Richard, also known as theSignalyst.
📈 DOGE has been in a correction phase trading within the falling wedge pattern marked in orange.
🏹For the DOGS (bulls) to take over, and start the next impulse movement towards the upper bound of the blue wedge, a break above the last high marked in orange is needed.
For now, we wait! ⏱️
📚 Always follow your trading plan regarding entry, risk management, and trade management.
Good luck!
All Strategies Are Good; If Managed Properly!
~Rich
XYO Coin: Ready to Blast Past 3 Cents XYO is at a crossroads. If it breaks above 2.5 cents, we could see it soar to 3 cents, maybe even 10! But, if it dips under 1.9 cents, watch out for a fall.
Kris/Mindbloome Exchange
Trade Smarter Live Better

ABT Strong Bullish Momentum – Move Toward $127.00 ExpectedNYSE:ABT is exhibiting strong bullish momentum, supported by a significant breakout above prior consolidation levels. The alignment of moving averages and the strength of recent price action suggest further upside potential, with the next logical target at $127.00.
The price has surged above key moving averages, including the 50 EMA, 100 EMA, and 200 EMA, all of which are trending upward. This confirms sustained momentum and further supports the bullish case.

JKCEMENTJKCEMENT given trendline breakout. It has posted v decent result above street's expectations. There is high probability that market may turn its trend which is in favor of new trend. Keep it on radar.

Earnings BreakoutI love the earnings season. During earnings season we see great setups that are tradable almost every day.
This is also the case today with RCL . Breakout under enormous volume and high relative strength. NYSE:RCL

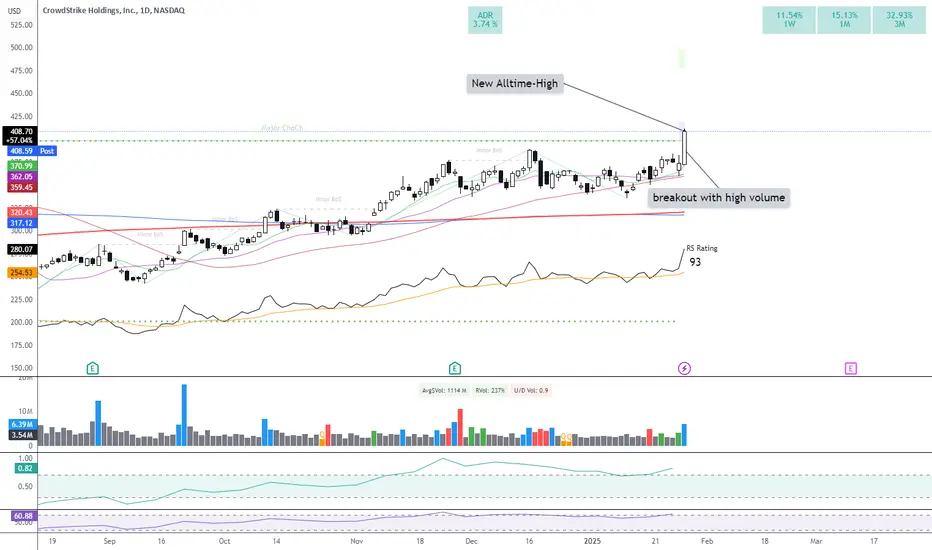
Beautiful breakout CRWD breaks perfectly out of a range and thus marks a new all-time high.
CRWD has been moving in a range with low volume since November 2024. Today is a perfect breakout. The breakout was confirmed under conspicuously high volume.
CRWD is also a top growth candidate in the hot cybersecurity sector. NASDAQ:CRWD