XAUUSD H4 Outlook — 16 June 2025👋 Hello team, here’s where we stand before the upcoming key week:
🔎 The Narrative
Gold remains in bullish control after weeks of controlled expansion.
The clean breakout above previous major highs triggered liquidity resets that cleared significant weak-handed positions.
Last week’s sweep into 3447 activated premium liquidity, trapping late buyers at the edge of impulsive highs. But the game is far from over — smart money continues to rotate liquidity at these extreme levels, using premium expansion to build further trap pockets both above and below.
Behind this technical expansion, macro tensions continue to fuel underlying gold demand. Geopolitical uncertainties remain elevated with the Middle East escalation risk growing, while recent Fed positioning keeps rate path expectations flexible.
The upcoming FOMC decision later this week will likely act as the true liquidity catalyst — until then, gold remains positioned for further inducement cycles as both buyers and sellers continue to get baited into traps.
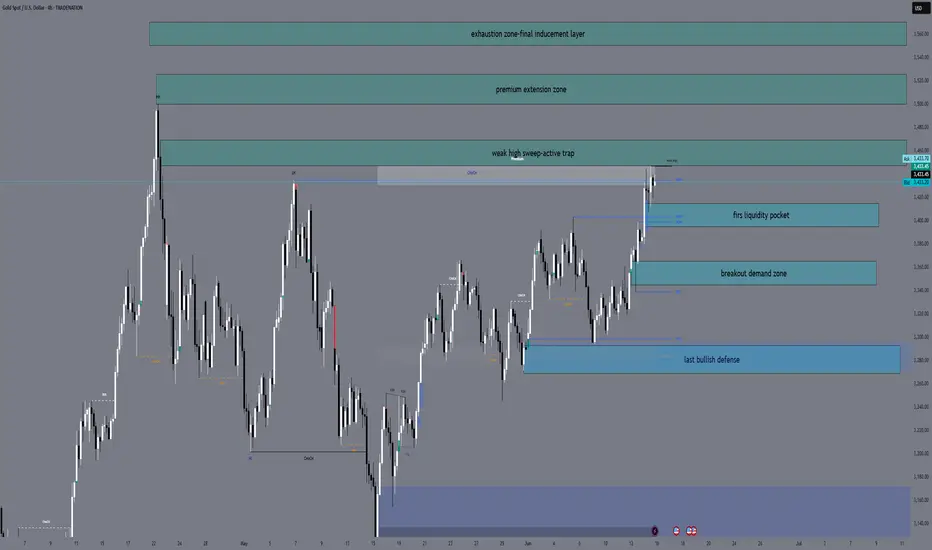
🔼 Premium Supply Zones
Price Zone Description
3447 – 3470 Weak high sweep — premium liquidity trap fully active
3500 – 3525 Main extension liquidity pocket — Fibonacci cluster (1.272 & 1.414 extensions)
3550 – 3570 Exhaustion inducement — full 1.618 premium extension stack
🔽 Demand Defense Zones
Price Zone Description
3415 – 3395 Minor imbalance recalibration — short-term liquidity refill zone
3365 – 3345 Core breakout OB + FVG overlap — main recalibration zone if pullbacks extend
3285 – 3265 HTF bullish structure base — BOS origin + deep recalibration defense level
🎯 Where We Stand Right Now
✅ Smart money holds full control inside premium expansion.
✅ Inducement layers remain open both above and below current price.
✅ We expect short-term liquidity sweeps before any major expansion unfolds.
✅ No change in bias — bullish structure remains valid while 3285 holds.
🔐 The Mindset
👉 This is not the place for aggressive chasing.
👉 Liquidity will continue to hunt both sides into key events ahead.
👉 Our job is not to predict, but to position with discipline once liquidity confirms displacement inside the calibrated zones.
🚀 If this breakdown helps you stay locked:
💬 Drop a 🚀, leave your thoughts & follow for full sniper-level updates as we approach a volatile week ahead.
Stay sharp — the trap is already in play.
— GoldFxMinds
Breakout!
HelenP. I Euro may break suppot level and drop to trend lineHi folks today I'm prepared for you Euro analytics. Observing this chart, we can see how the price strongly declined and reached the trend line, where it found solid support and reversed. From that point, EUR began to grow, forming a clear upward pennant structure. This movement included a break above the local support level at 1.1485, indicating temporary bullish strength. However, despite this breakout, the price failed to secure a strong push through the resistance zone between 1.1485 and 1.1530, instead consolidating just below it. Now the chart shows clear signs of slowing upward momentum. The price remains inside the pennant, but current movement suggests potential weakness near the top boundary. Given the structure and previous reaction points, I expect EURUSD to break below the support level and move toward the trend line again. This would be a natural retest of the lower boundary of the pennant. That’s why I’ve set my target at 1.1365, a level that coincides perfectly with the trend line, offering a realistic area for price to react once more. If you like my analytics you may support me with your like/comment ❤️
Disclaimer: As part of ThinkMarkets’ Influencer Program, I am sponsored to share and publish their charts in my analysis.

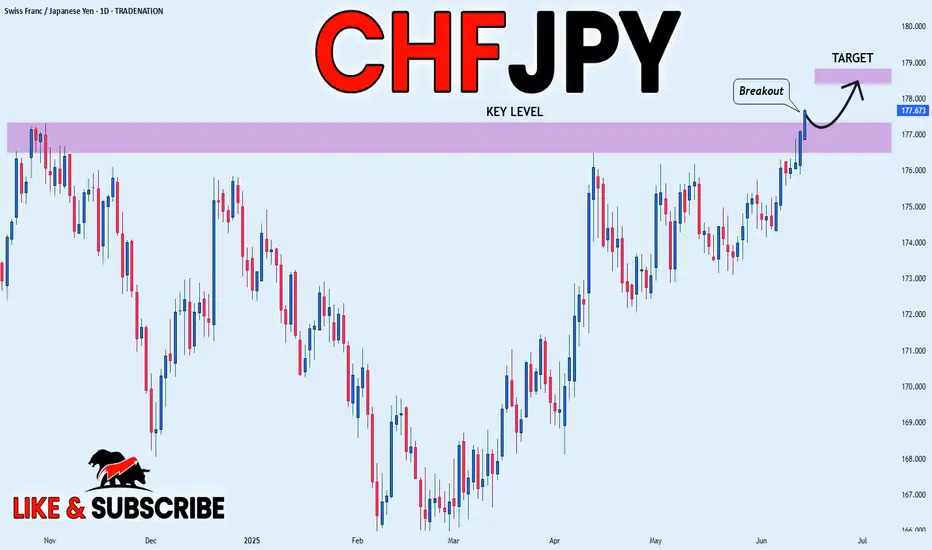
CHF_JPY BULLISH BREAKOUT|LONG|
✅CHF_JPY is going up
Now and the pair made a bullish
Breakout of the key horizontal
Level of 177.000 and the breakout
Is confirmed so we are bullish
Biased and we will be expecting
A further bullish move up
On Monday
LONG🚀
✅Like and subscribe to never miss a new idea!✅
Disclosure: I am part of Trade Nation's Influencer program and receive a monthly fee for using their TradingView charts in my analysis.
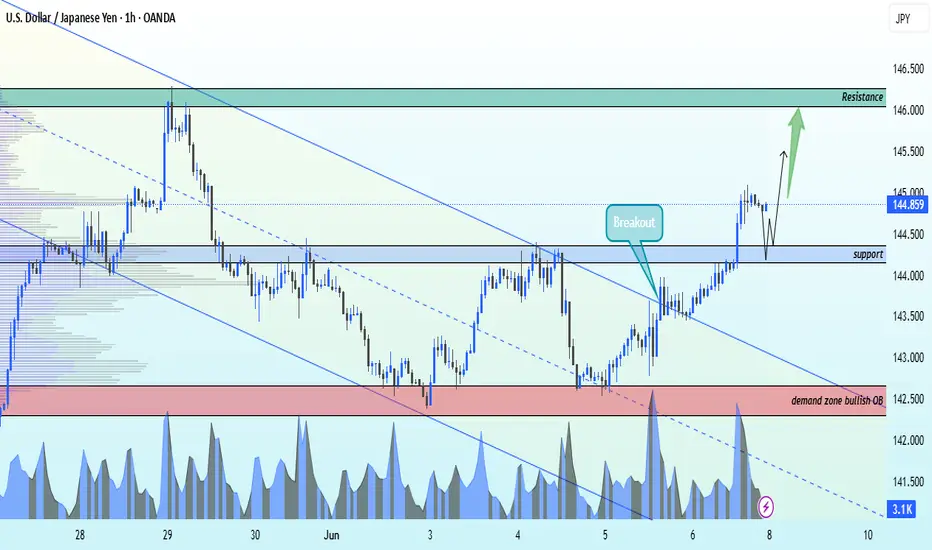
USDJPY has breakout the descending channel bullish strong nowFX:USDJPY Alert – Bullish Breakout in Play!
1H Timeframe | Descending Channel Breakout
📈 Entry: 144.300
🎯 Target 1: 146.000 (Key Resistance)
🛡️ Stop Loss: 142.700 (Demand Zone / Bullish OB)
After a clean breakout above the descending channel, USDJPY is showing strong bullish momentum. Price action confirms a potential move toward the next resistance level.
🔍 Technicals are lining up. Risk managed. Eyes on the prize.
✨ Like, Follow, Comment & Join us for more real-time setups and updates!
📊 Let’s trade smart. Let’s trade together.
#USDJPY #ForexTrading #BreakoutSetup #TechnicalAnalysis #LiviaTrades 😜📉📈
New Highs for Gold = New bull RunHere it is!! the breakout I been talking about in my other updates. doing it on a Friday cause Israel is starting ish! Sitting this out cause it can get volatile.

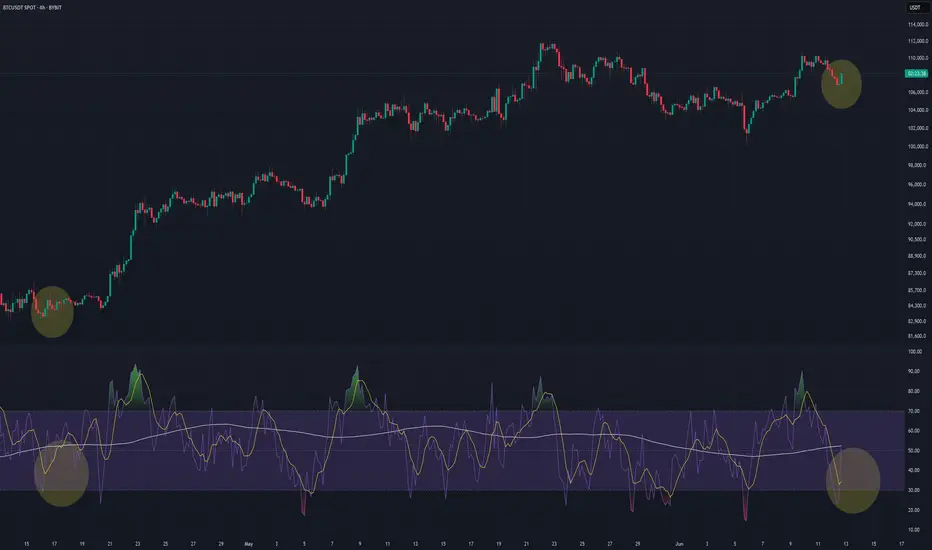
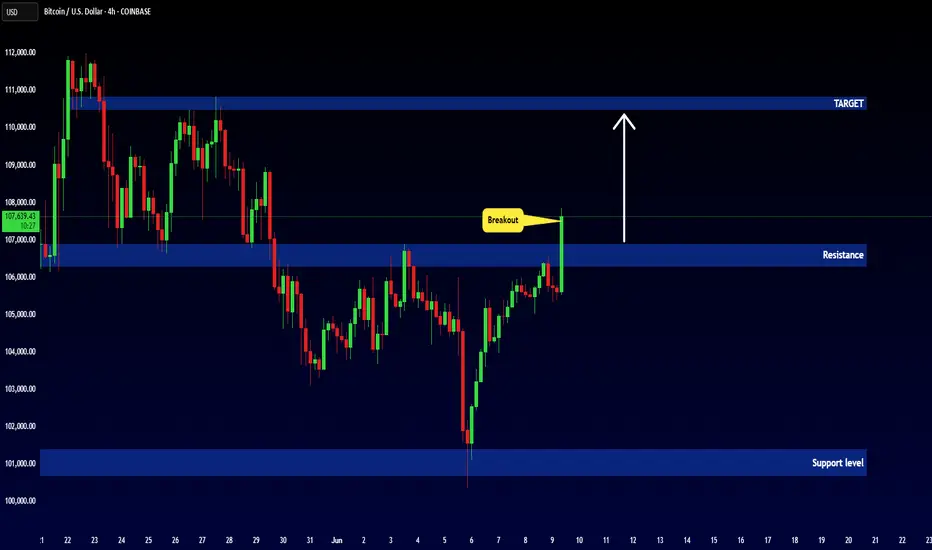
BTC Triple JumpRSI Fired ✔ Breakout Above $110,200 Next ➜ Targeting 140K
BTC is entering a critical phase on the 4H chart, and this setup looks remarkably similar to previous moments that led to sharp bullish continuation. Price is steadily forming higher lows and now pressing right up against the key resistance at $110,200 — the last confirmed swing high. 🧱
What makes this moment particularly interesting is what’s happening beneath the price: momentum is quietly shifting. Using a custom triple RSI setup — with short, medium, and long lengths — I’m seeing a familiar pattern unfold. The white line (longer-term RSI) has already crossed above the 50 level ✅, a strong signal of building trend strength. Meanwhile, both the short and medium RSIs are deep in the oversold zone 🔻 — a dynamic that, in the past, has front-run explosive rallies.
This exact structure has preceded multiple breakout moves over the past months. The RSI alignment acts as an initiative confirmation, and now price is approaching the final confirmation level: a break and 4H close above $110,200. If that happens, I expect a swift push toward $112,500–$114,000, with potential for much more.
🔥 This aligns perfectly with my previous idea, where I laid out a case for a major breakout in June that could drive BTC toward $140K. That outlook was based on higher-timeframe expansion patterns and macro structure — and what we’re seeing now could be the moment where it all starts.
As of now, it’s too early to talk about invalidation. The structure remains intact. Momentum is shifting. All that’s left is the breakout.
If you haven’t seen my 140K projection yet, check it out — this could be the first real ignition point. 🚀
OKLO can go locoPattern: Classic cup and handle formation. Handle forming as a bull flag — very bullish continuation setup.
Resistance: ~$57.78 — key neckline from prior highs. Needs strong close above this level for confirmation.
Volume: Declining during handle = textbook. Suggests controlled pullback. Watching for volume spike on breakout.
Moving Averages: Price is trading above all key MAs, confirming bullish trend structure.
🔥 Most Favorable Path:
Let price tighten within the handle, then breakout above $57.78 on increased volume. If confirmed, target $66–70+ based on measured move from cup base to neckline.
⚠️ Invalidation:
Break below $50 with volume would invalidate handle and signal potential deeper retracement.
✅ Summary:
Setup: Cup & Handle
Bias: Strongly bullish
Entry trigger: Break + close > $57.78
Targets: $66 → $70 zone
Risk level: Manage below $50
*Not a financial advice

Just crazy $XTIA in minutesFrom halt to halt, doubling on power volume. It started the year at $60 seems like traders are looking at that as they're buying into vertical.

Bitcoin will rise from support level and exit from wedgeHello traders, I want share with you my opinion about Bitcoin. This chart shows how the price rebounded from the current support level and then turned around and rebounded up. Price broke the 109000 level, coinciding with a support area, and then traded near this level for some time. Later price turned around and started to decline inside a downward channel, where it soon broke the 109000 level, reached the resistance line, and continued to fall next. Bitcoin fell to the support line of the channel, which coincided with the 103000 support level and buyer zone, after which it rebounded up. Then BTC exited from channel and later entered to upward wedge, where it at once made a correction movement from the resistance line to the support line, breaking the 103000 level. But soon, price made an impulse up, breaking the support level one more time. Next, it rose to the current support level, broke it too, and now trades inside the support area. In my mind, BTC can rebound from the support level and rise to the resistance line of the wedge. Then it can break this line, thereby exiting from the wedge and continuing to move up; therefore, I set my TP at 112000 points. Please share this idea with your friends and click Boost 🚀

GAIL 1H Chart Analysis (Trendline Breakout Setup)NSE:GAIL GAIL 1H Chart Analysis (Trendline Breakout Setup)
The 1-hour chart of GAIL (India) Ltd shows a clean descending trendline breakout followed by higher lows, indicating strength building up. The price is consolidating just below a horizontal resistance around ₹193, forming a potential ascending triangle pattern.
Trendline Breakout:
Price has broken a long-standing descending trendline.
Retest and higher lows have followed the breakout, showing bullish intent.
Ascending Triangle Pattern:
Horizontal resistance near ₹193 is tested multiple times.
Rising trendline support suggests buyers are becoming aggressive.
Volume Confirmation Needed:
A breakout above ₹193.10 with volume would validate the bullish setup.
Trade Setup:
Buy Entry: Above ₹193.10 (confirmed breakout
Stop Loss: Below ₹190.00 (below rising trendline) CLOSING BASIS
Target 1: ₹196.85 (resistance zone)
Target 2: ₹204.50 (swing high)
The combination of trendline breakout and ascending triangle formation indicates a strong bullish continuation setup. Entry above ₹193.10 is ideal after confirmation, with targets up to ₹204 and risk well-managed below ₹190.
Disclaimer: I am not a SEBI-registered advisor. The analysis shared is purely for educational and informational purposes only. Please consult your financial advisor before making any investment or trading decision. Trading and investing in the stock market involves financial risk. The author will not be held responsible for any losses incurred.
@thetradeforecast
NSE:GAIL NSE:NIFTY

GBP-USD Bearish Breakout! Sell!
Hello,Traders!
GBP-USD made a bearish
Breakout of the rising support
Which is a resistance now and
The breakout is confirmed
So we are bearish biased
And we will be expecting
A further bearish move down
Sell!
Comment and subscribe to help us grow!
Check out other forecasts below too!
Disclosure: I am part of Trade Nation's Influencer program and receive a monthly fee for using their TradingView charts in my analysis.

VZ - DO YOU SEE IT? Verizon its saying helllo!
A peaka-boo breakout on the daily chart is being observed.
This stock has coiled in a tight multi week range for a long time and is ready to explode higher if this breakout holds.
Typically a boring name that doesn't do much but when it starts to trend it can really go!
I'm looking at continuation long & upside calls.
This could head to $55 OVER THE NEXT FEW MONTHS.

AUDJPY - Bullish Double BottomHello Traders !
The AUDJPY price formed a double bottom pattern.
Currently, The neckline is broken!
So, I expect a bullish move🚀
______________
TARGET: 95.110🎯

ETH/BTC : Ready to Lead the Altcoin Season?Hey Traders!
If you’re finding value in this analysis, smash that 👍 and hit Follow for high-accuracy trade setups that actually deliver!
Ethereum just broke out of a multi-week symmetrical triangle against Bitcoin — a classic continuation pattern! After consolidating for over a month, this breakout could signal a major shift in market dynamics.
Pattern: Symmetrical Triangle
Measured Move Target: +38.7% from the breakout
Timeframe: 12H
Current Ratio: 0.02517 BTC
🔍 Why ETH/BTC Matters for Altcoins:
When ETH/BTC rises, it often marks the beginning of an altcoin rally. Here's why:
✅ ETH leads altcoins — It’s the largest alt by market cap, and capital often rotates from BTC → ETH → mid/small caps.
✅ Rising ETH/BTC = Bitcoin dominance weakening, giving altcoins room to breathe.
✅ Confidence returns to the broader alt market when ETH outperforms BTC.
If this breakout sustains, we may be entering a strong altcoin season. Keep an eye on ETH strength and look for high-potential setups across the altcoin board!
What are your top altcoin picks for this potential rally? Drop them below 👇

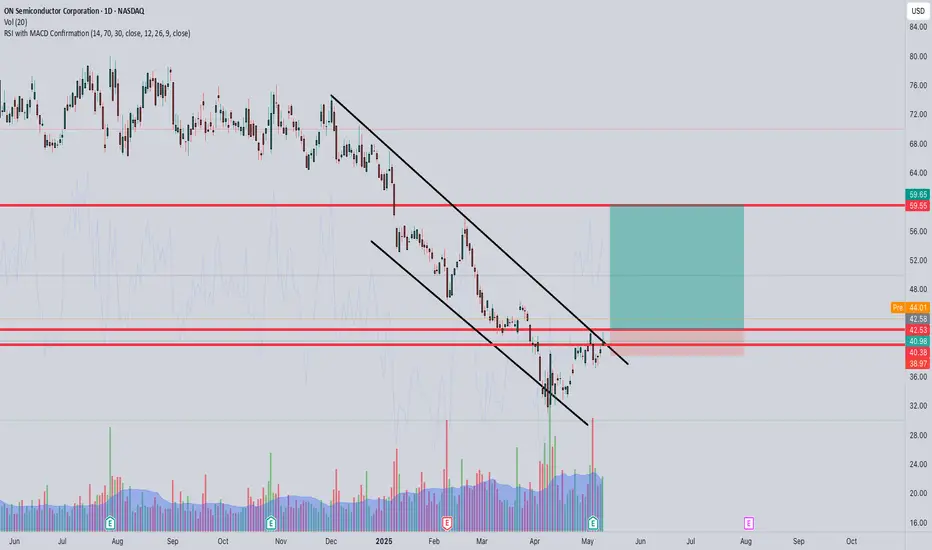
ON is on!!We are opening at 44 which is the contracts the flow picked up (once again they were right)
But this chart is showing a lot of potential, as we broke above the trendline, i will watch 45 for an entry with a possible $60 target
EURO - Price will strart to grow and exit from wedge patternHi guys, this is my overview for EURUSD, feel free to check it and write your feedback in comments👊
Price entered to wedge pattern and at once dropped below $1.1455 level, breaking it and then some time traded below.
It continued to decline and in a short time reached $1.1220 level and broke it, after which fell to support line.
Then price started to grow and soon broke $1.1220 level one more time, after which made a retest and continued to grow.
Euro rose to $1.1420 points and then corrected to support level, after which turned around and rose to resistance level.
Recently price reached resistance level, but then it bounced and started to decline, and now it continues to fall.
I think that Euro can decline a little more and then bounce up to $1.1550, exiting from wedge.
If this post is useful to you, you can support me with like/boost and advice in comments❤️
Disclaimer: As part of ThinkMarkets’ Influencer Program, I am sponsored to share and publish their charts in my analysis.

HelenP. I Gold may break support level and continue to move downHi folks today I'm prepared for you Gold analytics. Observing this chart, we can see how the price reached support 2, which coincided with the support zone and tried to break it, but failed and dropped below. Then Gold turned around and made an impulse up, broke firstly 3125 level first and then reached support 1 and broke it too. After this movement, Gold continued to grow and reached the trend line, after which it started to decline inside a triangle pattern, where it first fell below support 1, making a first gap. Next, Gold tried to back up, but failed and dropped to support 2, after which it started to grow. In a short time, XAU rose to support 1, broke it, and some time traded between this level. Not long time ago, it rose to the trend line, which is the resistance line of a triangle as well, and then fell to the resistance zone. So, I expect that XAUUSD will break the support level and then continue to fall, thereby exiting from triangle too. For this case, I set my goal at 3225 points. If you like my analytics you may support me with your like/comment ❤️
Disclaimer: As part of ThinkMarkets’ Influencer Program, I am sponsored to share and publish their charts in my analysis.

1,505% from $0.20 to $3.21 on massive 1+ Billion volume $KLTOWOW 🤯 1,505% from $0.20 to $3.21 on massive 1+ Billion shares traded 🚀 NASDAQ:KLTO
I sent out 2 Buy Alerts for everyone to get paid nicely ✅
This will trigger more runners, premarket already got movers NASDAQ:MEGL , NASDAQ:MRIN , NASDAQ:EVGN

GBP-CHF Wait For Breakout! Buy!
Hello,Traders!
GBP-CHF formed a bullish
Triangle pattern so we are
Locally bullish biased and
IF we see a bullish breakout
Our bullish bias will be
Confirmed and we will be
Expecting a further
Bullish continuation
Buy!
Comment and subscribe to help us grow!
Check out other forecasts below too!
Disclosure: I am part of Trade Nation's Influencer program and receive a monthly fee for using their TradingView charts in my analysis.

BITCOIN - NEW BREAKOUT !Hello Traders !
The Bitcoin failed to break the support level (101400 - 100700).
The price broke the resistance (106300 - 106900).
This key level becomes new resistance !
So, I expect a bullish move🚀
______________
TARGET: 110500🎯
BIG 441% Monday from $0.60 to $3.25 $OMH🔥 BIG 441% Monday from $0.60 to $3.25
Easiest money made today was on NASDAQ:OMH buy before halt, then once it came out of halt it was just gapped up into 💸💸💸

AVAAI/USDT: FALLING WEDGE BREAKOUT! 90%+ PROFIT POTENTIAL!!AVAAI Breakout Alert – 90%+ Potential on the Table
Hey Traders — if you're into high-conviction setups with real momentum, this one’s for you.
AVAAI has officially broken out of a falling wedge structure on the 4H timeframe — a classic bullish reversal pattern. After weeks of downtrend, price finally closed above resistance with volume.
📌 Entry: Current Market Price (CMP) and add more up to $0.0487
🎯 Targets: $0.0585 / $0.0670 / $0.0798
🛑 Stop Loss: $0.0412
📈 Leverage: 5x–10x (low to moderate)
We’ve already seen a 90% move last time from this zone — if momentum holds, a repeat isn’t off the table. Breakout confirmed. Now it's all about the follow-through.
What's your take on AVA AI here? Are you riding this breakout or staying cautious?

Bitcoin Strong Momentum Below Key Resistance__________________________________________________________________________________
Technical Overview – Summary Points
__________________________________________________________________________________
Momentum: Strong bullish momentum across higher timeframes. Generalized “Up” alignment via MTFTI, strong leverage from the Risk On / Risk Off Indicator (Strong Buy on all timeframes except temporary 2H Down).
Supports / Resistances: Price evolving just below major resistances (107643.9, 109952.8, 111949) and holding above key defensive zones (104940/105287.8, then 100353/100335).
Volumes: Average on higher timeframes, very high/accelerating on 30min/15min (potential buying climax or local volatility spike).
Multi-TF/ISPD DIV Behaviour: ISPD mostly neutral, but “Sell” warning on 30min during volume peaks (risk of quick profit-taking or fake breakout).
__________________________________________________________________________________
Strategic Summary
__________________________________________________________________________________
Global Bias: Ultra-bullish. Momentum structure supported by technical/sectoral/on-chain convergence.
Opportunity: Buy on defended pullbacks (support 104940/105287.8) or daily confirmation > 107700. Extension toward 109950–111949 upon pivot breakouts.
Main Risk: Extreme volumes + ISPD Sell alerts (30min) = caution, speculative excess/whipsaw possible, quick profit-taking, lack of macro catalyst (weekend proximity).
Macro Catalysts: No urgent catalysts (macro stable, low exogenous risk).
Action Plan:
Tactical entry on defended pullbacks or validated daily signal > 107700.
Stop-loss below 104940 (pivot), swing validation below 100335/100353 (on-chain).
Active management of 107600–107700 zone (potential climax/local capitulation).
__________________________________________________________________________________
Multi-Timeframe Analysis
__________________________________________________________________________________
1D (Daily): Strong momentum, price just below pivots, no sell signal. Supports: 100300/93337.4.
12H: Similar structure, buyers in control, potential dip under 107600–109900.
6H/4H: Ongoing bullish impulse, test of the critical 107640–107644; no signs of weakness bar minor consolidation.
2H: Only TF Down, technical breakout underway, “Up” signal restoring (watch for fakeout below 107600).
1H: Strong Up momentum, breakout confirmed, next candle confirmation needed.
30min/15min: Record volumes, ISPD Sell at 30min: high “bull trap” risk. Microsctructure strongly bullish but high post-spike volatility risk.
Risk On / Risk Off Indicator: Strong Buy on all major timeframes.
Bullish Confluences:
Up alignment (all majors except 2H), breakouts, confirmed sectoral momentum.
Very high volumes = new trend or potential buying climax.
Short-term risks:
ISPD Sell + extreme volume 30min/15min = possible local exhaustion.
Critical zone: 107600–107700. Watch out for fake breakouts!
__________________________________________________________________________________
Strategic Bias – Pro Summary
__________________________________________________________________________________
Technical: Setups remain bullish. Pivot breaks “open” the target zone up to 109950–111949. Stops below 104940 (pivot), swing validation sub 100335/100353. Switch to active management on exhaustion signals (vol spike or ISPD Sell).
On-Chain: Mature distribution; upside limited without new catalyst, but 103700/104940 zone remains pivotal.
Macro: No bearish macro/news catalyst short-term, technical dominance prevails.
Operational Summary:
Tactical bullish stance.
Favor buying dips toward 104940–105287.8.
Partial profit-taking above 109950.
Switch defensive on daily break 104940/104000.
__________________________________________________________________________________
