AVAAI/USDT: FALLING WEDGE BREAKOUT! 90%+ PROFIT POTENTIAL!!AVAAI Breakout Alert – 90%+ Potential on the Table
Hey Traders — if you're into high-conviction setups with real momentum, this one’s for you.
AVAAI has officially broken out of a falling wedge structure on the 4H timeframe — a classic bullish reversal pattern. After weeks of downtrend, price finally closed above resistance with volume.
📌 Entry: Current Market Price (CMP) and add more up to $0.0487
🎯 Targets: $0.0585 / $0.0670 / $0.0798
🛑 Stop Loss: $0.0412
📈 Leverage: 5x–10x (low to moderate)
We’ve already seen a 90% move last time from this zone — if momentum holds, a repeat isn’t off the table. Breakout confirmed. Now it's all about the follow-through.
What's your take on AVA AI here? Are you riding this breakout or staying cautious?
Breakout!

Bitcoin Strong Momentum Below Key Resistance__________________________________________________________________________________
Technical Overview – Summary Points
__________________________________________________________________________________
Momentum: Strong bullish momentum across higher timeframes. Generalized “Up” alignment via MTFTI, strong leverage from the Risk On / Risk Off Indicator (Strong Buy on all timeframes except temporary 2H Down).
Supports / Resistances: Price evolving just below major resistances (107643.9, 109952.8, 111949) and holding above key defensive zones (104940/105287.8, then 100353/100335).
Volumes: Average on higher timeframes, very high/accelerating on 30min/15min (potential buying climax or local volatility spike).
Multi-TF/ISPD DIV Behaviour: ISPD mostly neutral, but “Sell” warning on 30min during volume peaks (risk of quick profit-taking or fake breakout).
__________________________________________________________________________________
Strategic Summary
__________________________________________________________________________________
Global Bias: Ultra-bullish. Momentum structure supported by technical/sectoral/on-chain convergence.
Opportunity: Buy on defended pullbacks (support 104940/105287.8) or daily confirmation > 107700. Extension toward 109950–111949 upon pivot breakouts.
Main Risk: Extreme volumes + ISPD Sell alerts (30min) = caution, speculative excess/whipsaw possible, quick profit-taking, lack of macro catalyst (weekend proximity).
Macro Catalysts: No urgent catalysts (macro stable, low exogenous risk).
Action Plan:
Tactical entry on defended pullbacks or validated daily signal > 107700.
Stop-loss below 104940 (pivot), swing validation below 100335/100353 (on-chain).
Active management of 107600–107700 zone (potential climax/local capitulation).
__________________________________________________________________________________
Multi-Timeframe Analysis
__________________________________________________________________________________
1D (Daily): Strong momentum, price just below pivots, no sell signal. Supports: 100300/93337.4.
12H: Similar structure, buyers in control, potential dip under 107600–109900.
6H/4H: Ongoing bullish impulse, test of the critical 107640–107644; no signs of weakness bar minor consolidation.
2H: Only TF Down, technical breakout underway, “Up” signal restoring (watch for fakeout below 107600).
1H: Strong Up momentum, breakout confirmed, next candle confirmation needed.
30min/15min: Record volumes, ISPD Sell at 30min: high “bull trap” risk. Microsctructure strongly bullish but high post-spike volatility risk.
Risk On / Risk Off Indicator: Strong Buy on all major timeframes.
Bullish Confluences:
Up alignment (all majors except 2H), breakouts, confirmed sectoral momentum.
Very high volumes = new trend or potential buying climax.
Short-term risks:
ISPD Sell + extreme volume 30min/15min = possible local exhaustion.
Critical zone: 107600–107700. Watch out for fake breakouts!
__________________________________________________________________________________
Strategic Bias – Pro Summary
__________________________________________________________________________________
Technical: Setups remain bullish. Pivot breaks “open” the target zone up to 109950–111949. Stops below 104940 (pivot), swing validation sub 100335/100353. Switch to active management on exhaustion signals (vol spike or ISPD Sell).
On-Chain: Mature distribution; upside limited without new catalyst, but 103700/104940 zone remains pivotal.
Macro: No bearish macro/news catalyst short-term, technical dominance prevails.
Operational Summary:
Tactical bullish stance.
Favor buying dips toward 104940–105287.8.
Partial profit-taking above 109950.
Switch defensive on daily break 104940/104000.
__________________________________________________________________________________

Buying ASTS — Waiting for BreakoutASTS has broken out of a long-term downtrend and is now consolidating in a tight range, forming a base after a strong impulse move. This kind of price action often leads to another breakout, especially when supported by rising volume and EMAs lining up underneath.
I’m buying in this current zone, expecting a breakout from the range and continuation to the upside. I’ll be watching for confirmation through volume spikes and a clean move above resistance. The chart structure looks strong, and the upside potential remains high.
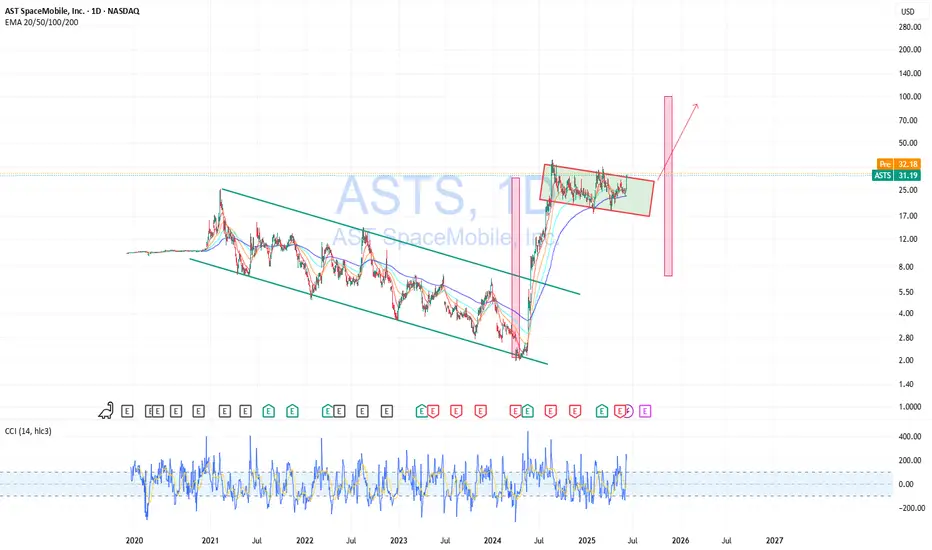
Monster Breakout brewing for ASTS🔍 NASDAQ:ASTS Weekly Chart Analysis (Accurate)
Pattern: Massive bull flag / consolidation wedge after a parabolic run.
Current Price: ~$31.20, sitting near the midpoint of the descending channel.
Structure:
Price is compressing between lower highs and higher lows.
Volume spikes on up moves, low volume on pullbacks = bullish accumulation.
Testing upper trendline of the flag — breakout could trigger a new wave.
✅ Favorable Path:
Break and weekly close above ~$34.00 (channel resistance) confirms breakout. That opens up a measured move targeting $50–55 short-term, and possibly $70+ if momentum accelerates.
🎯 Measured Move Target:
Pole base ~$6 → Flag peak ~$36 = ~$30 range
Breakout above $34 → Target = $34 + 30 = $64
⚠️ Invalidation:
A breakdown below $24–25 zone would invalidate the flag and suggest distribution instead of continuation.
🔑 Summary:
Setup: Weekly bull flag after a parabolic leg
Bias: Strongly bullish with breakout potential
Trigger: Weekly close above $34.00
Short-term target: $50–55
Full measured move target: ~$64
Invalidation zone: Below $24
Smart money appears to be loading the dips. Breakout traders should watch $34 like a hawk.

TOST getting toastyTOST Technical Analysis (Breakout Setup):
Current Pattern: Bull flag forming after a strong breakout from the $40.50 zone with increasing volume.
Resistance: $44.33 – key level to break for momentum continuation.
Support levels:
$42.00 (top of previous consolidation zone)
$40.55 (bull flag base and breakout pivot)
Ideal Breakout Play:
Watch for breakout above the flag’s upper trendline, ideally clearing $44.33 with volume.
A daily close above $44.33 confirms continuation — target $47–48 short-term, with potential run to $50 psychological.
Invalidation:
Break below $40.55 on volume negates the setup, suggesting failed breakout.
Favorable Path:
Consolidate slightly → Break flag above $44.33 → Ride momentum to $47–48. Risk/reward favors long bias above $44.33.
💡 This is a textbook bull flag following a high-volume breakout — high probability if volume confirms the breakout.

AUD-JPY Will Keep Growing! Buy!
Hello,Traders!
AUD-JPY made a bullish
Breakout of the key
Horizontal level of 93.800
And the breakout is confirmed
So we are bullish biased
And we will be expecting
A further bullish move up
Buy!
Comment and subscribe to help us grow!
Check out other forecasts below too!
Disclosure: I am part of Trade Nation's Influencer program and receive a monthly fee for using their TradingView charts in my analysis.

Review and plan for 9th June 2025Nifty future and banknifty future analysis and intraday plan.
Positional idea.
This video is for information/education purpose only. you are 100% responsible for any actions you take by reading/viewing this post.
please consult your financial advisor before taking any action.
----Vinaykumar hiremath, CMT

Gold will make impulse up from support line of triangle to 3430Hello traders, I want share with you my opinion about Gold. Some days ago, price entered to triangle, where it made an upward impulse at once to the resistance line, breaking the resistance level. But then price turned around and in a short time declined back, breaking the resistance level one more time. Next, Gold continued to fall and reached the support line of the triangle. After this, it made an impulse up again and exited from the triangle pattern with broke the 3280 level. Price rose to the resistance level and then started to trade inside another triangle pattern. In this pattern, Gold dropped from the 3430 resistance level, which coincided with the resistance line, and dropped to the support line, breaking the 3280 level. After this movement, Gold turned around and started to grow, and later reached the 3280 level and broke it again. Then the price continued to grow and reached the resistance line of the triangle pattern, where at the moment continues to trades near. In my opinion, Gold can rebound from the support line of the triangle and rise to the resistance level, exiting from triangle pattern. For this case, my TP is 3430 level. Please share this idea with your friends and click Boost 🚀
Disclaimer: As part of ThinkMarkets’ Influencer Program, I am sponsored to share and publish their charts in my analysis.

Bitcoin will continue to fall to support level in channelHello traders, I want share with you my opinion about Bitcoin. This chart shows how the price rebounded from the support line and started to grow. In a short time, it rose to the support level, which coincided with the buyer zone, and it even soon broke this level. Next, the price rose a little and then continued to move up, but later corrected the support line. After this, BTC rebounded and rose to the seller zone, breaking the 108800 resistance level. Then it rose a little more and turned around, and started to decline inside the downward channel. In the channel, price soon broke the 108800 level and continued to fall next. Later, Bitcoin broke the support line and fell almost to the support line of the channel, after which it turned around and made an upward movement. After this movement, Bitcoin dropped to the 100300 support level, after which it turned around and, in a short time, rose to almost the resistance line of the channel. Price didn't reach this line, turned around, and continued to fall in the channel. In my mind, Bitcoin can continue to move down top support level inside the downward channel. That's why my TP is 100300 level. Please share this idea with your friends and click Boost 🚀

AUD_JPY BULLISH BREAKOUT|LONG|
✅AUD_JPY is trading in a
Local uptrend and the pair
Broke the key horizontal level
Of 93.866 and the breakout is
Confirmed so we will be
Expecting a further
Bullish move up on Monday
LONG🚀
✅Like and subscribe to never miss a new idea!✅
Disclosure: I am part of Trade Nation's Influencer program and receive a monthly fee for using their TradingView charts in my analysis.

GOLD - Price can drop to support line of triangle patternHi guys, this is my overview for XAUUSD, feel free to check it and write your feedback in comments👊
In this chart price formed a triangle pattern, where it first declined to support line and then made an impulse up.
After this, Gold broke $3165 level and, after a small correction reached and broke $3400 level too.
Then it rose to resistance line of triangle and dropped below $3400 level, breaking it one more time.
Price tried to back up, but failed and dropped more to support line of triangle, after which started to grow.
In a short time price rose to resistance line of triangle, which coincided with resistance level and area.
Now, I think that Gold can drop from resistance area to $3250 point of support line of triangle.
If this post is useful to you, you can support me with like/boost and advice in comments❤️
Disclaimer: As part of ThinkMarkets’ Influencer Program, I am sponsored to share and publish their charts in my analysis.

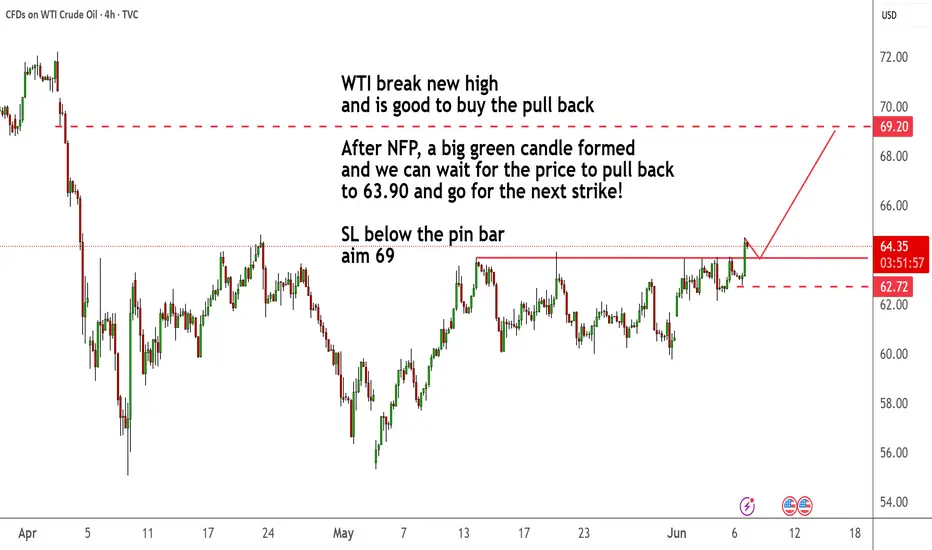
WTI break new high and is good to buy the pull backWTI break new high
and is good to buy the pull back
After NFP, a big green candle formed
and we can wait for the price to pull back
to 63.90 and go for the next strike!
SL below the pin bar
aim 69
3,367% or $3 to $124 in 1 week!🚀 $3 to $124 in 1 week or +3,367% is the kind of stock we all live for!
NASDAQ:SBET was May's power mover, let's see which one does this in June!

Bitcoin may break resistance level and continue to move upHello traders, I want share with you my opinion about Bitcoin. If we look at the chart, we can see how the price entered an upward channel and declined to the support line. Then it started to grow and soon reached the 93500 support level, after which it broke this level and then some time traded near. After this, the price rebounded and continued to move up inside an upward channel, where it later reached a resistance level, which coincided with the seller zone. When BTC reached this level, it broke it too and even rose to the resistance line of the channel, but soon it turned around and dropped to the seller zone. In this area, the price long time traded and later tried to grow, but failed and continued to decline. Soon, BTC broke the 106500 level and fell below the resistance level. But recently, price turned around and grew to this level again, and now trades very close. In my opinion, Bitcoin can decline a little and then break the resistance level one more time. After this movement, I expect that the price will continue to move up inside the upward channel, so I set my TP at 112000 points. Please share this idea with your friends and click Boost 🚀

HelenP. I Gold will break support level and fall to $3275 pointsHi folks today I'm prepared for you Gold analytics. In this chart, we can see how the price reached support 1 and then at once dropped to support 2, which coincided with the support zone, making a first gap. Then the price tried to grow, but failed and continued to decline, breaking support 2 and later reaching the trend line. After this movement, Gold turned around and made an impulse up, breaking support 2 and making a first-second gap. Next, Gold made a correction movement to support 2 and then made an impulse up to support 1, which coincided with the support zone. After this, Gold made a small correction and then rose to the support zone, where it made a third gap. Next, XAU in a short time declined to the trend line, broke it, but then started to grow above this line. Some time later, Gold rose to support 1, making a fourth gap, and recently broke support 1 with a trend line. At the moment, the price is traded inside the support zone, and I think that XAUUSD will break the support level, make a retest, and continue to decline. For this case, I set my goal at 3275 points. If you like my analytics you may support me with your like/comment ❤️
Disclaimer: As part of ThinkMarkets’ Influencer Program, I am sponsored to share and publish their charts in my analysis.

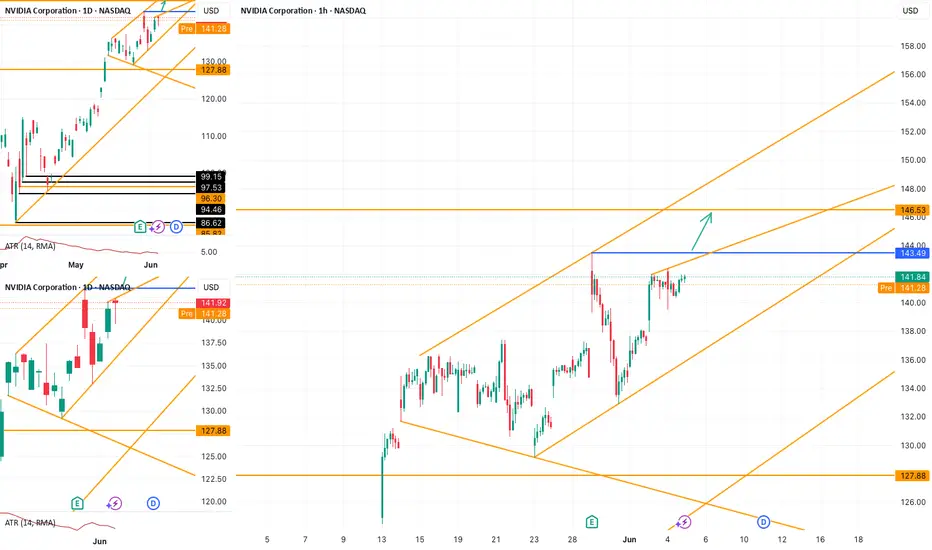
NVDA Setup: Clean Path to 146.53 If 143.49 Gives WayNASDAQ:NVDA continues to move within a rising channel. On the 1H chart, no major trendline currently limits further upside. If price breaks above the key swing high at 143.49 , the next potential target lies around 146.53 .
PolkaDot (DOT) Structure Analysis (1D)BITGET:DOTUSDT is showing signs of strength after a deviation below the long-standing $3.70–$4.10 demand zone.
Key Levels
• 🟢 Demand Zone: $3.70–$4.10, respected since October 2023
• 🟡 Broken downtrend resistance, retested as support
• ⚪ Current falling channel (compression) following range high retest
• 🟥 Sell Order Block: $5.10–$5.40
• 🟧 Range Resistance: $5.40
• 🎯 Target on breakout: ~$7.00, potential extension to ~$7.50
Thesis
• The recent breakdown was quickly reclaimed, hinting at a possible spring/fakeout. After retesting the range high, price is now compressing within a descending channel, building energy just above demand.
• A breakout from the channel followed by an S/R flip of the $4.40–$4.60 region could trigger a rally toward the upper range.
Watching for
• Channel breakout with volume
• Clean break above $5.40 to confirm range expansion
Invalidation
• Sustained break below the $3.70–$4.10 demand zone

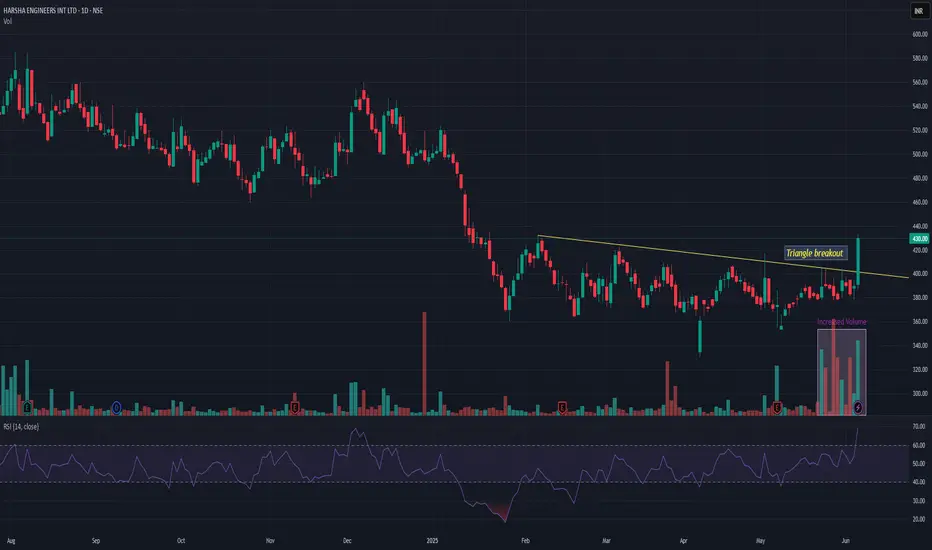
HARSHAHARSHA giving triangle breakout with decent volume. It is coming out of long 5 months consolidation. 400 seems good support. HARSHA may give momentum rally in nr future with resistance near 510.
The What vs. The Where - A 2nd Breakout Pattern After A Nice WinA few days ago we looked at a bullish breakout opportunity on Silver and it played out perfectly. After a lovely move to the upside, price has started to consolidate again providing us with a very similar setup.
HOWEVER, just as in the case of the first, we need to be aware that once again the WHAT doesn't necessarily align with the WHERE stopping this from being a Grade A trading opportunity.
Please leave any questions or comments below and remember to hit that LIKE button before you go!
Akil

ApeCoin (APE) Cup Pattern (1D)After a deviation below demand, BINANCE:APEUSDT formed a clean rounded bottom, reclaimed the zone, briefly consolidated, and it's now attempting to break above resistance.
Key Levels
• $0.79: Current resistance
• ~$0.65: Current support, breaking it might lead to the formation of a handle
• $0.50-$0.60: Main demand zone and logical pullback target in case of a handle
• $1.20: Measured breakout target, and previous swing high
Worth watching it closely for a daily close above $0.79 with good volume to activate the target.
Alternatively, look at the $0.50-$0.60 area for a reversal in case of a rejection here.

Potential reversalAs always we must look for channels in which price is moving on a bigger timeframe, this one is in 4h candles giving a good medium term channel which it has respected at least 2 times before, so my idea is to wait for a breakout and retest or a reasonable rejection at this point positioning trades following price as we allways say.... don't go against the trend!

NXPC/USDT: FALLING WEDGE BREAKOUT ALERT!!NXPC Breakout Alert – 100%+ Potential on the Table
Hey Traders — if you're into high-conviction setups with real momentum, this one’s for you.
NXPC has broken out of a falling wedge pattern on the 4H timeframe and is now retesting the breakout zone. As long as it holds above the green support box, a strong upside move remains likely.
Entry Range: $1.38 – $1.44
Targets: $1.70 / $2.30 / $2.70 / $3.10
Stop-loss: $1.26
Leverage: Use low leverage (Max 5x)
This setup has the potential to kick off a powerful rally.
Keep it on your radar and trade with discipline.
Let me know if you're in this one or watching from the sidelines.

XAU/USD Update - Riding Wave 5 to the TopGold continues its bullish recovery, having completed Wave (4) at the channel low. We're now riding Wave (5) with strong momentum.
🔹 Entry Executed: Entered long at the 0.382 Fibonacci retracement – $3,272.57, a key confluence zone with the EMA and previous structure support.
📈 Bullish Targets:
$3,396.89 (0.27 extension)
$3,463.25 (0.618 extension)
$3,499.84 (1.0 extension / Wave (5) completion)
The move is playing out cleanly, with RSI confirming upside momentum. As long as price holds above the 0.5–0.618 zone, bulls remain in control.
Letting this one breathe — eyes on higher highs. 💰📈
@WrightWayInvestments
@WrightWayInvestments
@WrightWayInvestments
