HCCHCC is on the verge to give triangle breakout provided that it sustains and closes above 31.5. I observed increased market participation. It may face bit of resistance near 36 level and above that it has a potential to go up to 45 levels. But closes below 28.5 may change my view for the stock. Again I'm saying that sustaining above 31.5 is very crucial. Keep a closer watch on how it reacts near this levels.
Breakout!

Potential Reversal and Breakout Retest.Entry Zone: We recommend initiating a BUY position in AIA Engineering Ltd. around the current levels, ideally between ₹3,280 - ₹3,320. This area represents a retest of the recent trendline breakout.
Target 1 (T1): ₹3,400
Target 2 (T2): ₹3,480
Target 3 (T3): ₹3,580 (If momentum sustains above T2)
Stop Loss (SL): ₹3,200 (Strictly on a closing basis)
Trendline Breakout & Retest: The stock recently broke out of a significant descending trendline, indicating a potential end to the corrective phase. The current price action appears to be a successful retest of this broken trendline, which often acts as new support, presenting a lower-risk entry point.
Volume Confirmation: The initial breakout was accompanied by higher volumes, and while the retest phase has lower volumes (typical), sustained buying interest on subsequent upward moves would confirm strength.
RSI Bounce from Support: The Relative Strength Index (RSI) is showing a bounce from the 40-50 zone, indicating that momentum is regaining strength and potentially moving towards the bullish territory.
Positive Structure: The overall chart structure suggests that the stock is attempting to reverse its short-term downtrend and potentially resume its broader upward trajectory.
Favorable Risk-Reward: The current setup offers a reasonable risk-to-reward ratio for a short-term trade, with potential for upside gains outweighing the defined risk.
Key Risk: A close below ₹3,200 would invalidate the bullish retest scenario and could lead to further downside, bringing the previous lows into play. Traders should adhere strictly to the stop-loss.

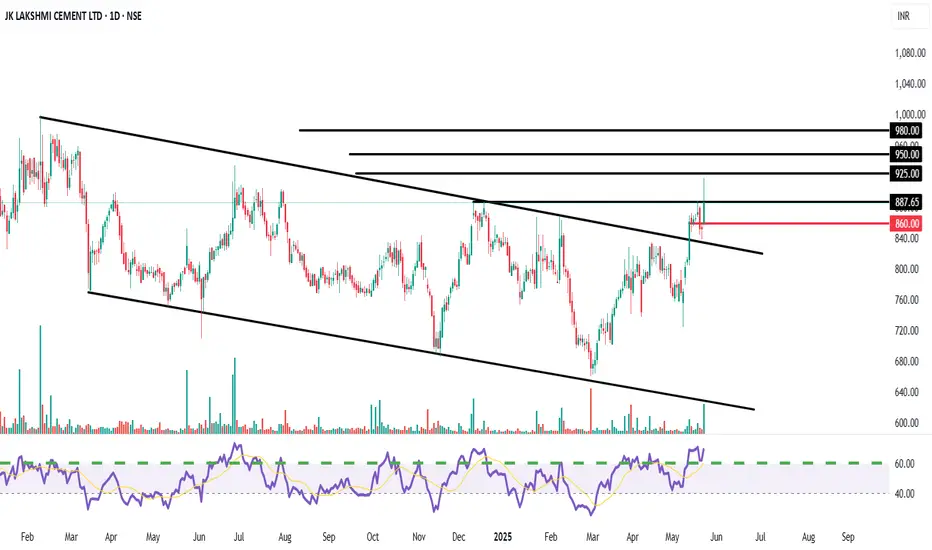
Potential Breakout from a Symmetrical Triangl Descending ChannelEntry Zone: We recommend initiating a BUY position in JK Lakshmi Cement around the current levels, ideally between ₹880 - ₹890. This considers the strong closing above the resistance trendline.
Target 1 (T1): ₹925
Target 2 (T2): ₹950
Target 3 (T3): ₹980 (If momentum sustains above T2)
Stop Loss (SL): ₹860 (Strictly on a closing basis)
Channel Breakout: The stock has decisively broken out of a multi-month descending channel/symmetrical triangle pattern, indicating a potential strong reversal from a corrective phase. This breakout appears to be supported by a noticeable pickup in volumes.
Key Resistance Breach: The stock has also managed to close above a significant horizontal resistance level around ₹880-885, which has acted as a hurdle multiple times in the past. A sustained move above this level confirms bullish intent.
RSI Strength: The Relative Strength Index (RSI) is showing strength, trading well above the 50-mark and moving towards the overbought zone, confirming increasing buying momentum.
Positive Price Action: The overall structure suggests accumulation at lower levels, and the current breakout could initiate the next leg of the uptrend.
Favorable Risk-Reward: The setup offers a compelling risk-reward profile for a short-term trade, with significant upside potential compared to the defined stop-loss.
Key Risk: A failure to sustain above the ₹880 level or a close below the ₹860 stop-loss would invalidate the bullish view and could lead to renewed selling pressure.
Bullish - Breakout observed from a descending channelEntry Zone: We recommend accumulating FSL in the zone of ₹375 - ₹385.
Target 1 (T1): ₹405
Target 2 (T2): ₹420
Target 3 (T3): ₹450 (If momentum sustains above T2)
Stop Loss (SL): ₹360 (Closing basis)
Rationale:
Channel Breakout: The stock has successfully broken out of a prominent descending channel, indicating a potential shift in momentum from bearish to bullish. This breakout is supported by decent volumes on the breakout candle.
RSI Confirmation: The Relative Strength Index (RSI) has shown a strong move above the 50-mark and is trending upwards, suggesting increasing buying interest and underlying strength.
Support from Previous Levels: The breakout retests appear to hold the previous resistance now acting as support, which is a classic bullish reversal pattern.
Risk-Reward: The current setup offers a favorable risk-to-reward ratio for short-term traders.
Key Risk: A close below ₹360 would negate the current bullish view and could lead to further downside. Traders should adhere strictly to the stop-loss.
Disclaimer: This report is for informational purposes only and does not constitute financial advice. Investors should conduct their own due diligence and consult with a qualified financial advisor before making any investment decisions. Equity investments are subject to market risks.

GBP_USD SWING BREAKOUT|LONG|
✅GBP_USD made an absolutely
EPIC breakout of the key horizontal
Level of 1.3426 and the breakout is
Confirmed even on a DAILY timeframe
Which combined with the strong uptrend
Makes us extremely bullish biased on
The pair and we will be expecting
Further growth in the coming weeks
After a potential local pullback
LONG🚀
✅Like and subscribe to never miss a new idea!✅
Disclosure: I am part of Trade Nation's Influencer program and receive a monthly fee for using their TradingView charts in my analysis.

Bitcoin - Confirmed Breakout#BTC/USDT #Analysis
Description
---------------------------------------------------------------
+ Bitcoin has successfully broken out from the resistance, this is the third time bitcoin has broken out from the resistance line, in the previous two breakouts bitcoin had significant growth and we can expect similar growth this time.
+ the next target for bitcoin is around 150k and this is an easy target for bitcoin.
+ Bitcoin can see some consolidation around previous resistance (around 109k) but this can be broken easily.
+ Lets see how this plays out.
---------------------------------------------------------------
Enhance, Trade, Grow
---------------------------------------------------------------
Feel free to share your thoughts and insights. Don't forget to like and follow us for more trading ideas and discussions.
Best Regards,
VectorAlgo

ARB - Beautiful Falling Wedge Pattern---------------------------------------------------------------
Description
---------------------------------------------------------------
+ Perfect falling wedge pattern has formed for ARB, a clear breakout from this falling wedge pattern is imminent.
+ breakout from this falling wedge pattern could push the price to previous All time high.
---------------------------------------------------------------
VectorAlgo Trade Details
------------------------------
Entry Price: 0.39
Stop Loss: 0.16
------------------------------
Target 1: 0.6229
Target 2: 0.9196
Target 3: 1.1430
Target 4: 1.6343
Target 5: 2.1129
------------------------------
Timeframe: 1W
Capital: 1-2% of trading capital
Leverage: 5-10x
---------------------------------------------------------------
Enhance, Trade, Grow
---------------------------------------------------------------
Agree or Disagree with the ideas ? lets discuss in the comments.
Like and follow us for more ideas.
Best Regards,
VectorAlgo

Conslidation Box
Closed at 9.14 (23-05-2025)
Trying to break the long consolidation box.
Important Support Zone is around 8 - 8.70
Channel bottom is around 5.30 which seems
unlikely as of now because of Bullish Divergence
on weekly tf.
Upside targets can be around 11 & then around 14

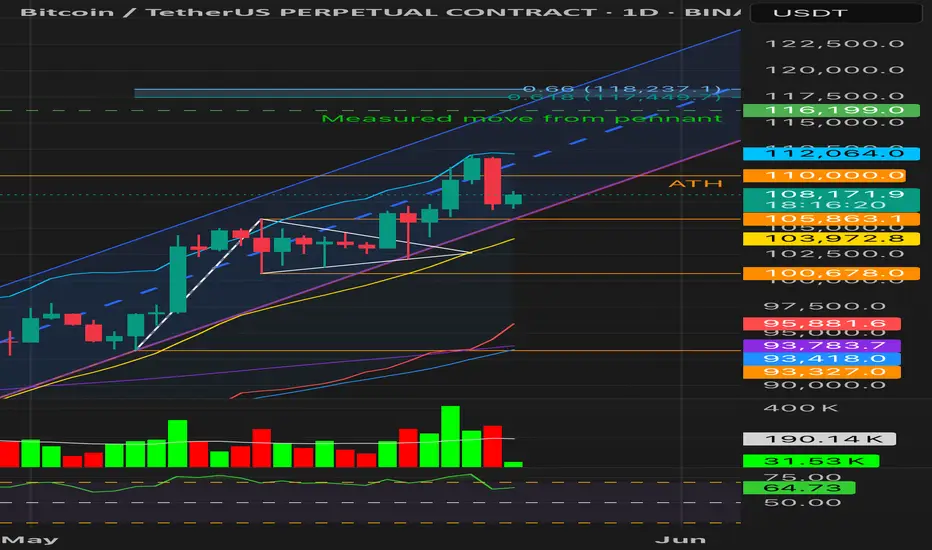
Bitcoin Breakout Under Threat or Bullish Retest?1D Chart
• Price broke above ATH (~110K) on May 22 with a +1.87% gain, backed by strong volume (~413K vs 190K avg) — signaling legitimate breakout intent.
• May 23 followed with a -3.93% bearish engulfing candle, closing back below ATH on elevated sell volume (~279K).
• Despite the rejection, the breakout bar showed no upper wick exhaustion, so not a blow-off.
• RSI = 63.26 — still bullish but curling down.
• Price is testing the channel midline; Fib extensions (117.4K–118.2K) remain unmet.
Conclusion: Initial breakout was technically valid and volume-confirmed, but price is now under threat.
Loss of 103.9K would invalidate the structure and raise distribution risks.
⸻
4H Chart
• Price closed 4 times below mid-Bollinger Band — short-term momentum has weakened.
• RSI bounced back above 50, avoiding breakdown territory.
• Volume is tapering (weekend), and price is hovering just above the previous LPS zone.
• Watching for resolution from a potential Backup (BU) retest.
⸻
Wyckoff View
• Still within Phase E of re-accumulation — unless 103–105K breaks decisively.
• Valid structure: Spring → LPS → SOS → BU(?)
• A break below structure = possible UTAD scenario
⸻
Key Levels
• Support: 105,863 / 103,986 / 100,678
• Resistance: 110,000 / 112,100 / 116,199
• Target Extension Zone: 117,449 – 118,237
NFP ANALYSIS🚀#NFP Analysis : Pattern Formation💲💲
🔮As we can see in the chart of #NFP that there is a formation inverse head and shoulder pattern and it's a bullish pattern. Also there is a perfect breakout and retest of the levels. This indicates a potential bullish move.📈📈
🔰Current Price: $0.0910
🎯 Target Price: $0.1100
⚡️What to do ?
👀Keep an eye on #NFP price action. We can trade according to the chart and make some profits. The price must close above the neckline. After that we will see a bullish move. ⚡️⚡️
#NFP #Cryptocurrency #TechnicalAnalysis #DYOR

BITCOIN Will Keep Growing! Buy!
Hello,Traders!
BITCOIN is trading in an
Uptrend and the coin made a
Great breakout of the previous
ATH which makes us super
Bullish biased so as BTC is
Making a local bearish correction
We will be expecting a bullish
Rebound from the rising support
And a further bullish move up
Buy!
Comment and subscribe to help us grow!
Check out other forecasts below too!
Disclosure: I am part of Trade Nation's Influencer program and receive a monthly fee for using their TradingView charts in my analysis.

GOLD - BULLISH MOVEHello Traders !
The Gold price formed a symmetrical triangle pattern.
The resistance line is broken !
So, I expect a bullish move🚀
_______________
TARGET: 3414🎯

GBP-USD Massive Swing Breakout! Buy!
Hello,Traders!
GBP-USD is trading in a
Strong uptrend and the
Pair made a massive
Bullish breakout of the
Key horizontal level
Of 1.3444 and went
Further up which reinforces
Our bullish bias and after
A potential pullback we
Will be expecting a
Further bullish move up
Next week
Buy!
Comment and subscribe to help us grow!
Check out other forecasts below too!
Disclosure: I am part of Trade Nation's Influencer program and receive a monthly fee for using their TradingView charts in my analysis.

Technical Analysis with Elliott Waves: A Combined ApproachHello friends, Welcome to RK Charts!
This Educational Post is based on technical analysis, specifically how to initiate analysis on a chart, and what points to consider. This is purely for Educational purposes.
This is not a trading or investing tip or advisory. Rather, it's a comprehensive guide on how to easily analyze a chart, intended for educational purposes. I hope that by reading and understanding this post, you'll gain valuable knowledge and insights. Your focused effort to understand this will surely provide you with something valuable and easy to grasp.
Let's dive in, During technical analysis, what we had observed certain points in this chart, I'm highlighting them here:
1. Resistance line breakout, where the price has closed above it.
2. The volume within that breakout.
3. The price closing above Weekly Exponential Moving Averages.
4. Elliott Wave Counts.
5. Projected Target along with Invalidation level as per Elliott Wave theory.
6. Projected Duration for Projected Targets.
Breakout of Resistance zone with Good Volume intensity:
So, friends, here we can clearly see on the chart that this is a weekly time frame chart of Shipping Corporation of India Limited. Over the last eleven months, from July 2024, the price has been falling, remaining largely bearish, but has now broken out of Curved Resistance Trendline for the first time with a bullish candle on Weekly (Closing basis), accompanied by good volume intensity.
Alongside this, the price has sustained and closed above Major EMAs:
- 50-Weekly Exponential moving average (red line plotted on the chart)
- 100-Weekly Exponential moving average (blue line plotted on the chart)
- 200-Weekly Exponential moving average (black line plotted on the chart)
on the weekly time frame.
Elliott Wave Theory:
Considering the Elliott Wave structure, if we look at it theoretically, the top it made on July 2024, was the completion of Wave III. After that, it completed Wave IV in 7 swings (WXY) and is now possibly moving higher, making higher lows. It has closed above the moving averages, broken out of the Curved Trendline, and has strong volume. So, possibly, we are unfolding an impulse Wave V.
In Elliott Wave Theory, the invalidation level means that the price should not go below that level, which in this case is the low of Wave IV at ₹130. If the price goes below that level for any reason, even by a single point, our wave counts will be invalidated, and we'll have to re-analyze the chart.
That's why we call it the invalidation level. Analysts and traders also refer to it as a stop-loss level. So, in Elliott Wave Theory, our wave counts remain valid as long as the price stays above the invalidation level and doesn't trigger it.
Now, regarding the target, if we take the measurement of Wave IV and calculate its 1.236 level, the target for Wave V should be above the high of Wave III. According to Elliott Wave Theory, the projected target for Wave V is near ₹440, which is the 1.236 Fibonacci level.
Projected Duration for Projected Targets:
In the chart analysis we conducted, where we prospectively projected a target, if everything goes right and the invalidation level is not triggered, what could be the duration of this target? It will definitely take more than a medium-term duration, maybe even a long-term duration.
This is because each candle represents a week, and we're currently looking at the weekly time frame. Since the fourth wave has just ended and the fifth wave is upcoming, it will take a long-term duration
I am not Sebi registered analyst.
My studies are for educational purpose only.
Please Consult your financial advisor before trading or investing.
I am not responsible for any kinds of your profits and your losses.
Most investors treat trading as a hobby because they have a full-time job doing something else.
However, If you treat trading like a business, it will pay you like a business.
If you treat like a hobby, hobbies don't pay, they cost you...!
Hope this post is helpful to community
Thanks
RK💕
Disclaimer and Risk Warning.
The analysis and discussion provided on in.tradingview.com is intended for educational purposes only and should not be relied upon for trading decisions. RK_Chaarts is not an investment adviser and the information provided here should not be taken as professional investment advice. Before buying or selling any investments, securities, or precious metals, it is recommended that you conduct your own due diligence. RK_Chaarts does not share in your profits and will not take responsibility for any losses you may incur. So Please Consult your financial advisor before trading or investing.

NEAR’s Pullback Zone Found — Is $4 Next?NEAR just pulled off a +50% rally from the 0.618 Fibonacci retracement at $2.224 — a strong show of force from the bulls. After that explosive move, price is now cooling off in a consolidation phase, preparing for the next leg higher.
🟢 Long Setup — Dip Before Lift?
The next high-probability long zone lies between:
$3.026 – $2.94
Possible but less likely of a deeper dip to $2.78 (0.5 Fib of the recent move)
Long entries can be laddered between $3.00 and $2.90 (even $2.80 if volatility kicks in).
Stop-Loss: Below the daily 21 EMA ($2.7344) and 21 SMA ($2.6739)
Target: $4.00
R:R: ~4:1 — clean and structured
This setup aligns with standard continuation behaviour after strong impulses — consolidation, retrace, and resume.
🔴 Short Setup (on Rejection at $4.00)
Entry: ~$4.00
Stop-Loss: Above $4.25
Target: Yearly open (~$3.65)
R:R: ~1.5:1 — not ideal, but valid on confirmation
🎯 Summary
NEAR is consolidating after a strong move — either ready to continue higher or retest deeper into Fib support
Long zone: $3.00–$2.90 (poss. $2.80)
Short zone: $4.00 (on rejection only)
Simple structure, clean risk, and nothing forced — exactly how it should be.
Sometimes, less is more. Let price show the next move. Stay ready. 📈
___________________________________
If you found this helpful, leave a like and comment below! Got requests for the next technical analysis? Let me know.

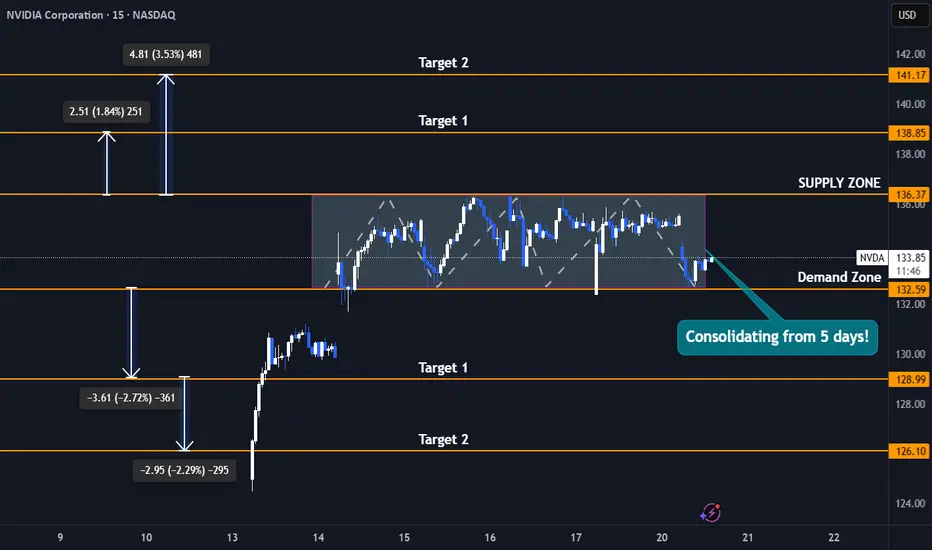
Nvidia Stock 5-Day Consolidation Breakout - Uptrend or Pullback?Trade Duration: Intraday
Trade Type: Breakout
- Nvidia is currently consolidating tightly between $132 and $136, forming a narrow range that reflects a balance between buyers and sellers unwilling to relinquish control. This range-bound action signals indecision, but it won’t last indefinitely.
- Typically, the longer the consolidation, the more significant the subsequent move. As new participants enter the market, a breakout—whether upward or downward—can trigger a powerful surge.
- This move is often amplified by breakout buyers joining in and stop-loss orders of trapped traders being triggered, creating an ideal setup for an intraday breakout trade.
- I plan to initiate either a buy or sell position depending on the breakout direction, capitalizing on the momentum generated by this tight consolidation phase.
Upside Targets : 138$ and 141$
Downside Targets : 128$ and 126$
ETH/USDT – Breaking Out After BTC!🚀 Hey Traders! 👋
If you’re finding value in this analysis, smash that 👍 and hit Follow for high-accuracy trade setups that actually deliver! 💹🔥
After BTC’s rally, it’s ETH’s turn to shine! 🔥
Ethereum has officially broken out of the descending channel on the 12H timeframe, a structure that’s been holding price down since late 2024. This breakout is significant — and here’s why:
📊 Technical Breakdown:
🔸 Broadening wedge finally broken after months of compression
🔸 Price holding well above the EMA, confirming short-term bullish momentum
🔸 Strong volume on breakout candle, suggesting genuine buying pressure
🔸 Breakout coincides with BTC’s surge — signaling altcoin rotation could be starting
📍 Key Levels:
➡️ Immediate Resistance: $2,850
➡️ Short Term Target Zone: $3,200–$3,500
➡️ Major Target Zone: $5000
➡️ Support to Watch: $2,480 (EMA + breakout retest)
💡 Why It Matters:
This move isn’t just technical — it’s psychological. ETH has been lagging BTC for weeks, and this breakout could shift trader sentiment back toward altcoins. If ETH holds above the breakout zone, we may see altcoins gain serious traction in the coming days.
📌 Strategy Note:
Look for a successful retest of the breakout zone for confirmation. A strong daily close above $2,700 could pave the way for a sustained uptrend.
What’s your ETH price prediction? Drop it in the comments and let’s ride this momentum together! 💥

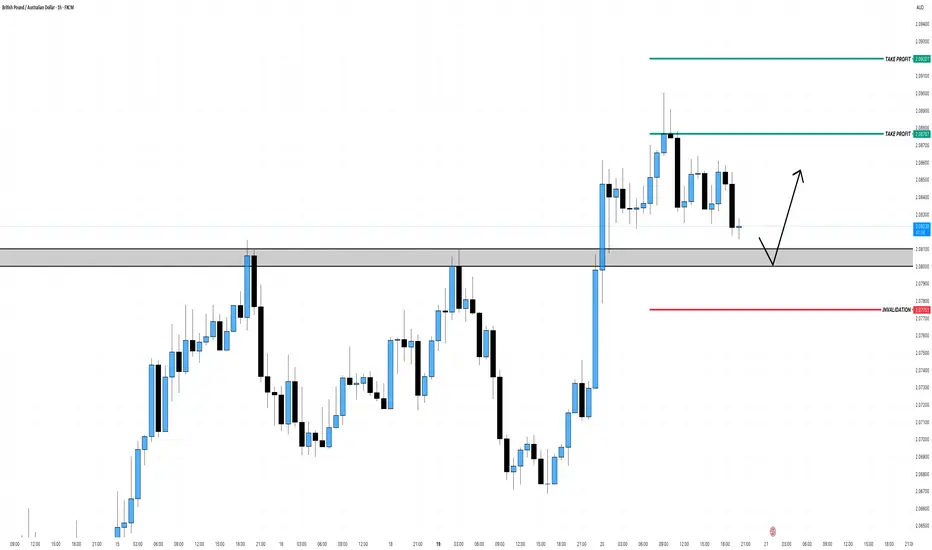
GBPAUD Bullish Break and RetestAfter weeks of consolidation, GBPAUD has broken out above key resistance at 2.0800–2.0830, flipping structure to bullish on the higher timeframes. Price is now retesting this zone.
Wait for bullish confirmation.
DOUBLED MONEY in 3 days! $6/share win for $0.50/share stop loss!🔥 +100% in 3 days ✅ $6 to $12 Swing Pick buy on Friday before market close at $6 NASDAQ:ASST
Just 3 days later it's $12 for a mega win!
And to make that much better the risk was only $0.50 per share while going for $6/share win so 1:12 risk/reward ratio

EUR-USD Potential Long! Buy!
Hello,Traders!
EUR-USD is trading in an
Uptrend and the pair made
A breakout of the key horizontal
Level of 1.1300 which is confirmed
So now the price is consolidating
Above the new support
And after a potential retest
Of the support level we are
Likely to see a further
Bullish move up
Buy!
Comment and subscribe to help us grow!
Check out other forecasts below too!
Disclosure: I am part of Trade Nation's Influencer program and receive a monthly fee for using their TradingView charts in my analysis.

CESC Ltd – Short-Term Breakout Idea|Target: ₹171.00 CMP: ₹165.70
Recommended Buy Range: ₹164.50 – ₹165.00
Target: ₹171.00 🎯
Stop Loss: ₹161.50 🛡️
Timeframe: 15 min & 1H
Risk-Reward: ~1.4:1
Type: Momentum Breakout / Swing Trade
🔍 Technical Analysis:
✅ EMA Cross (9/13) bullish crossover
✅ Price trading above EMA-26
✅ RSI at 65 – bullish, not overbought
✅ BB %B around 1.0 – strong upper band breakout
✅ Volume spike supports the move
Watch for a strong close above ₹167 to confirm momentum toward ₹171.
For Education Purposes Only

AUDJPY Retest Watch for 95AUDJPY has successfully broken out of a long-standing descending trendline on the daily timeframe, signaling a potential trend reversal after a prolonged bearish phase. This breakout was followed by a classic retest, where price pulled back to validate the previous resistance line now acting as new support.
Key Technical Observations:
The trendline, connecting multiple swing highs since late 2023, has been clearly violated to the upside.
A minor consolidation followed the breakout, which now appears to be testing the broken trendline.
The pair is forming higher lows, suggesting bullish intent and buyer interest on the retest.
Bullish Scenario:
Entry Zone: Around 92.00–92.50, during or after the retest confirmation.
Target 1: 95.00 (previous swing high)
Target 2: 96.68 (Fibonacci extension and prior horizontal resistance)
Target 3: 101.37 (major resistance from late 2023)
Stop Loss: Below 91.20 or under the retest low (safe zone: around 90.80).
Alternative (Bearish) Scenario:
If the price fails to hold above the broken trendline and closes below 91.00, the breakout could be a false move.
In that case, downside pressure may push the price back toward 88.14 support.
Technical Context:
This setup is based on trendline breakout and retest, where a break and successful retest of a long-term descending trendline often leads to a bullish continuation. In essence, the structure of the chart reflects a potential trend reversal.

GOLD WILL KEEP GROWING|LONG|
✅GOLD made a strong
Breakout of the key horizontal
Level of 32.60$ and kept on growing
Which reinforces our bullish
Bias and makes us expect
A further bullish move up
LONG🚀
✅Like and subscribe to never miss a new idea!✅
Disclosure: I am part of Trade Nation's Influencer program and receive a monthly fee for using their TradingView charts in my analysis.
