ETHEREUM Wedge Breakout! Sell!
Hello,Traders!
ETHEREUM was trading in an
Uptrend but then the coin
Formed a bearish wedge pattern
And we are now seeing a bearish
Breakout so we are locally
Bearish biased and we will be
Expecting a long awaited
Bearish correction
Sell!
Comment and subscribe to help us grow!
Check out other forecasts below too!
Disclosure: I am part of Trade Nation's Influencer program and receive a monthly fee for using their TradingView charts in my analysis.
Breakout

USDCAD Makes Retest At 200 EMA After Bull Trap BreakoutOANDA:USDCAD here on the 1Hr Chart has printed an Ascending Channel and Bears have made a Breakout!
Price currently looks to be on its way to retesting the Breakout of the Channel with the 200 EMA and Upper Bollinger Bands sitting at the Rising Support adding some heavy Bearish Pressure.
Fundamentally, BOC will be releasing GDP m/m ( Gross Domestic Product ) numbers tomorrow morning at 0730 AM CST with analysts forecasting a .3% Increase at .1% with Previous being -0.2%.

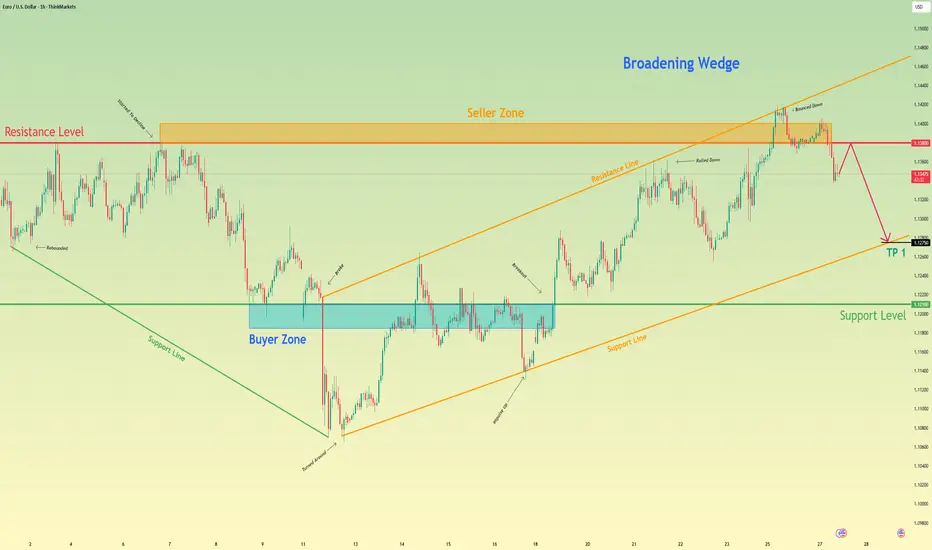
Euro can reach resistance line of pennant and then dropHello traders, I want share with you my opinion about Euro. The price of the Euro had been gradually declining, forming a series of lower highs and finding support around the 1.1070 - 1.1025 buyer zone. This pullback created the groundwork for a new structure to form as volatility narrowed and momentum shifted. After reaching a local bottom, the market rebounded and began constructing an upward pennant, a classic consolidation pattern that often precedes continuation or reversal, depending on breakout direction. Within this pennant, price respected both trendlines, each approach to the upper resistance was followed by a rejection, and each touch of the support line triggered a bounce. Now, the Euro is moving closer to the resistance line of the pennant once again. Given the overall structure, proximity to the 1.1415 resistance level, and prior reactions from the seller zone, I think the Euro can reach the top boundary and then continue to decline, potentially breaking below the pattern. That’s why I set my TP at 1.1150 points, targeting a move toward the support level and exit from the pennant. Please share this idea with your friends and click Boost 🚀
Disclaimer: As part of ThinkMarkets’ Influencer Program, I am sponsored to share and publish their charts in my analysis.

GOLD - Price can exit from triangle and continue to fall nextHi guys, this is my overview for GOLD, feel free to check it and write your feedback in comments👊
Some days ago price traded inside a triangle, where it made a strong upward impulse from support line to resistance line.
Price broke $3185 and $3345 levels, after which it started to decline from resistance line, making gaps.
In a short time, Gold broke $3345 level again and fell to support line triangle, after which it exited from this pattern.
Next, price started to trade inside another triangle, which it broke the $3345 level two times and then dropped to the support area.
Later, Gold turned around and, in a short time, rose to the resistance area, but recently made a correction.
In my mind, Gold can exit from this triangle pattern and then continue to fall to $3220
If this post is useful to you, you can support me with like/boost and advice in comments❤️
Disclaimer: As part of ThinkMarkets’ Influencer Program, I am sponsored to share and publish their charts in my analysis.

AUD_NZD BEARISH BREAKOUT|SHORT|
✅AUD_NZD made a bearish
Breakout of the key horizontal
Level of 1.0783 and the breakout
Is confirmed so we are locally
Bearish biased and we will be
Expecting a further bearish
Move down
SHORT🔥
✅Like and subscribe to never miss a new idea!✅
Disclosure: I am part of Trade Nation's Influencer program and receive a monthly fee for using their TradingView charts in my analysis.

EURGBP breakout down trend bullish strong now from demand zone🚨 EUR/GBP Trade Setup – Bullish Breakout Alert! 🚨
Pair: EUR/GBP
Timeframe: 30-Minute (M30)
📈 EUR/GBP has officially broken out of its downtrend, confirming a bullish reversal on the 30-minute chart. We're now watching price action closely around the demand zone @ 0.83800 – ideal entry level for long positions.
💡 Technical Targets:
🎯 1st Target: 0.84100
🎯 2nd Target: 0.84300
🎯 3rd Target: 0.84600
🔒 Risk Management:
Always trade with a well-placed stop-loss just below the demand zone. Monitor price action for confirmation before entering.
Let’s ride the trend with smart entries and precise targets. 📊💰
— Livia 🤍📉📊
#ForexTrading #EURGBP #TechnicalAnalysis #BreakoutStrategy #SmartMoney #FXSignals #LiviaTrades

CAD-CHF Bearish Wedge! Sell!
Hello,Traders!
CAD-CHF formed a bearish
Wedge pattern and now we
Are seeing a powerful breakout
Which is confirmed so we are
Locally bearish biased and
We will be expecting a
Further bearish move down
Sell!
Comment and subscribe to help us grow!
Check out other forecasts below too!
Disclosure: I am part of Trade Nation's Influencer program and receive a monthly fee for using their TradingView charts in my analysis.

USOIL - Bullish Double BottomHello Traders !
The USOIL price formed a double bottom pattern.
Currently, The neckline is broken !
So, I expect a bullish move🚀
_______________
TARGET: 63.49🎯

SIGN/USDT – Bullish Breakout Alert!🚀 SIGN Breakout Alert – 80% Potential Incoming?! 👀🔥
Hey Traders! If you're all about high-conviction plays and real alpha, smash that 👍 and tap Follow for more setups that actually deliver! 💹💯
SIGN has just broken out from a symmetrical triangle after consolidating tightly for weeks. The breakout is supported by strong volume and a solid bounce from the base of the structure.
Entry: $0.082 - $0.085 (post-breakout zone)
Targets:
• $0.095
• $0.112
• $0.134
• $0.159
Stop-loss: Below $0.076
Risk-Reward: Over 6:1 — Excellent setup for trend traders.
This move could mark the beginning of a strong upside wave. Keep it on your radar and manage your risk accordingly!
Let me know your thoughts or if you're riding this one too!

Euro may grow to resistance level and then drop to 1.1275 pointsHello traders, I want share with you my opinion about Euro. After forming a strong upward move from the buyer zone (1.11850–1.1210), the price rose sharply, broke the mid-range resistance, and entered the seller zone between 1.1380 and 1.1400. Once it reached the upper boundary of the broadening wedge, the price bounced down from resistance at 1.1380. Now the price is trading inside a broadening wedge, showing signs of a potential reversal. After failing to hold above resistance, the Euro started to decline from the seller zone, confirming selling pressure. The current movement points to a correction within the wedge structure. I expect the Euro will continue falling toward 1.1275, my TP 1, where the support line of the wedge coincides with the upper boundary of the previous buyer zone. This zone has already shown strong reactions before and could act as a short-term reversal area. Given the recent rejection from resistance, the broadening wedge formation, and return from the seller zone, I remain bearish and anticipate further decline. Please share this idea with your friends and click Boost 🚀
Disclaimer: As part of ThinkMarkets’ Influencer Program, I am sponsored to share and publish their charts in my analysis.
CADJPY - NEW BREAKOUT !Hello Traders !
The CADJPY price formed a descending channel.
Currently, The resistance line is broken !
So, I expect a bullish move🚀
_______________
TARGET: 105.390🎯

AAPL summer breakoutFriday 5/23, Tues 5/27, Wed 5/28 - bullish
Targets up to 225-230 maybe... not all this week (summer)
*looks like AAPL has already moved toward the 207-208 level overnight.
*hope we are blessed with a pullback to buy back up. 202-203
*NVDA earnings propping market = good
*Catalyst conversations mounting:
finance.yahoo.com

USDJPY Breakout the down trend bullish strong now📈 FX:USDJPY Technical Update
Timeframe: 1H
By Livia 💹
FX:USDJPY has officially broken out of the downtrend, confirmed by a strong bullish candle — momentum is on the buyers' side.
✅ Entry Zone: Support retest at 144.000
🎯 Targets:
• TP1: 145.500
• TP2: 148.300
🔍 Price action and structure support continuation to the upside. Wait for clean confirmation on the retest before entering for maximum probability.
Trade smart. Risk managed.
#Forex #USDJPY #PriceAction #Breakout #TradingSetup #LiviaFX

GBPJPY up trend and resistance breakout bullish strong now📈 GBPJPY Trade Alert – Strong Bullish Momentum!
Timeframe: 1H
Trend: Uptrend 🔼
Status: Resistance Breakout Confirmed 💥
OANDA:GBPJPY has broken through key resistance at 194.200, confirming a bullish continuation pattern. Price is now retracing back to the breakout zone — a textbook retest-entry opportunity for swing and intraday traders. 🧠
🔹 Entry Zone: 194.200 (Previous Resistance Turned Support)
🔹 Technical Target #1: 196.200
🔹 Trend Bias: Bullish
🔹 Confirmation: Breakout + Retest Setup
🔹 Risk Management: SL just below 193.800 (structure support)
📊 This setup aligns with momentum and market structure — watch for bullish candlestick confirmation before entering. Patience pays!
Trade smart,
Livia 😉✨
#GBPJPY #ForexSetup #BreakoutRetest #PriceAction #ForexSignals

GOLD Bearish Breakout! Sell!
Hello,Traders!
GOLD made a bearish
Breakout of the key horizontal
Level of 3285$ which also
Seems to have been a neckline
Of the small H&S pattern so
We are locally bearish biased
And we will be expecting a
Further bearish move down
Sell!
Comment and subscribe to help us grow!
Check out other forecasts below too!
Disclosure: I am part of Trade Nation's Influencer program and receive a monthly fee for using their TradingView charts in my analysis.

ASTRAMICRO READY FOR BLAST!Astra Micro is in a strong uptrend on the daily chart, steadily forming higher highs and higher lows. On the lower time frame, the stock had gone through a phase of consolidation but has now broken out of it with strong volume support. The current setup presents a limited downside risk of around 5 per cent, while offering a potential upside of 12–15 per cent.

INOX WIND BREAKOUT Target Levels
- Short-Term Target: 204–211.
- Medium-Term Target: 261–343
Stop-Loss Levels
- Short-Term Stop Loss: 184.2 near immediate support
- Medium-Term Stop Loss: 157.1–153.8 strong support zone
- Long-Term Stop Loss: 170.6 major trend support

Bitcoin Hits New All-Time Highs — Rally Targets $130K+Bullish Momentum Accelerates:
Bitcoin has reached new all-time highs, confirming a strongly bullish technical outlook. Accelerating upside momentum and growing investor confidence are driving the current rally.
Breakout Confirmation:
A decisive breakout from a broadening wedge pattern has unlocked potential targets in the $130,000–$135,000 range, signaling a likely continuation of the uptrend.
Key Support Levels:
With Bitcoin now trading well above $106,000, the previous resistance at $108,000 is expected to act as strong support during any pullbacks — providing a clear risk threshold for traders.
Favorable Risk-Reward Setup:
This alignment of:
Strong momentum
Completed consolidation
Successful breakout
...creates a compelling risk-reward scenario and reinforces the case for continued upside in the current bull cycle.
Bitcoin may just be getting started on its next leg higher. 🚀🔥
#Bitcoin #BTC #AllTimeHigh #Crypto #TechnicalAnalysis #Bullish #Breakout #MarketMomentum #CryptoTrading #CryptoMarket

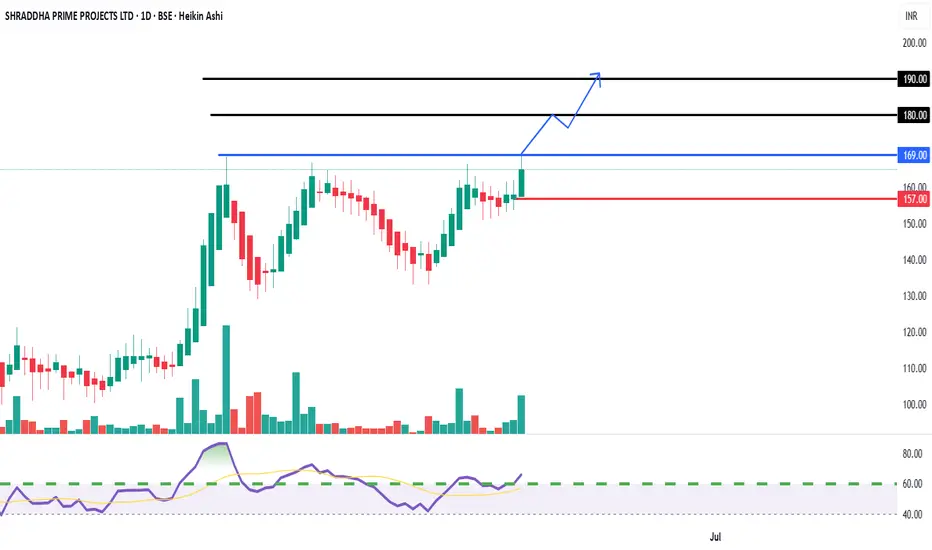
On the Cusp of a Breakout - Short-Term Buy OpportunityEntry Price:
Aggressive Entry: Around CMP (₹165.00) with a strict stop loss, anticipating the breakout.
Conservative Entry: On a confirmed breakout and close above ₹170 on a daily basis.
Target Price 1 (T1): ₹180
Target Price 2 (T2): ₹190
Stop Loss (SL): ₹157 (Closing basis below immediate support)
DISCLAIMER
This report is prepared for informational purposes only and is not intended as a solicitation or an offer to buy or sell any securities. The information contained herein is based on technical analysis and publicly available data, which are believed to be reliable, but no guarantee is made as to their accuracy or completeness. Investing in equities involves risks, and investors should conduct their own due diligence and consult with a financial advisor before making any investment decisions. Past performance is not indicative of future results.
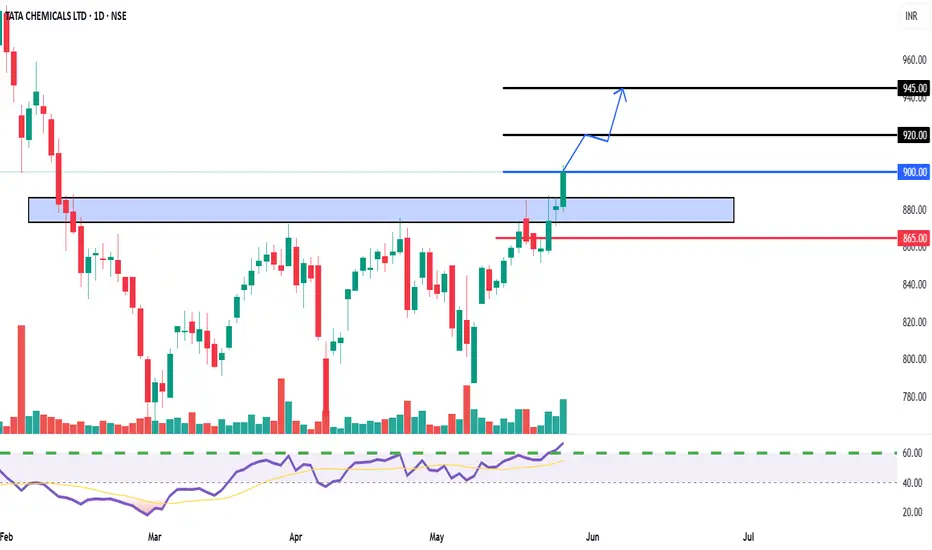
TATA CHEMICALS Breakout Confirmed - Buy on MomentumEntry Price:
Aggressive Entry: Around CMP (₹900-₹905)
Conservative Entry: On a retest of the breakout zone (₹875-₹885), if the opportunity arises.
Target Price 1 (T1): ₹920
Target Price 2 (T2): ₹945
Stop Loss (SL): ₹865 (Closing basis below the breakout zone and previous support)
Cautiously Bullish - Approaching Long-Term Resistance.Entry Zone: We recommend initiating a BUY position in TCGSRAAC only upon a decisive and sustained breakout above the major descending trendline (around ₹115 - ₹118). A daily close above this level with good volumes would be a strong confirmation.
Target 1 (T1): ₹125
Target 2 (T2): ₹132
Target 3 (T3): ₹140+ (If momentum sustains significantly post-breakout)
Stop Loss (SL): ₹105 (Strictly on a daily closing basis, for a breakout entry)
Rationale:
Long-Term Resistance Test: The stock is currently testing a significant descending trendline that has been acting as a major resistance for over several months. A successful breakout would signal a substantial shift in the long-term trend.
Support from Accumulation Zone: The stock has recently bounced from a strong demand zone around ₹80 - ₹88 (highlighted in blue), indicating underlying buying interest.
RSI Rising: The Relative Strength Index (RSI) has recently crossed above the 50-mark and is trending upwards, suggesting a buildup of bullish momentum as the price approaches resistance.
Volume Activity: While recent volumes are moderate, a significant surge in volume on the day of the potential breakout would be crucial for confirmation.
Risk-Reward: A breakout offers a good risk-reward setup for short-term traders, targeting the next set of resistance levels.
Key Risk: Failure to break above the major descending trendline could lead to a reversal and a fall back towards the ₹95 - ₹100 levels. A sustained daily close below ₹105 would invalidate the bullish breakout attempt.
Disclaimer: This report is for informational purposes only and does not constitute financial advice. Investors should conduct their own due diligence and consult with a qualified financial advisor before making any investment decisions. Equity investments are subject to market risks.
For Education Purposes Only

GUN/USDT: FALLING WEDGE BREAKOUT ALERT!!🚀 GUN Falling Wedge Breakout – 35%+ Potential Incoming?! 👀🔥
Hey Traders! If you're all about high-conviction plays and real alpha, smash that 👍 and tap Follow for more setups that actually deliver! 💹💯
GUN has officially broken out of the falling wedge structure on the 2H timeframe — a classic bullish reversal pattern. 🚨
Right now, it's retesting the breakout zone, which is a key confirmation step before the next leg up. If this retest holds, we could see a strong continuation move soon.
📊 Technical Setup:
✅ Falling wedge breakout
🔄 Retesting resistance as new support
🎯 Targets:
TP1: $0.053
TP2: $0.057
TP3: $0.061
TP4: $0.067
🛑 Stop-Loss: Below $0.046
⚙️ Leverage: 5x–10x (use proper risk management)
This is the make-or-break moment — if the retest holds, GUN could fire off big. Stay sharp.

1INCH Inverse Head & Shoulders (1H)BINANCE:1INCHUSDT completed an Inverse Head & Shoulders pattern, clearly visible on the hourly timeframe.
Key Levels
• Left Shoulder: $0.223
• Head: $0.218
• Right Shoulder: $0.223
• Neckline: $0.232
• Measured Target: $0.245 (aligned with local high)
Status
Breakout has already occurred, activating the target.
Next Steps
It may be too late to chase, but a retest of the neckline as support (~$0.232) could offer a compelling long entry.
Invalidation Levels
• Early Invalidation: Break below $0.232
• Full Invalidation: Break below the right shoulder at $0.223
