GMDC, Long 1D, Breakout, VolumesGMDC has shown a good volume in the stock today and has taken support from the previous low. If it breaks its recent high of 428 with Bullish candlestick patterns like Bullish Engulfing, Hammer & Inverted Hammer, Piercing Line, Morning Star, Three White Soldiers, Tweezer Bottoms or Bullish Harami, then take a long trade on this stock.
Entry: 428 (on Bullish candlestick pattern)
Target1: 445
Target2: 450 till 480.
Breakout

EURUSD major resistance breakout bullish strong Readmore...📊EURUSD Analysis – 1H Timeframe
EURUSD has broken out of the descending channel with strength, shifting structure and showing clear bullish intent
📌 Breakout Confirmed:
✅ Major resistance at 1.16900 broken with strong momentum — now acting as support
Buy position activated from the 1.16900 breakout level
🎯 Next Resistance Targets / Supply Zones:
🔹 1.17200
🔹 1.17500
🔹 1.17600
Watching for reaction at these levels — trend continuation likely as long as structure holds
🧠Always follow your trading plan and risk rules — markets don’t promise, they move!
What’s your take on EURUSD’s breakout? Drop your thoughts below
#eurusd
👋Regards from expert Team

XAUUSD major resistance breakout below 3375 level Readmore...📊XAUUSD Gold Analysis – 4H Timeframe
Gold is respecting the bullish ascending channel on the 4H, with strong momentum continuing after a breakout above 3375 – a major resistance now turned into key support.
Retracement Entry Activated:
✅Entry taken at the 3375 breakout level – now acting as strong demand
🛑Stop Loss:
Placed below at 3323, aligned with the bullish order block (OB) for added protection
🎯Next Resistance Targets / Supply Zones:
🔹 3392
🔹 3404
🔹 3440 [ /b]
📌Watching price reaction at each level for signs of exhaustion or continuation
🧠Always manage risk and follow your plan – no guarantees in the market!
Share your thoughts below!
#gold #xauusd
👋Regards from _expert Team_

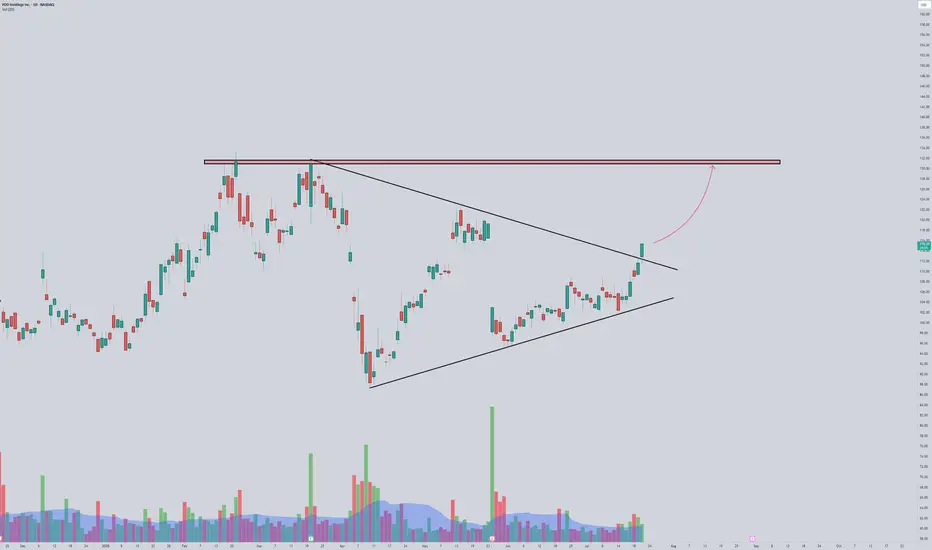
PDD Monster breakoutThis chart looks insanely good.
To go with the breakout there was today a 1.5M order for November, 135c.
I am looking to buy dips on this name!
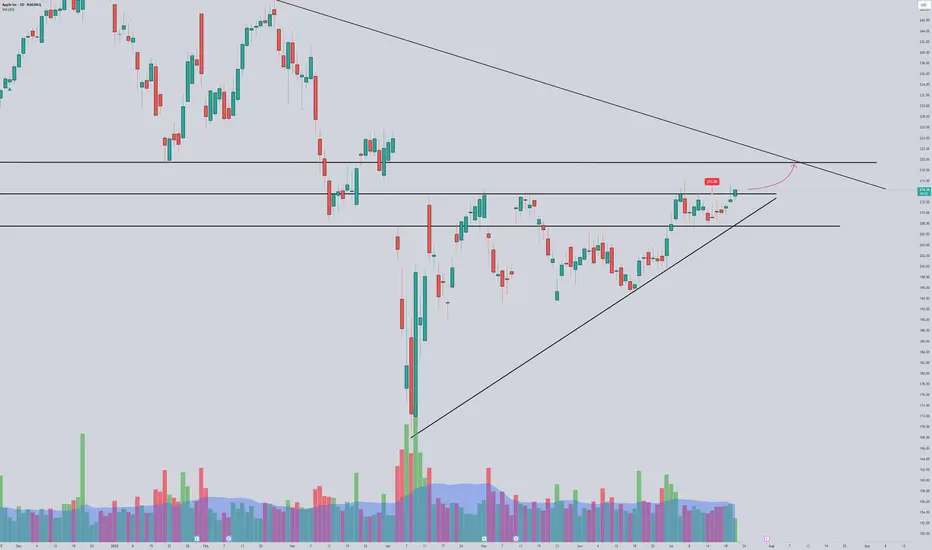
AAPL next leg up?A daily close above 213.75 could set AAPL to move towards 220
We are retesting some strong resistance at 215, and above it we could see price moving faster to retest trendline.
Keeping this on the watch as ERs is not far and we can see a pre run
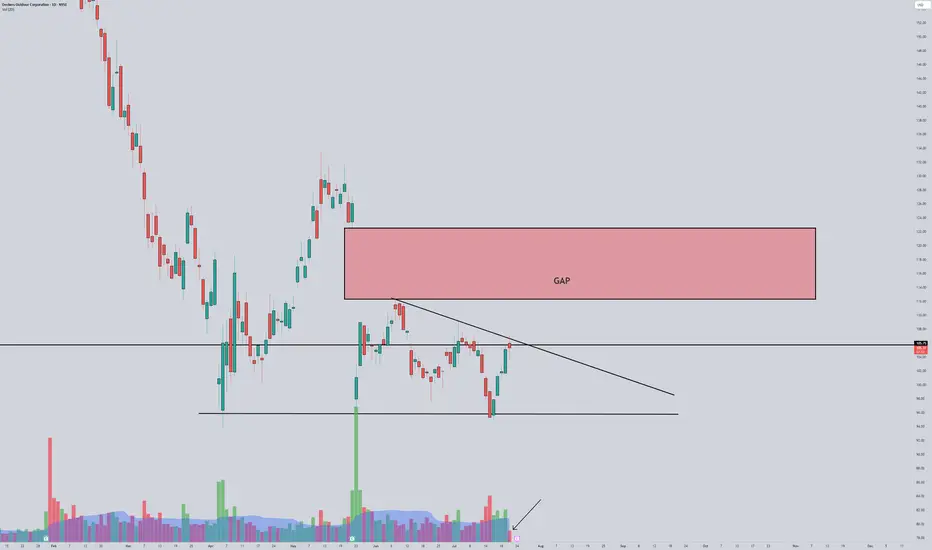
Intriguing setupOn 7/21 a OTM call flow came in for 114c expiring this Friday July 25th
Almost $130k in calls on a strike that has very low OI.
We have a beautiful gap above and a possible flag break in very low volume today.
Also, ER on thursday.
Do they know something??
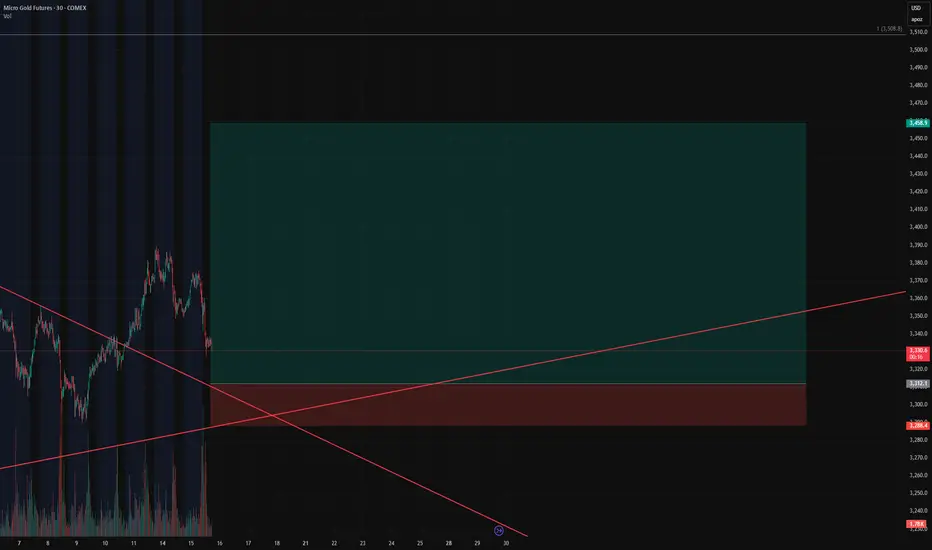
Gold Bulls Loading Up – Our Short Squeeze Trigger is Set!🚨 Gold Bulls Loading Up – Our Short Squeeze Trigger is Set!
We’re flipping the script on COMEX_MINI:MGC1! After a prolonged downtrend and textbook wedge compression, our breakout long is LIVE – but not without trapping the late shorts first.
💥 Entry: $3,312.1
🛑 Stop: $3,288.4
🎯 Target: $3,458.9
🧮 Risk/Reward: 6.19
Price just bounced at the retest of the wedge apex, and volume is confirming the move. If this holds, we’re riding momentum all the way up – and letting short pressure fuel the breakout.
📈 Trendline breached.
⏳ Time compression converging.
⚠️ If you’re still short, watch your stops!
NYKAA<>BreakoutA breakout is occurring with increasing volume. A high-volume close above the 221-222 level would confirm the breakout, potentially from a Cup & Handle pattern.
Keeping on radar.

Denta Water & Infra Solutions Ltd <>Returns Chart shared on July 16th has already yielded a 20%+ return. Analysis suggests the stock should consolidate at its current high level after the recent steep rise, followed by a potential breakout.

Gold Sees Mild Increase as USD WeakensGold ended Friday's session with a slight increase, regaining the 3350 USD level and recovering over 100 pips by the end of the day.
The weakening of the US Dollar (USD) allowed XAU/USD to rise modestly. Concerns about US President Donald Trump's erratic trade policies and their potential impact on the global economy further supported the precious metal.
In the short term, the technical chart shows gold breaking out of the downward channel and starting an upward wave. The price is currently adjusting at 3350 USD, which coincides with the 0.618 Fibonacci retracement level and the EMA zone, suggesting the potential for further price increases from this level, with targets towards key resistance levels.
Key resistance levels: 3160, 3172, and 3378 USD.
Support zones: 3350, 3340, 3331 USD.
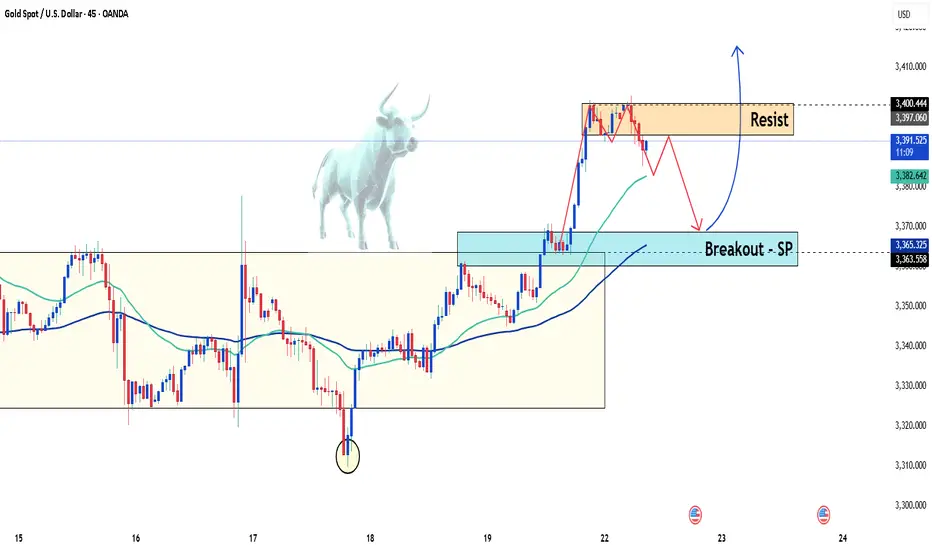
Gold rallies to 4-week high as dollar and yields tumbleHello traders, what are your thoughts on gold today?
Gold prices are heating up again in the global market as the US dollar weakens and Treasury yields drop. At the time of writing, gold has surged by 50 dollars, reaching 3,390 USD per ounce — its highest level in four weeks.
The sharp decline in the US dollar is one of the main drivers behind gold’s impressive rally. The USD Index, which had risen significantly last week, lost momentum and fell sharply in overnight trading. Meanwhile, the yield on 10-year US Treasury bonds has dropped to around 4.3%, down from recent highs, increasing gold's appeal as a non-yielding asset.
Market sentiment is also being shaped by broader macroeconomic factors. Crude oil futures have dipped slightly, trading around 67 USD per barrel, reflecting investor caution amid global economic uncertainty. These combined forces have created a favorable environment for gold's strong upward movement.
If the dollar continues to weaken and bond yields remain low, gold could sustain its bullish trend. However, traders should remain alert to potential volatility driven by upcoming US Federal Reserve policy moves and key economic data releases, such as inflation reports and GDP growth figures, which may impact gold's trajectory.
GBPUSD new breakout from descending channel bullish strong 📊GBPUSD Analysis – 4H Timeframe
GBPUSD has broken out of the descending channel with a strong bullish candle, signaling a potential shift in structure and bullish momentum
📍 Key Support Zone:
✅ Buy activated from 1.34400 – now acting as a solid demand area after breakout
🛑 Stop Loss:
Set below at 1.33800, aligned with the bullish order block for added protection
🎯 Next Resistance Levels / Profit Zones:
🔹 1.36000 – first supply zone
🔹 1.36700 – short-term resistance
🔹 1.37500 – major bullish OB target zone
🧠Trade with structure, manage risk, and follow your plan – no emotions, just execution
Share your view on GBPUSD below
#gbpusd

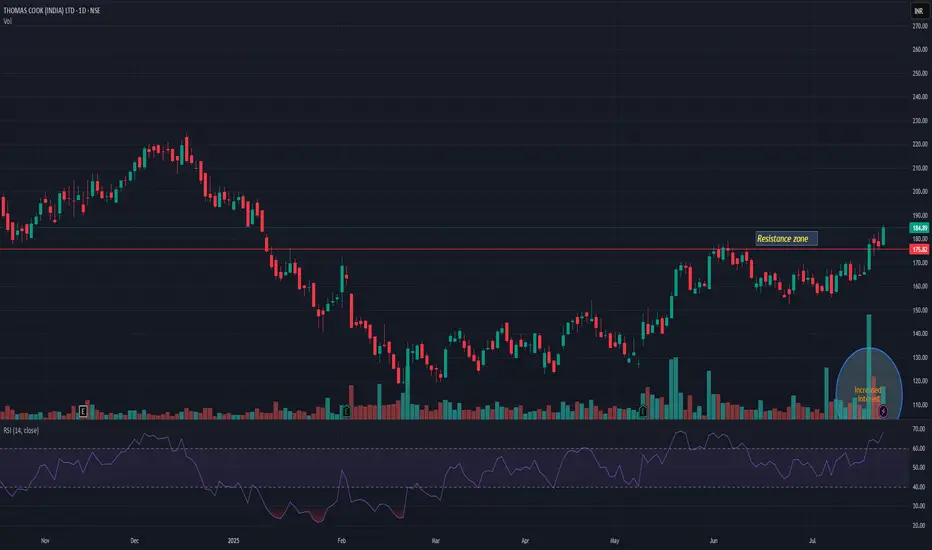
THOMASCOOKTHOMASCOOK has broken previous resistance level. Market participation is also increased with breakout. It may resist nr 210-12 level. Closing below 175 may change my view. Keep it on radar.
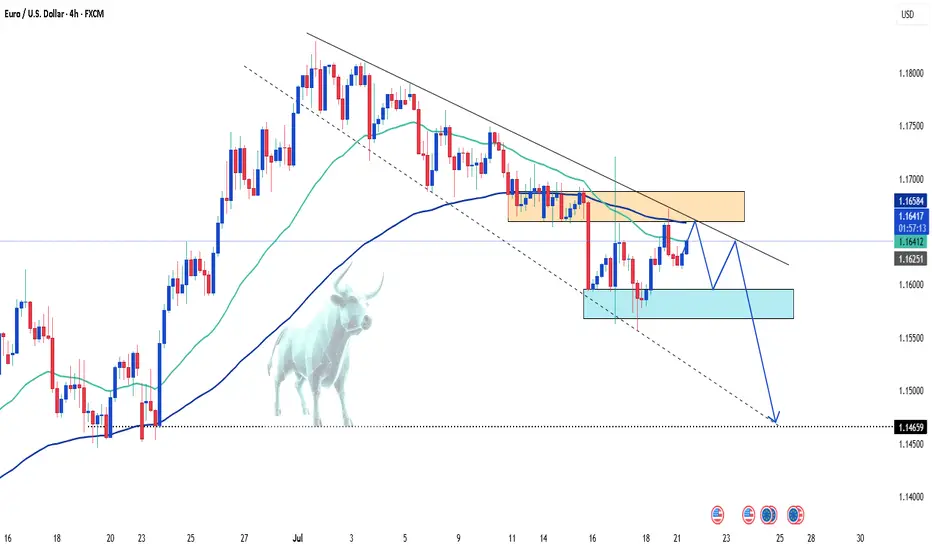
EUR/USD: Bearish Trend in FocusHello everyone, what are your thoughts on EUR/USD?
From my personal analysis, it's clear that EUR/USD is extending its downtrend. The pair is trading around 1.164 and is under pressure from sellers after breaking below both the EMA 34 and EMA 89, with EMA 34 already turning downward — a classic bearish signal.
On the macro side, the European Central Bank is set to announce its monetary policy decision on Thursday. Meanwhile, U.S. President Donald Trump's ongoing trade tensions may add further uncertainty to the market. This corrective downtrend in EUR/USD could very well continue in the weeks ahead.
What do you think — will EUR/USD keep falling?
USD/JPY Drops as Market Awaits Powell's RemarksIn today’s trading session, the USD/JPY pair is showing renewed weakness, currently trading around 147.76 — down more than 0.68% from the previous session. The decline is driven by falling U.S. Treasury yields and cautious investor sentiment ahead of an upcoming speech by Federal Reserve Chair Jerome Powell, which is weighing on the U.S. dollar.
From a technical perspective, USD/JPY has broken its short-term uptrend and is approaching a key support level at 147.60. If this level fails to hold, the bearish momentum could extend further.

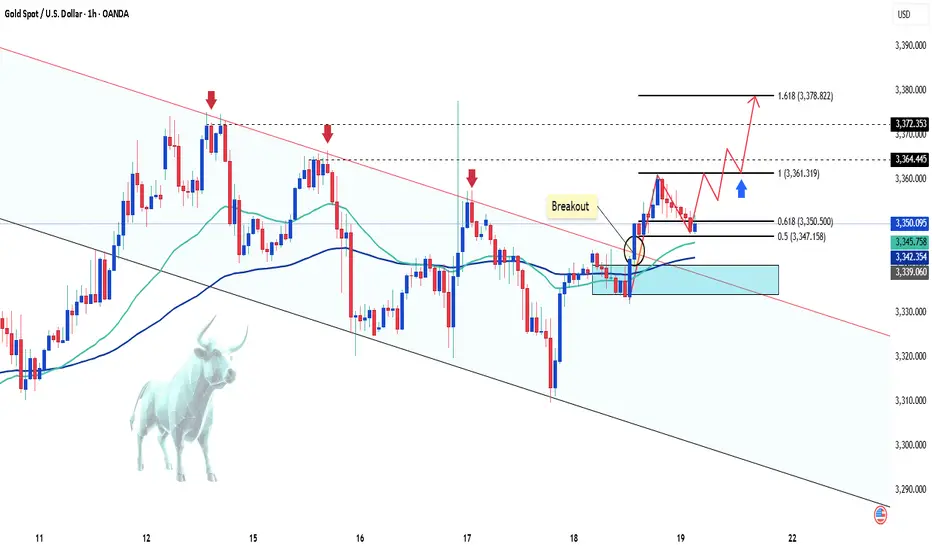
Latest Gold Price Update TodayHello everyone, what do you think about the price of gold today?
As the new week begins, gold continues the upward trend started at the end of Friday’s session. As of now, the precious metal is trading around 3356 USD, with the uptrend still being supported.
From a carefully analyzed technical perspective, gold successfully broke out of the downward channel, taking advantage of the weakening USD. The price increase is convincing in the short term, especially after testing and confirming the previous breakout as a new support zone (around 3345 USD).
The upward target is expected to continue, with key levels to watch being 3372 USD and the H4 resistance at 3390 USD.
What do you think about the price of gold today? Feel free to share your thoughts in the comments!
Good luck!

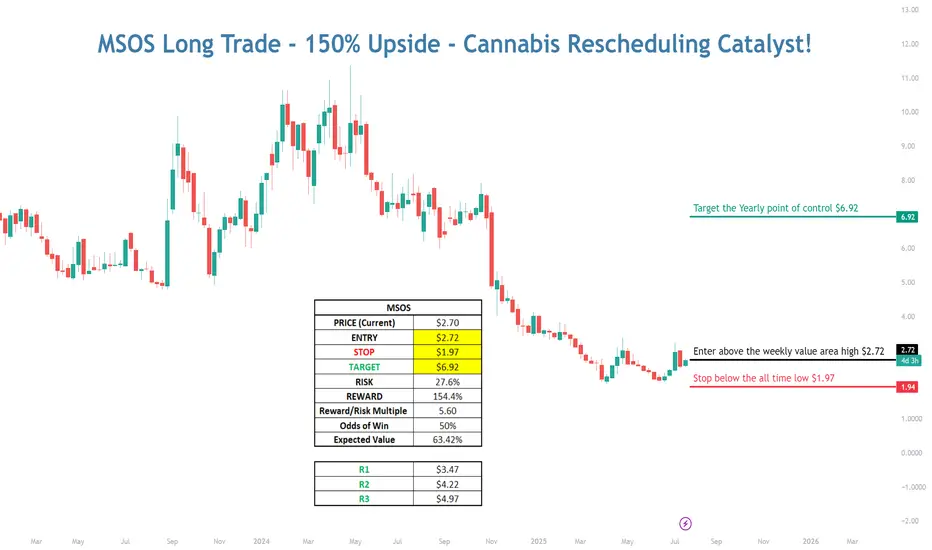
MSOS Long with 150% Upside - Cannabis Rescheduling Catalyst💠 Catalyst : Cannabis is currently classified as a schedule I drug alongside heroin, bath salts, and synthetic opioids that kill thousands every year — all while being safer than Tylenol and legal in over half the country. Cannabis is likely to be rescheduled to a schedule III drug soon after Terry Cole is confirmed as the head of the DEA. The vote to confirm him is expected to take place...TODAY
As a schedule I drug, cannabis companies can’t deduct regular business expenses for tax purposes, have limited access to banking, must transact with customers in all cash, and US multi-state operators are unable to list on the major US exchanges.
Terry Cole will be confirmed as the new head of the DEA, and when he is confirmed, the stalled process to reschedule cannabis from a schedule I to a schedule III drug should resume. If cannabis is rescheduled, that will pave the way for further research, destigmatize it, and open the door to banking and uplisting of US multi-state operators to the major exchanges in the near future.
This trade capitalizes on the fact that investors are not positioned for reform and further positive catalysts. The worst-case scenario is priced into the MSOS ETF, and when good news on rescheduling hits the tape, that should start a NEW Bull market in the MSOS cannabis stocks.
💠 Technical Setup:
Bear Market
• Multi-year bear market throughout the entire Biden administration on promises to reschedule that were never followed through on
• Capitulation when Trump won the election on the prospect of potentially another 4 years of no reform
Bearish to Bullish Technical Transition!
• LT Stage 1A Bottom Signal (Price > 50D SMA)
• ST Stage 2A Breakout (First day Price > 10D EMA and 20D SMA)
• Hourly Chart – Breaking out above Weekly Value Area
• Daily Chart – Trading above the Monthly Value Area
• Overlapping prior monthly value areas in sight!
• VPOC in sight!
• Weekly Chart – Targeting a retest of the Yearly POC
💠 Trade Plan
ENTRY: $2.72 (Break above weekly value area high)
STOP: $1.97 (Below the prior all-time-low)
TARGET: 6.92 (A retest of the yearly point of control from 2024)
RISK: 27.6%
REWARD: 154.4%
R/R Multiple: 5.6X
Probability of Win: 50%
Expected Value: 63.42%

MSOS Long with 150% Upside - Cannabis Rescheduling Catalyst💠 Catalyst: Cannabis is currently classified as a schedule I drug alongside heroin, bath salts, and synthetic opioids that kill thousands every year — all while being safer than Tylenol and legal in over half the country. Cannabis is likely to be rescheduled to a schedule III drug soon after Terry Cole is confirmed as the head of the DEA. The vote to confirm him is expected to take place...TODAY
As a schedule I drug, cannabis companies can’t deduct regular business expenses for tax purposes, have limited access to banking, must transact with customers in all cash, and US multi-state operators are unable to list on the major US exchanges.
Terry Cole will be confirmed as the new head of the DEA, and when he is confirmed, the stalled process to reschedule cannabis from a schedule I to a schedule III drug should resume. If cannabis is rescheduled, that will pave the way for further research, destigmatize it, and open the door to banking and uplisting of US multi-state operators to the major exchanges in the near future.
This trade capitalizes on the fact that investors are not positioned for reform and further positive catalysts. The worst-case scenario is priced into the MSOS ETF, and when good news on rescheduling hits the tape, that should start a NEW Bull market in the MSOS cannabis stocks.
💠 Technical Setup:
Bear Market
• Multi-year bear market throughout the entire Biden administration on promises to reschedule that were never followed through on
• Capitulation when Trump won the election on the prospect of potentially another 4 years of no reform
Bearish to Bullish Technical Transition!
• LT Stage 1A Bottom Signal (Price > 50D SMA)
• ST Stage 2A Breakout (First day Price > 10D EMA and 20D SMA)
• Hourly Chart – Breaking out above Weekly Value Area
• Daily Chart – Trading above the Monthly Value Area
• Overlapping prior monthly value areas in sight!
• VPOC in sight!
• Weekly Chart – Targeting a retest of the Yearly POC
💠 Trade Plan
ENTRY: $2.72 (Break above weekly value area high)
STOP: $1.97 (Below the prior all-time-low)
TARGET: 6.92 (A retest of the yearly point of control from 2024)
RISK: 27.6%
REWARD: 154.4%
R/R Multiple: 5.6X
Probability of Win: 50%
Expected Value: 63.42%
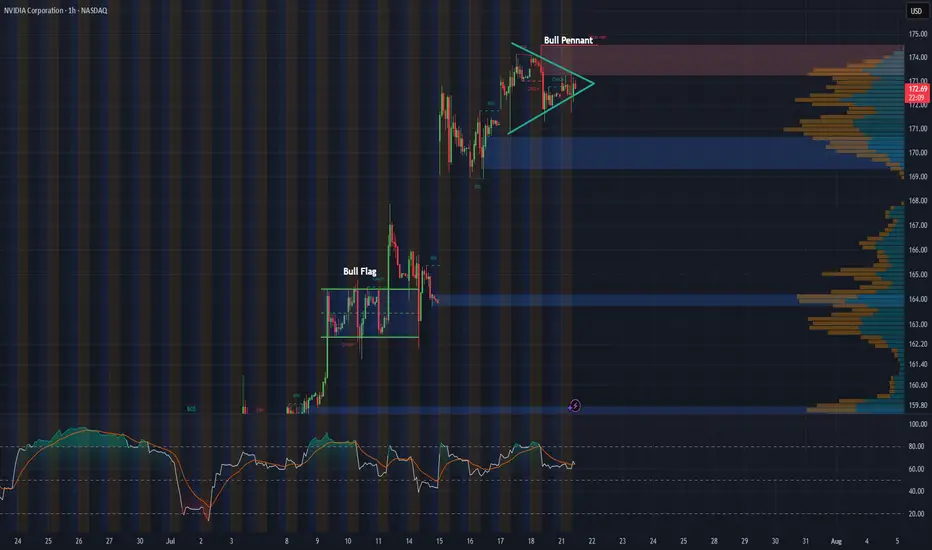
NVDA 1-Hour Chart UpdateHey everyone, just wanted to share a quick update on NVDA’s 1-hour chart. Following last week’s bull flag breakout, the stock appears to be consolidating into what looks like a solid bull pennant formation.
With major tech earnings on the horizon and the recent approval to sell H20 chips to China, this pattern could be setting the stage for another breakout. Will NVDA continue its impressive rally, or is this just a breather before the next move?
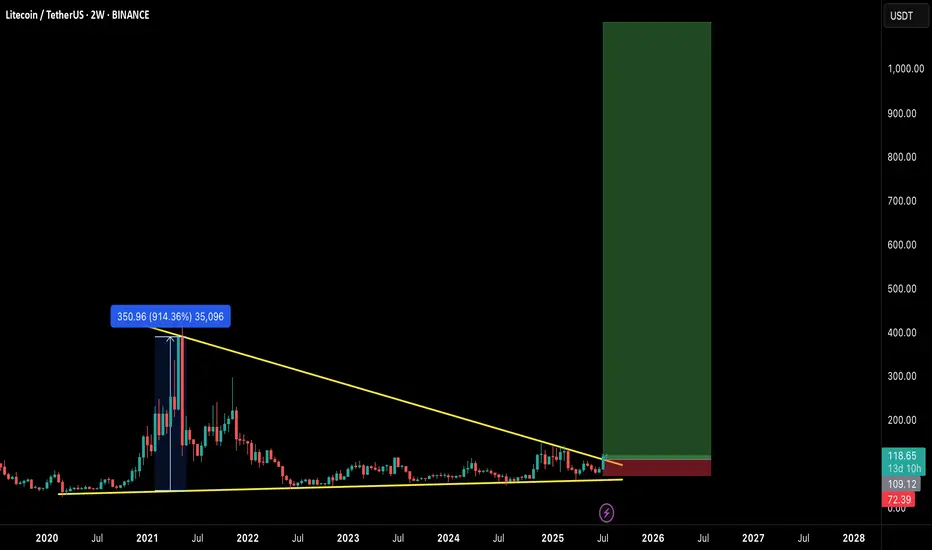
$LTC READY FOR EXPLOSION! THE COMEBACK OF THE OG?Litecoin has quietly formed one of the most massive macro structures in the market — a multi-year falling wedge on the 2-week timeframe, now breaking out with early confirmation.
This could be the start of a generational move, similar to the 2020 breakout. Let's break it down:
🧠 Technical Breakdown:
✅ Falling wedge forming since 2021 — 4 years of compression
✅ Volume and structure support breakout
✅ LTC already gave a 914% rally last time it broke a similar level
📏 Target zone extends above $900–$1000
🛒 Entry Zone:
Current Price: $118
🟢 Buy on breakout or dips near $105–$110 for safer entries
🎯 Target Zones:
TP1: $280
TP2: $400
TP3: $650
TP4: $950+
🛑 Stop-loss:
Breakdown below $72 (last higher low & wedge base)
⚖️ Risk-to-Reward:
High timeframe structure = High conviction play.
Potential R:R > 8x — Rare macro opportunities like this don’t come often.
🧩 Final Thoughts:
LTC may not be the flashiest alt anymore, but this setup is technically undeniable. If BTC enters full bull cycle, LTC could ride the wave explosively.
🔥 This could be a "buy and forget" macro play for 6–12 months.
💬 Let me know your thoughts in the comments & hit that ❤️ if you like macro setups like these!
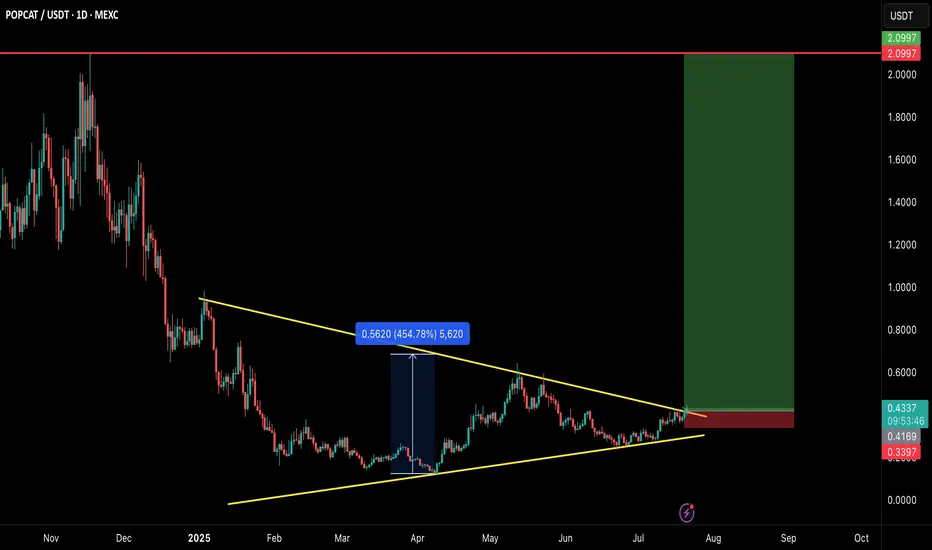
POPCAT/USDT – MEGA BREAKOUT INCOMING!POPCAT is breaking out of a large symmetrical triangle structure that has been developing for several months. This is a textbook bullish reversal setup with explosive potential — and the chart says it all! 👇
🧠 Technical Breakdown:
✅ Clean symmetrical triangle breakout on daily timeframe
🔥 Strong base formation followed by volume breakout
💹 Consolidated above trendline for weeks — breakout looks real
🛒 Entry Zone:
CMP ($0.43) or buy in dips toward $0.40–$0.42
🎯 Targets:
TP1: $0.65
TP2: $1.10
TP3: $1.60
TP4: $2.10
🛑 Stop-loss:
Close below $0.34
📊 Risk/Reward:
Solid RR > 4.0 with high potential if momentum kicks in. Volume and structure both support a strong upside.
📢 Final Thoughts:
This is not just a breakout — it's a multi-month accumulation breakout. If the market stays bullish, POPCAT could go parabolic again just like it did earlier.
🚨 Always use proper risk management and SL!
💬 Drop your thoughts in comments & don’t forget to hit that ❤️ if you find this helpful.
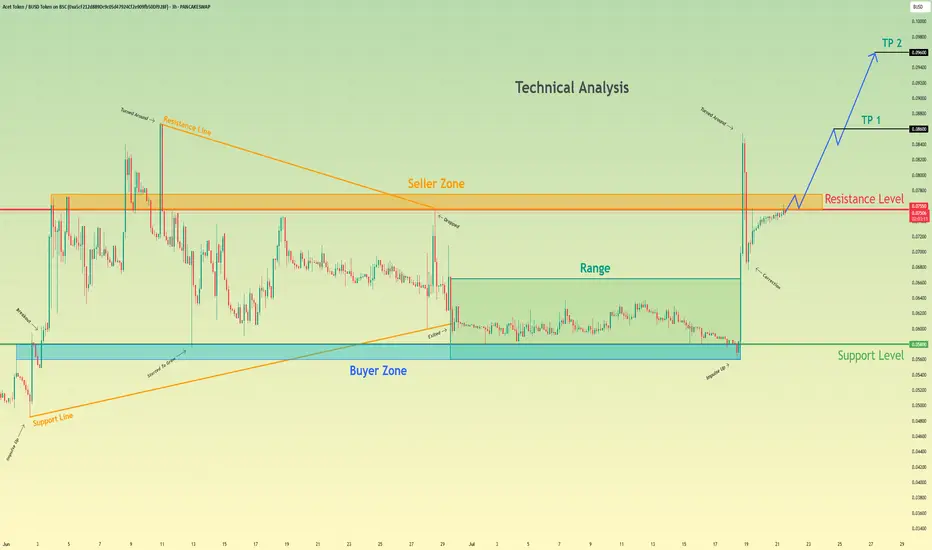
HelenP. I Acet Token may make correction and then continue growHi folks today I'm prepared for you Act Token analytics. If we look at the chart, we can observe a clear technical picture. For a considerable amount of time, the price was tightly compressed inside a large downward wedge, defined by a robust support zone at 0.0570 - 0.0550 and a descending trend line that put consistent pressure on the price. Such long consolidation periods often precede a powerful expansion. Recently, we have witnessed a decisive breakout from this wedge, confirmed by a strong impulse candle. This move signals a clear shift in market sentiment from neutral to bullish and invalidates the prior constraining structure. I believe that the momentum from this breakout will be sufficient to challenge the next major obstacle: the horizontal resistance zone at 0.0770 - 0.0790. This is a critical level to watch, as it has previously rejected price advances. My scenario implies that after potentially a small, healthy correction or retest, the price will continue its upward movement. A successful break above this critical area would confirm the newfound strength of the buyers and open up a clear path for further appreciation. For this reason, my primary goal, the logical target for this move, is set at the 0.0880 level. If you like my analytics you may support me with your like/comment ❤️
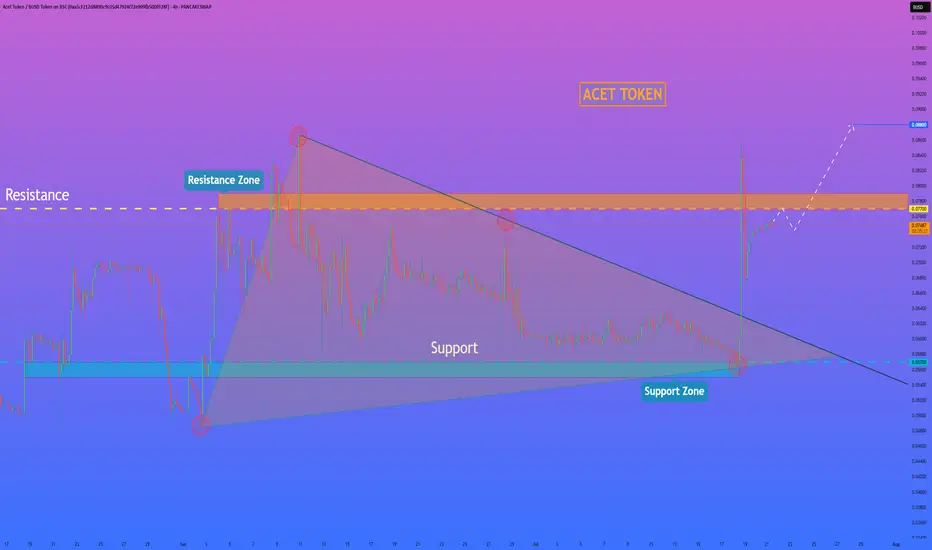
Acet Token will break resistance level and continue to move upHello traders, I want share with you my opinion about Acet Token. Looking at the recent price action, we can see a clear narrative unfolding. The asset initially formed a large wedge pattern, experiencing a trend reversal that led to a breakdown and a period of prolonged consolidation within a defined range between the buyer zone around 0.0580 and the upper boundary. Recently, however, the market showed a strong impulse, breaking out of this range and decisively moving upwards. Currently, the price of act is testing the key resistance level at 0.0755, an area historically defined as a seller zone. The hypothesis is that after this powerful impulse, the asset will manage to break and hold above this resistance. A successful retest of the 0.0755 level would likely signal a continuation of the uptrend, paving the way towards our specified take-profit targets. The first goal is set at TP 1 at 0.0860, with a further extension to TP 2 at 0.0960, capitalizing on the anticipated bullish momentum. Please share this idea with your friends and click Boost 🚀