Could Cardano Bulls "Raise The Flag" To $2??COINBASE:ADAUSD has some very interesting Price Action happening with the decline starting from beginning of December 2024 forming what looks to be a Descending Channel with the potential to become a Bull Flag!
With a Bull Flag being a Continuation Pattern, we can expect a higher probability of a Bullish Break to this Channel to continue in the trend it was following prior to falling into this Consolidation Period.
Last week we saw a huge Bullish Candle form and Break the Channel after testing the March 2024 Highs, the 200 EMA @ .7719, along with the Linear Regression or "True Trendline" of the Descending Channel.
Other indicators suggest Bullishness as well with the RSI staying above 50 in Bullish Territory and we can see a large amount of Volume entering this Weekly Candle with 2 days and 19 hours left until Close at the time of publishing.
*If Cardano can continue to find Support and is able to make a Valid Bullish Break of this Channel, based off the "Flagpole" or Rally, prior to price falling into Consolidation, we can expect a potential 120% gain from the Break, potentially sending price up to test the overhead Resistance Zone in the ( $1.85 - $2.15 ) Range!
3/7 - The White House will be holding the very first U.S. Crypto Summit to make plans to start bringing cryptocurrency into a U.S. Crypto Strategic Reserve
www.tradingview.com
Breakout

Nvidia - The +50% Rally Is Inevitable!Nvidia ( NASDAQ:NVDA ) is about to create a false breakdown:
Click chart above to see the detailed analysis👆🏻
After the -12% drop on Nvidia last month, Nvidia actually broke the final support trendline towards the downside. However bulls are about to break it again towards the upside, which would confirm the false bearish breakdown, leading to a short squeeze rally of about +50%.
Levels to watch: $140, $200
Keep your long term vision,
Philip (BasicTrading)

$2.80 to $4.50 in 30 minutes$2.80 to $4.50 in 30 minutes 💥 Been waiting for this NASDAQ:GV trade whole days since morning Buy Alert and reconfirmation in after $2.50 held support strongly before the move 🚀
Called out 3 trades today, all 3 of them reached my pre-planned max target areas 🎯 They were NASDAQ:GV NASDAQ:CDXC NASDAQ:MASS
Excited for new ones tomorrow

Gold (XAUUSD) - Inverse Head & Shoulders Breakout Setup!Hello everyone, i hope you all will be doing good in your life and your trading as well, let's discuss about Gold and it is showing a strong bullish setup with an inverse head and shoulders pattern on the 1-hour chart . This means buyers are stepping in , and a breakout above the $2,930-$2,932 neckline could push prices higher toward the next resistance at $2,954-$2,960 . A stop-loss around $2,910-$2,906 can help manage risk in case of a pullback. Watch for volume confirmation when the breakout happens—it’ll add more strength to the move!
If Gold breaks out and holds above the neckline , we could see a good upside rally as buyers take charge. But if it fails to sustain, we might see some consolidation or even a drop. Best approach? Wait for a clean breakout and retest before jumping in. Stay sharp, manage risk, and trade smart!
Disclaimer: This analysis is for educational purposes only. Please consult a financial advisor before making investment decisions.
If you Found this helpful? Don’t forget to like, share, and drop your thoughts in the comments below.

GBP_CHF SWING LONG|
✅GBP_CHF made a bullish
Breakout of the key horizontal
Level of 1.1400 and the breakout
Is confirmed so we are bullish
Biased and we will be expecting
A further move up and a retest
Of the horizontal resistance
Above around 1.1606
LONG🚀
✅Like and subscribe to never miss a new idea!✅

Gold - A Bullish Close Would Be Insane!Gold ( TVC:GOLD ) has to close bullish now:
Click chart above to see the detailed analysis👆🏻
Just since the end of 2022, Gold rallied about +80% which is simply unbelievable looking at the already significant market cap of the precious metal. However this bullrun does not seem to be over and if Gold confirmes the trendline breakout, another rally of +40% will follow soon.
Levels to watch: $4.000
Keep your long term vision,
Philip (BasicTrading)

Chainlink - Preparing for trend reversalBINANCE:LINKUSDT (1D CHART) Technical Analysis Update
LINK is currently trading at $16.39 and currently we are seeing trend reversal and heading towards breakout from the bearish trend, if the price continues the bullish momentum we expect a clear breakout and bullish start of the bullish trend.
Entry level: $ Enter after breakout 18
Stop Loss Level: $14
TakeProfit 1: $ 20
TakeProfit 2: $ 22
TakeProfit 3: $ 26
TakeProfit 4: $ 30
TakeProfit 5: $ 35
Max Leverage: 2x
Position Size: 1% of capital
Remember to set your stop loss.
Follow our TradingView account for more technical analysis updates. | Like, share, and comment your thoughts.
Cheers
GreenCrypto

JD setting up for another leg higher
If the broader market holds, JD has a good chance for another leg higher from here.

CHFJPY - Important BreakoutHello Traders !
The CHFJPY reached the support level (0.82759 - 0.82602).
Currently, The lower high is broken (change of character)
So, I predict a bullish move🚀
_______________
TARGET: 169.200🎯

GBP/USD: Bulls in Control… For Now! Key Levels to Watch Hello Folks
GBP/USD is holding strong above 1.2533, and I see a potential bullish move toward 1.2805 if momentum continues. But I’m staying flexible—if price breaks below 1.2450, my bias shifts, and I’ll look for downside targets instead. 📊
📍 Here’s how I see it:
✅ Bullish above: 1.2533 → 1.2627 → 1.2650 → 1.2805 🚀
❌ Bearish shift below: 1.2450 → 1.2378 👀
💡 My Plan:
As long as GBP/USD stays above 1.2533, I’m bullish and expecting a push toward 1.2805 📈
If price drops below 1.2450, I’ll reconsider and look for shorts instead 📉
⚠️ No need to rush—let the market confirm the move!

SPX SPY Trading Range or BO? Daily Chart Analysis - 5 Mar 2025
• The market traded lower earlier in the day. The market then reversed higher for most of the day around noon time. The SPX then pulled back off its high in the final 30 minutes of the day.
• The bulls see the market trading in a broad bull channel and want the move to continue for months. They want an endless pullback bull trend.
• They want a retest of the all-time high (Dec 6) followed by a breakout and trend resumption. They see the current move as a bull leg within the trading range.
• They want a reversal from a double bottom bull flag (Jan 13 and Mar 4) and a wedge (Feb 25, Feb 28, and Mar 4).
• They hope the bottom of the 22-week trading range will act as support. They want a failed breakout below the January 13 low.
• At the least, they want a retest of the middle of the trading range (around the 20-day EMA).
• If the market trades lower, they want the November 4 or October 3 low to act as support.
• The bears got a reversal from a higher high major trend reversal, a wedge top (Dec 6, Jan 24, and Feb 19), and a smaller double top (Jan 24 and Feb 19).
• They see the market as being in a 22-week trading range.
• They hope to get a bear leg to retest the January 13 low followed by a breakout below. They got it yesterday (Mar 4).
• Next, the bears want a breakout below the January 13 low, followed by a measured move based on the height of the 22-week trading range.
• If the market trades higher, they want the bear trend line or the 20-day EMA to act as resistance.
• They want at least a small second leg sideways to down to retest the March 4 low.
• So far, the market is trading in a 22-week trading range.
• The SPX broke below the January 13 low yesterday (Mar 4) and traders want to see if there are any follow-through selling.
• Or will the market form a pullback, followed by a second leg sideways to down to retest the March 4 low after that?
• Traders may BLSH (Buy Low, Sell High) within the trading range until there is a breakout from either direction with follow-through buying/selling.
• The bears must create a strong breakout below the January 13 low with follow-through selling to convince traders a breakout could be underway.

Meta - The Breakout Is About To Be Confirmed!Meta ( NASDAQ:META ) is attempting the breakout:
Click chart above to see the detailed analysis👆🏻
Over the past couple of months, we have been witnessing an incredible rally of about +750% on Meta. Looking at the long term reverse triangle pattern, this rally was not unexpected and such is the breakout. We still need to see confirmation, but then Meta will target the four digit level.
Levels to watch: $700, $1.000
Keep your long term vision,
Philip (BasicTrading)

Potential rise for goldHello traders
there is an upward momentum and an expanding correction pattern, another upward wave is expected.

Morning Star Formation on Daily TF.Morning Star Formation on Daily TF.
No Bearish Divergence yet that has matured.
a Very Important Support lies arround 173.50 - 177.50
Beautifully printed HL & Moving Up now.
Crossing & Sustaining 194 may lead it towards
200+ with ultimate target around 230.

Falling Resistance Trendline Breakout on 2 hr Timeframe.Hello everyone, i hope you all will be doing good in your life and your Trading as well. Today i have analysed gold chart and found it has given breakout of falling resistance trendline, i am expecting momentum for upside in this. Probability is high it should travel towards our target area. The volume has been increasing, suggesting strong buying interest, and the RSI at 62.32 is in the bullish zone, confirming the upward momentum. Additionally, the MACD crossover adds further confidence to this bullish setup. The ideal entry point is when the price breaks above the resistance at 2,955.16 . Set the stop loss just below the support level at 2,860.96 to manage risk. For targets, consider aiming for 2,965.00 , 2,975.00 , and 2,985.00 , with the final target around 2,995.00 . If the breakout holds, this setup could present a strong uptrend continuation.
Disclaimer:- This analysis is for educational purposes only. Please trade responsibly and consult a financial advisor before making any decisions.
If you found this analysis helpful, don’t forget to like, follow, and share your thoughts in the comments below! Your support keeps me motivated to share more insights. Let’s grow and learn together—happy trading!

Breakout in Organogenesis Holdings Inc...Chart is self explanatory. Levels of breakout, possible up-moves (where stock may find resistances) and support (close below which, setup will be invalidated) are clearly defined.
Disclaimer: This is for demonstration and educational purpose only. This is not buying or selling recommendations. Please consult your financial advisor before taking any trade.

Breakout in ADT Inc...Chart is self explanatory. Levels of breakout, possible up-moves (where stock may find resistances) and support (close below which, setup will be invalidated) are clearly defined.
Disclaimer: This is for demonstration and educational purpose only. This is not buying or selling recommendations. Please consult your financial advisor before taking any trade.

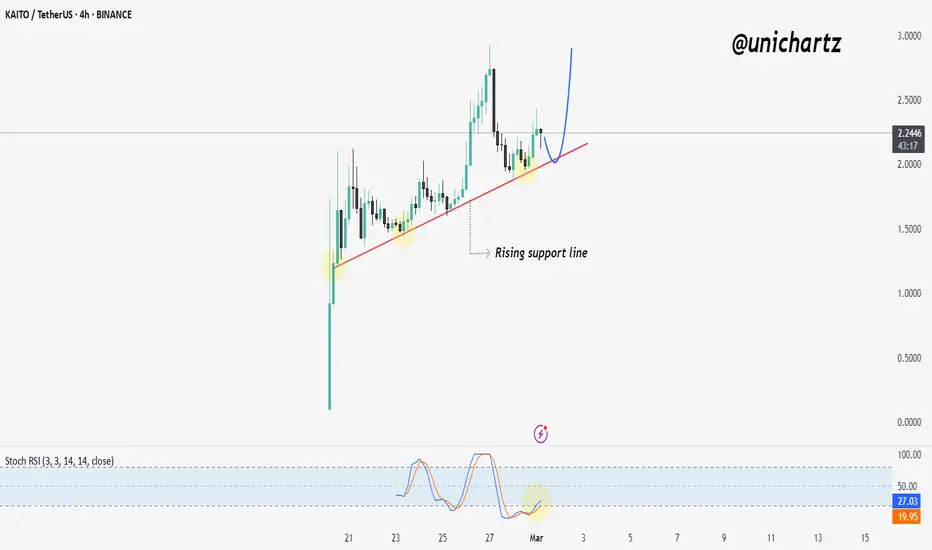
KAITO Holding Rising Support – Is a Big Move Coming?$KAITO/USDT is respecting a rising support line, with price bouncing multiple times from this level. The current retest suggests a potential bullish continuation, especially with the Stochastic RSI in the oversold zone, indicating a possible reversal.
If the trendline holds, we may see a strong upward move, targeting previous highs around $2.50 - $3.00. However, a break below the support could invalidate the bullish outlook.
DYOR, NFA
Dead Bitcoin soon will break 92K support (Bye 100K and Hi 80K) As we mentioned a lot major support which is 92K$ is holding price from falling now for 8Th times and each time a support or resistance touch it gets weaker and soon this support will also break to the downside and below 90K$ we are looking for massive dump and fall and start of bear market for at least 2-3 months and this would be correction and rest for market and bitcoin and after that we are looking for rise and next phase pump for the market and maybe targets like 130K$ and more.
So for now we are looking for correction and dump like the red arrows and for confirmation of bear market and dump major support zone should break soon.
DISCLAIMER: ((trade based on your own decision))
<<press like👍 if you enjoy💚

USDJPY - BULLISH SCENARIOHello Traders !
On Thursday 20 FEB, The USDJPY reached the support level (149.356 - 148.639) and failed to break it !
So, We have a bullish scenario:
If the price breaks and closes above the lower high (150.733 - 150.469),
We will see a bullish move🚀
_______________
TARGET: 153.700🎯

AUDUSD - Fake BreakoutHello Traders !
The AUDUSD failed to break the resistance level (0.63142 - 0.63449).
The higher low is broken (change of character).
So, I expect a bearish move📉
_______________
TARGET: 0.62100🎯

DOTUSDTRange Breakout: The pair has been trading within a range, and the breakout from this range signals potential bullish momentum. A breakout indicates that the price is ready to move out of its consolidation phase, with buyers now in control.
Trendline Breakout: The price breaking above a key trendline further confirms a shift from a bearish or neutral market sentiment to a more bullish one. This is a strong signal that upward momentum is building.

Xrp - Market Structure Is Just Super Bullish!Xrp ( CRYPTO:XRPUSD ) is still 100% dominated by bulls:
Click chart above to see the detailed analysis👆🏻
With the massive +650% rally over the past couple of months, Xrp perfectly broke out of a long term ascending triangle formation. We already saw a retest of this previous resistance which is now turned support and Xrp is now simply starting the continuation of the bullish rally.
Levels to watch: $2.0, $4.0
Keep your long term vision,
Philip (BasicTrading)
