BANKNIFTY will go upwards a little moreDESCENDING RECTANGLE BREAKOUT -
Banknifty has broken ou t of a strong rectangle pattern on 15 min chart with good confirmation
GAP-UP BREAKOUT -
The breakout occurred with a gap-up indicating strong upwards momentum
SUPPORT FROM 30D SMA -
apartfrom this it had also taken support from 30D SMA during the closing of the previous day indicating there is potential for upward momentum
5-MIN TIMEFRAME -
the pattern and the breakout is even more clear on 5-min timeframe
Breakouts

HMSTR/USDT: 80% RALLY INCOMING!!Hey everyone! 👋
If this analysis resonates with you, smash that 👍 and follow for more high-value trade setups! 💹
🔍 Technical Overview:
HMSTR is on fire! 🔥 It’s breaking out from a symmetrical triangle, with a successful retest confirming the breakout. The 100MA support is holding strong, further boosting confidence in the move. It’s now eyeing its All-Time High (ATH), making this an ideal time to jump in. Long some here, and keep an eye on the dips for accumulation!
💡 Entry Range: CMP and add more up to $0.00366
🎯 Targets:
Target 1: $0.0043
Target 2: $0.0050
Target 3: $0.0058
Target 4: $0.0069
🛡 Stop Loss: $0.0034
⚙ Leverage: Max 5x (Low leverage recommended)
Why This Trade?
HMSTR is showing strong bullish momentum, and its breakout structure aligns perfectly with classic bullish patterns. With the 100MA acting as a solid support, the risk-to-reward ratio is highly favorable!
💬 What’s your perspective on HMSTR’s price action? Are you seeing the same potential for a rally? Share your thoughts and analysis in the comments below, and let’s ride this wave to the ATH together! 🚀🔥

Syrma inside bar setup with poteicial breakout trade ideasyrma chart is showing regular inside bar formation, indicating a consolidation phase. the current price is near the upper range, and i believe could spike and break this range.
setup inside bar+ potential breakout

NIFTY will breakout on the upside or downside soonRectangle Pattern Breakout - NSE:NIFTY is trading inside a rectangle pattern and will break out of the pattern anytime either upwards or downwards
Rectangle on 5-min Timeframe - Above is the nifty chart on 5-min timeframe which more clearly shows that nifty is trading inside a perfect formed rectangle pattern
Strong Resistance Level - Above is another image of nifty on 5-min timeframe indicating how the lower line of the rectangle had been tested 3 times already (including once yesterday) indicating the strength of the pattern
Target - target will be 95 points away from the place where the market breaks out on the rectangle. Upside or downside breakout both seem equally probable at this point.

BBAI Is it ready to breakout?I have not looked into to this to deep yet. Based on the chart and latest volume it sure looks poised to take off.

SPX Cup and Handle SPYSP:SPX Appears to have printed a Cup and Handle Pattern watch for increased volume on AMEX:SPY and SPX Calls for confirmation of reversal, if we continue to fail 5900 level and can't start to fill the gap upside we could start to fill the election gap Below.

GME 15 min Bull Pennant Watching the 15 min on GME, and it seems that it has formed a pretty substantial Bull Pennant on the 15 min. This comes just after the Cup & Handle breakout earlier this week. We can also see that, the Ultimate RSI has Oversold, while setting a higher low withing the Pennant.
I believe that once this Pennant starts to breakout, GME is going to stretch into the 30s, and with no current supply above $29, this may very well see it's way into the $60s real quick. This is only the 15 mind you. We still have a much larger Pennant on the 4hr, another Cup & Handle on the 1 day, and a Golden Cross on the weekly. Pretty much every timeframe is showing a bullish pattern right now. If you ask me, I would say it's go time.
Remember, the last time GME broke out from a Golden Cross on the weekly, was back in July of 2020 and lasted until Jan of 2021. And we saw a 12,000 percent run over the span of 6 months.
If you're currently short, you better say a prayer. To everyone else, let the games begin! 🤙

Clean Chit for more than 25% POWHello, traders community,
This Canadian power corporation has shown consistent revenue growth due to its expansion into renewable energy assets. Given the recent shift towards clean energy, the company is well-positioned to capitalize on new government incentives and regulatory support aimed at reducing carbon emissions.
This stock has recently broken its resistance and formed support, I have taken a target of around 27% using a monthly chart. The company’s recent earnings beat consensus estimates, with a significant increase in renewable energy revenues. This trend is likely to continue as the demand for clean energy rises.
Given market volatility, position sizing should be managed carefully. Aim to risk only 1-2% of your total portfolio on this trade to align with sound risk management practices.

Possible BreakoutFalling wedge in progress. Breakout to $10.10 might be in play. Need more volume to come in to make this happen.

Double Bull Flags on an Ascending Triangle breakout on the dailyDaily, double Bull Flag, on top of an Ascending Triangle Breakout. Golden Pocket on the Fib Ext is $588 🥂

AAPL Apple Inc. Ascending Triangle NASDAQ:AAPL AAPL Apple Inc. Ascending Triangle Look, it looks like it might break to the upside depending on market conditions. Looking at next week's 237.5 calls. Not financial advice could easily see a pull back, AAPL like NVDA loves to close very close to strike prices making options worthless.

Breakout Watch: Trading Nikkei Futures Ahead of Its Micro Launch1. Introduction: Nikkei Futures and Current Market Setup
Nikkei Futures (NIY1!) remain a cornerstone of Japan's equity market exposure for traders globally, offering insights and trading opportunities tied to the performance of Japan’s stock market. In recent days, the Nikkei Futures market has entered a phase of tight consolidation, with the trading range narrowing between 39515 and 38785. This setup presents a classic breakout opportunity, with price poised to either break above the upper boundary or fall below the bottom one. Traders should remain vigilant, as a breakout could lead to a market movement in either direction.
2. Contract Specifications: Nikkei Futures vs. Micro Nikkei Futures
Nikkei Futures (NIY1!) are a valuable tool for traders seeking exposure to Japan’s economy. The contract size is tied to the Nikkei 225 index, with each tick movement having substantial financial implications for the trader. Here’s a breakdown of the key specifications:
o Nikkei Futures (NIY1!):
Tick Size: 5 points.
Tick Value: 2,500 JPY per tick.
Margin: 1,500,000 JPY (varies as market conditions change)
Starting October 28, 2024, CME Group will introduce Micro Nikkei Futures, which will provide a more accessible option for retail traders by offering a smaller contract size and lower margin requirements. The Micro Nikkei contracts will allow traders to take advantage of the same market exposure with greater flexibility and reduced capital risk:
o Micro Nikkei Futures:
Tick Size: 5 points.
Tick Value: 250 JPY per tick.
Margin: 150,000 JPY (varies as market conditions change)
This introduction opens up new opportunities for traders looking to manage risk more effectively or for those who prefer to trade with smaller position sizes.
3. Breakout Trade Setup for Nikkei Futures
Currently, Nikkei Futures are stuck in a range-bound market, oscillating between 39515 and 38785. A potential breakout beyond these levels is potentially imminent, and traders can prepare to capture the momentum once it occurs.
The key to this setup is patience: wait for the price to either break above or fall below before entering any trades. Here’s the breakout strategy we’ll be focusing on:
Breakout to the Upside: Enter a buy trade if price breaks above 39515.
Breakout to the Downside: Enter a sell trade if price falls below 38785.
By leveraging this breakout strategy, traders can capture the volatility that usually follows a breakout from a tightly held range.
4. Breakout to the Upside: Trade Idea
In the event of an upside breakout, we anticipate that the price will rally after breaking through the 39515 level. Here’s the breakdown for this trade setup:
Entry: Buy at 39515, the upper boundary of the current range.
Target: The target is set at 40285, where there is a significant UFO resistance and a technical resistance level. This level marks a strong area where sellers may come in, making it a logical point to exit the trade and secure profits.
Stop Loss: To manage risk, place the stop loss a third of the profit zone below the entry price. In this case, the stop would be at 39258, minimizing downside exposure while allowing the trade to develop.
o Risk/Reward Calculation:
Profit zone: 40285 - 39515 = 770 points.
Risk (1/3 of the profit zone): 770 / 3 = 257 points.
Stop loss: 39515 - 257 = 39258.
For standard Nikkei Futures, each point is worth 500 JPY, so:
Potential profit: 770 points × 500 JPY = 385,000 JPY (approx. USD 2,580).
Risk: 257 points × 500 JPY = 128,500 JPY (approx. USD 860).
For the Micro Nikkei Futures, everything would be reduced x10 (approx. USD 258 and USD 86).
5. Breakout to the Downside: Trade Idea
In the case of a downside breakout, we expect a decline once the 38785 level is breached. Here’s how the trade setup would work:
Entry: Sell at 38785, the lower boundary of the current range.
Target: Set the target at 37920, a level supported by a UFO support, a technical support, and two nested Fibonacci retracement levels (23.6% and 61.8%).
Stop Loss: The stop loss is set at a third of the profit zone above the entry price. This protects against excessive losses if the market moves against the trade. The stop would be at 39073.
For standard Nikkei Futures:
Potential profit: 865 points × 500 JPY = 432,500 JPY (approx. USD 2,910).
Risk: 288 points × 500 JPY = 144,000 JPY (approx. USD 970).
For the Micro Nikkei Futures, everything would be reduced x10 (approx. USD 291 and USD 97).
6. Risk Management
Effective risk management is key to long-term success in trading. In both breakout scenarios, the use of stop-loss orders ensures that traders can limit their losses if the market moves against them. Additionally, setting precise entry and exit points reduces the likelihood of emotional decision-making, allowing for more disciplined trading.
The upcoming launch of Micro Nikkei Futures offers traders enhanced control over their position sizing and risk exposure. With smaller contracts, traders can engage in these setups with a fraction of the capital required for standard futures contracts. This flexibility is particularly beneficial for retail traders looking to manage risk effectively while still capitalizing on market opportunities.
Whether you are a seasoned futures trader or new to the Nikkei market, these breakout setups provide a solid foundation for capturing momentum. As always, risk management should remain at the forefront of your strategy, ensuring you protect your capital while pursuing profits.
When charting futures, the data provided could be delayed. Traders working with the ticker symbols discussed in this idea may prefer to use CME Group real-time data plan on TradingView: www.tradingview.com - This consideration is particularly important for shorter-term traders, whereas it may be less critical for those focused on longer-term trading strategies.
General Disclaimer:
The trade ideas presented herein are solely for illustrative purposes forming a part of a case study intended to demonstrate key principles in risk management within the context of the specific market scenarios discussed. These ideas are not to be interpreted as investment recommendations or financial advice. They do not endorse or promote any specific trading strategies, financial products, or services. The information provided is based on data believed to be reliable; however, its accuracy or completeness cannot be guaranteed. Trading in financial markets involves risks, including the potential loss of principal. Each individual should conduct their own research and consult with professional financial advisors before making any investment decisions. The author or publisher of this content bears no responsibility for any actions taken based on the information provided or for any resultant financial or other losses.

Master Breakout Trading: The Strategy Every Trader Needs to KnowIn the world of trading, a "breakout" refers to a price movement that occurs when an asset moves beyond a predefined support or resistance level. These pivotal moments often signal a significant shift in market dynamics and can lead to substantial price changes. Breakouts are crucial for traders as they can mark the beginning of a new trend. A breakout above a resistance level may suggest the start of an uptrend, while a breakout below support could indicate a downtrend. Learning to identify and trade breakouts effectively can unlock profitable opportunities and help traders capitalize on shifting market conditions.
What Are Breakouts in Trading?
Breakouts occur when the price of an asset surpasses a well-established support or resistance level, suggesting a potential shift in market direction. A bullish breakout happens when the price breaks above resistance, signaling upward momentum. Conversely, a bearish breakout occurs when the price drops below support, often indicating the continuation of a downtrend.
Breakouts are significant because they often lead to increased trading activity and volatility, offering traders opportunities to enter or exit positions at pivotal moments. These breakouts are often accompanied by increased trading volume, which helps confirm the validity of the price move and suggests that a new trend is forming.
How Breakouts Occur and Their Importance
Breakouts occur when price action surpasses critical price levels—either support or resistance—that have acted as barriers in the past. These levels are often identified through technical analysis and represent key turning points where buyers or sellers have historically entered the market in large numbers.
--Support Levels: A price point where an asset tends to stop falling and may reverse upward. A bearish breakout occurs when the price drops below this level, signaling a continuation of the downtrend.
--Resistance Levels: A price point where an asset typically stops rising and may reverse downward. A bullish breakout occurs when the price surpasses this level, suggesting the potential for further upward movement.
Breakouts are important because they can indicate the start of a new market trend. When price breaks through a support or resistance level, it signals that the market sentiment has shifted, and traders can take advantage of this movement to capture profits. For successful breakout trading, it's essential to confirm these breakouts using volume and other technical indicators to avoid being caught in a false breakout, where price briefly breaks a level but reverses direction shortly after.
Examples of Breakout Scenarios
Breakouts can present profitable trading opportunities in both bullish and bearish markets. Here are two examples:
--Bullish Breakout Example
Take a look at the following EUR/USD chart, where the price breaks above the 1.0200 level after previously rebounding off resistance. Traders would interpret this as a bullish breakout and may look to enter long positions, expecting the pair to sustain its upward momentum. This breakout provides a buying opportunity as market sentiment turns positive and shifts to the upside.
--Bearish Breakout Example
Take a look at the following EUR/USD chart, where the price breaks below the 1.03500 level after previously rebounding off support. Traders would view this as a bearish breakout and may consider entering short positions, anticipating the pair to maintain its downward momentum. This breakout offers a selling opportunity as market sentiment shifts to the downside.
In both examples, breakouts offer traders clear entry points based on the movement beyond established levels, allowing them to profit from the new trend.
👆 Read Also this deep article where we cover everything you need to know about Support-and-Resistance in trading.
The Concept of Breakout Trading
Breakout trading is based on the premise that once price moves beyond significant support or resistance levels, it is likely to continue in that direction for some time. This approach involves recognizing these levels, waiting for the breakout to occur, and entering a trade in the direction of the breakout.
Key elements of breakout trading include:
--Identifying Key Levels: Use technical analysis to locate critical support and resistance levels where price has previously struggled to break through.
--Confirming the Breakout: Ensure the breakout is accompanied by strong volume to confirm its validity.
--Risk Management: Employ Stop Loss orders to protect against false breakouts, where the price briefly breaks the level but then reverses.
--Maximizing Profits: Traders aim to capture as much of the price movement as possible, staying in the trade as long as the breakout trend remains intact.
To identify potential breakouts, traders often use indicators like trendlines, moving averages, and volume analysis. Chart patterns, such as triangles or flags, can also signal a potential breakout. When combined with volume analysis, these tools help confirm that a breakout is likely to lead to a sustained price movement.
Popular Breakout Trading Strategies:
--Trendline Breakout Strategy
One of the most popular strategies involves using trendlines. A trendline is drawn by connecting two or more price points, creating a visual representation of market direction. When the price breaks through the trendline, it signals a potential reversal or continuation of the trend.
Step 1: Draw trendlines by connecting significant highs and lows.
Step 2: Monitor price as it approaches the trendline.
Step 3: Enter a trade when the price closes beyond the trendline, with confirmation from increased volume.
Step 4: Place a Stop Loss order just below/above the breakout level to manage risk.
Support and Resistance Breakout Strategy:
This strategy involves identifying key support and resistance levels on a chart. Once these levels are breached, traders enter the market based on the direction of the breakout.
Step 1: Identify key support and resistance levels from historical price data.
Step 2: Wait for the price to approach these levels.
Step 3: Enter a position after the price breaks through, with confirmation from volume.
Step 4: Use Stop Loss orders to protect against false breakouts.
Volume-Based Breakout Strategy:
Volume is a critical component of successful breakout trading. A significant increase in volume during a breakout indicates strong market interest, making it more likely that the breakout will continue.
Step 1: Monitor volume as the price approaches key levels.
Step 2: Confirm the breakout with a volume spike.
How to Implement a Breakout Trading Strategy
To implement a breakout trading strategy effectively:
--Set Up Your Platform: Ensure your trading platform is equipped with real-time charts like Tradingview, technical indicators, and alerts to identify breakouts as they happen. Customizing your charts with trendlines, support/resistance levels, and volume indicators will help in visualizing breakout points.
--Use Risk Management: Proper risk management is key to avoiding large losses. Place Stop Loss orders just below (for bullish breakouts) or above (for bearish breakouts) the breakout level to limit potential losses from false breakouts.
👆 Read Also this article where we cover everything you need to know about Risk Management in trading, from essential strategies to practical tips for safeguarding your capital.
Common Mistakes in Breakout Trading
Breakout traders often fall into a few common traps:
--Overtrading: Jumping into too many trades or reacting to every price movement can lead to losses. It's crucial to wait for confirmed breakouts before entering trades.
Falling for False Breakouts: A false breakout occurs when price temporarily moves beyond a key level but then reverses. Confirming the breakout with volume or other indicators can help avoid this mistake.
-Ignoring Risk Management: Failing to set proper Stop Losses can lead to significant losses if the market moves against you. Always manage risk by placing Stop Loss orders at appropriate levels.
Tips for Successful Breakout Trading
--Combine Indicators: Use multiple technical indicators, such as moving averages, volume analysis, and trendlines, to confirm breakouts. This increases the reliability of breakout signals.
--Maintain Discipline: Stick to your trading plan and avoid making emotional decisions. Impatience can lead to entering or exiting trades prematurely, undermining your strategy.
--Refine Your Strategy: Continuously review and refine your trading strategies based on market conditions. Markets evolve, and regular analysis helps ensure your breakout strategies remain effective.
👆 Lastly, read this article where we cover everything you need to know about the Trader's Checklist for Successful Trading, providing key steps and insights to help you stay on track and maximize your trading success.
In Conclusion..
Breakout trading offers a powerful way to capitalize on significant price movements in the market. By mastering strategies like trendline, support/resistance, and volume-based breakouts, traders can position themselves to profit from new trends. Effective risk management and discipline are crucial for long-term success. With continuous learning and strategy refinement, breakout trading can become a highly rewarding approach to navigating financial markets.

GODREJAGROStock that has broken out and now it has retested the broken levels. It is set for a an upward momentum. You can buy now with a Stop loss of 690

MICROCAP HAVE BEING 2x POTENTIAL...NSE:BEARDSELL trade at 46 level. Stock constitutionally makes higher volume with higher price. You can watch a huge upside moves as a next resistance at up to 90 level.


MRF Ltd. (NSE: MRF) – Technical Analysis UpdatePattern Formation: MRF Ltd. has been forming a cup-and-handle pattern over the past several months, indicating a bullish continuation. The stock has successfully tested the key Fibonacci retracement levels and is now moving towards potential breakout zones.
Cup-and-Handle Formation:
The rounded cup formed after the stock declined from its peak around ₹150,995 and found support near ₹115,601. The handle has now completed, as the stock consolidated within a falling wedge pattern, building strength for the next leg upwards.
Key Resistance Levels:
Immediate Resistance: ₹144,045 (4.26% upside) – This level aligns with the upper boundary of the wedge pattern. A breakout above this level would signal strength, confirming the end of the handle phase.
Major Target: ₹161,250 (16.54% upside) – This represents the projected target based on the full breakout of the cup-and-handle pattern, leading towards a possible rally to the previous all-time highs.
Support Levels:
Strong Support: ₹133,298 – This aligns with the 50% Fibonacci retracement level, where the stock has shown significant buying interest during previous dips.
Key Fibonacci Levels: 61.8% (₹133,475) and 38.2% (₹129,121) act as pivotal zones for any pullback in case of renewed selling pressure.
Volume Profile & RSI:
Volume Analysis: The recent volume spikes, especially during the approach to the wedge breakout, show accumulation, confirming investor confidence.
RSI: The Relative Strength Index is approaching the 60-70 range, suggesting a healthy bullish trend without overbought conditions.
Outlook: If MRF Ltd. breaks out of the ₹144,045 resistance level, it could see a swift move towards ₹161,250, a potential gain of 16.5% from current levels. Traders should look for strong volume confirmation during the breakout for additional momentum.
Risk Factors: If the stock fails to sustain above ₹133,298, there could be a deeper retracement to test lower Fibonacci levels, with downside risks towards ₹129,000-125,000.

Symmetrical Triangle Formation in CAMS – Awaiting BreakoutOverview:
CAMS is currently forming a symmetrical triangle on the daily chart, a classic continuation pattern. This pattern typically indicates a period of consolidation before the next significant move, and given the stock’s strong previous uptrend, there is a potential for an upward breakout. However, the symmetrical triangle is neutral until confirmed, so both bullish and bearish breakouts are possible.
Pattern Breakdown:
The triangle is defined by point A (around 4900 INR), where the stock reached a high, and point B (around 3850 INR), marking the recent low. The price has been forming lower highs C (around 4600 INR) and higher lows D (around 4200 INR) as it tightens into the apex.
This contraction in price is a sign that the market is undecided, but once it breaks out of the triangle, a directional move is expected.
Key Observations:
RSI Oscillator:
The RSI, set to a period of 14, is hovering around the neutral zone (~50). This shows that the stock isn’t currently overbought or oversold. A move above 70 or below 30 could signal a strong trend in the direction of the breakout.
Volume Decline:
As the triangle develops, volume has been tapering off, a typical characteristic of consolidation. A significant volume spike will be key in confirming the breakout direction.
Breakout Levels:
Upside Breakout: A break above point C (around 4,600 INR) could trigger a bullish continuation, given the previous uptrend. Traders should wait for confirmation via price action and volume.
Downside Breakout: A breakdown below point D (around 4,200 INR) could signal a bearish reversal, especially if accompanied by increased volume.
Final Thoughts:
Symmetrical triangles can break in either direction, so it's crucial to wait for confirmation. Given the prior bullish trend in CAMS, there's a greater probability for an upward breakout, but the possibility of a downside move can’t be ruled out. Patience is key—monitor the volume and price action carefully for a strong breakout signal.
Disclaimer :
This is for educational purpose only. I am not SEBI registered advisor. Take advice from financial advisor before investing.

HDFCAMC Near Breakout ZonesHDFCAMC near to resistance zones and these zones already tested multiple times and can be a weak zone, there is a highly chance that it can breakout.
Note : This is just an analysis wait for the price to confirm.
Disclaimer :
Always follow Risk to Reward, because this is the key to success in this business, no matter how much good a trade is looking, we never know the future.

PEPE/USDT: SWING LONG POSITION!!Hey everyone!
If you're enjoying this analysis, a thumbs up and follow would be greatly appreciated!
PEPE looks good here. It is breaking out from the symmetrical triangle in 4hr time frame. Long some here and add more in the dip.
Entry range:- $0.0086-$0.009
Target:- $0.0102/$0.0109/$0.0118/$0.0128
SL:- $0.008
Lev:- Use low leverage (Max5x)
What are your thoughts on PEPE's current price action? Do you see a bullish pattern? Share your analysis in the comments below!

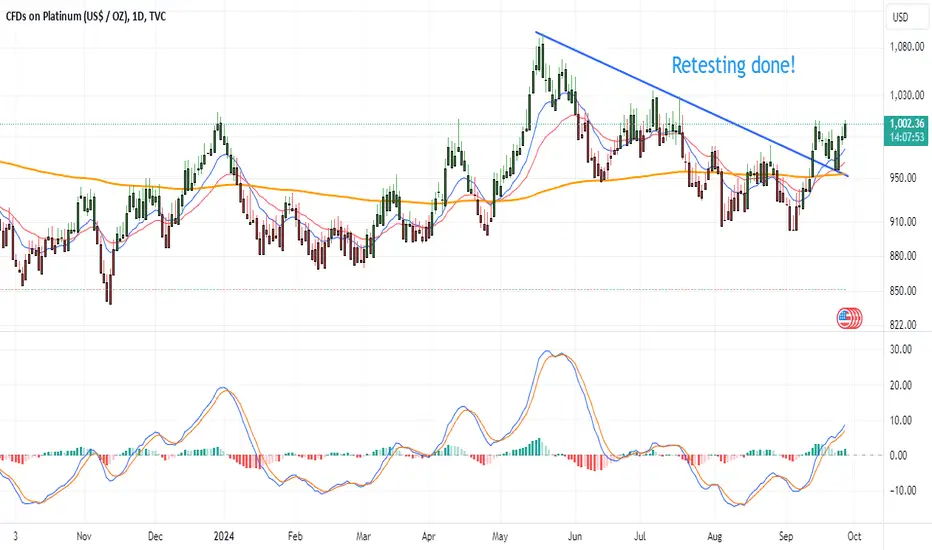
[PLATINUM] Breakout, checked....retest, checked...TVC:PLATINUM seems ready to go higher as it successfully retesting the downtrend line.
As with other commodities, the theme here is China's effort to boost its sluggish economy with its money printer.
86400 resistance #BTCSeems we are in a ascending broadening wedge pattern, with a missing 5 Elliot leg.
If confirmed, we might see a break out to the 86400$ resistance.

220% for Fet in 50Fet's looking to lead the AI charge in the coming weeks we have :
Reverse Head & Shoulders:
• We’ve got a clean Reverse Head & Shoulders pattern in play, which signals a strong bullish reversal. The base sits just above 1.00 USDT, and we’ve already seen a breakout confirmed at 1.309 USDT. This setup is often the precursor to a significant upward move.
Price Targets:
• First target sits at 2.032 USDT, a solid 58% gain from the breakout point.
• Beyond that, we’re looking at a long-term target of 4.180 USDT, marking a 220% potential increase. This target aligns with the projected upper channel, showing a clear path if bullish momentum continues.
Volume & Momentum:
• Volume is backing up the move—strong buying pressure is evident with a notable increase in green volume bars.
• The momentum indicators (likely MACD) are also bullish, reinforcing the strength of the breakout. This suggests there’s still room for the trend to run further.
Historical Reference:
• On the right side of the chart, there’s a past pattern with similar price action. After consolidating for 45 days, the price moved sharply higher. While past performance isn’t a guarantee, it’s definitely worth noting the similarities.
Strategy:
• For those looking to enter, a re-test around 1.309 USDT (now support) offers a solid entry point.
• A break above 2.032 USDT could ignite further momentum, potentially driving price toward 4.180 USDT in the coming weeks or months. Watch for sustained volume and bullish momentum to confirm the trend.
Summary: Fetch.AI is setting up for a strong move, with a clear bullish pattern and solid upside targets. If momentum continues, the next few weeks could see substantial gains. This is a trend worth watching closely.
