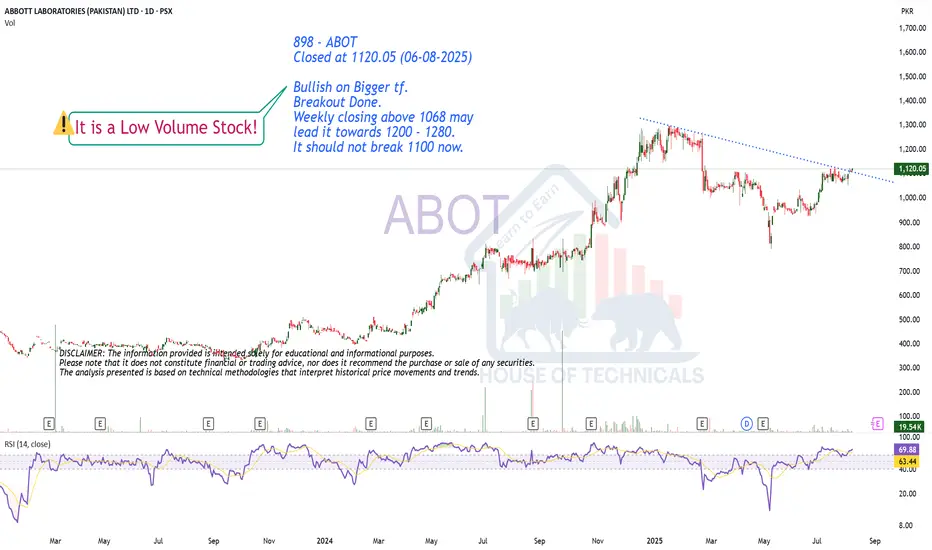
Breakout!898 - ABOT
Closed at 1120.05 (06-08-2025)
Bullish on Bigger tf.
Breakout Done.
Weekly closing above 1068 may
lead it towards 1200 - 1280.
It should not break 1100 now.
Breakoutsetup
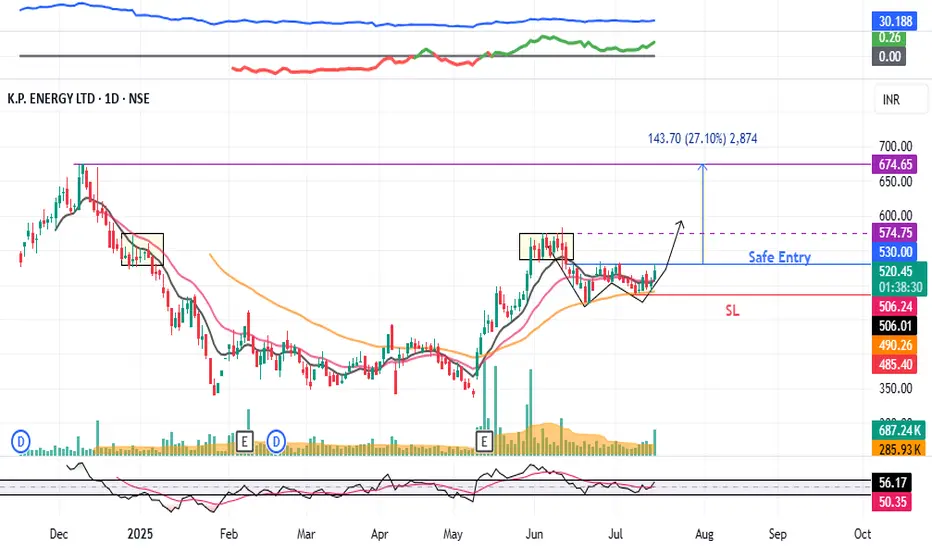
KPEL : Breakout stock#KPEL #swingtrade #breakoutstock #Wpattern #patterntrading
KPEL : Swing Trade
>> Trending Stock
>> W Pattern Breakout soon
>> Good Volumes & Strength
>> Good upside potential
Swing Traders can lock profit at 10% and keep trailing
Pls Boost, Comment & Follow for more analysis
Disc : Charts shared are for Learning purpose not a Trade Recommendation, Take postions only after consulting your Financial Advisor or a SEBI Registered Advisor.
USDCAD Breakout from Parallel Channel | Bullish Move Ahead?USD/CAD has just broken out of a well-respected downward parallel channel, signaling a potential trend reversal. We saw a strong bullish impulse that pushed price above the channel resistance and now appears to be consolidating just above it.
🔍 What to Watch For:
Pullback Opportunity: Price may retest the breakout zone (~1.3640–1.3660). This zone could act as new support, providing a good entry point for buyers.
Upside Target: The next major resistance sits near 1.38542, offering a potential move of over 180+ pips from current levels.
Momentum: Bullish momentum is strong, suggesting a high probability of continuation after a healthy pullback.
📈 Bullish Bias remains intact as long as price holds above the breakout zone.
📉 If price drops back inside the channel, reevaluation of the bullish outlook will be needed.
🔔 Trade Idea: Look for long opportunities on a successful retest with confirmation (bullish candlestick or volume surge).
💬 What are your thoughts on this breakout? Are you long on USD/CAD or waiting for confirmation? Let me know in the comments! 👇

XAUUSD Breakout Alert | Bullish Momentum in PlayGold has finally broken out of the consolidation zone that held price action for several weeks. The bullish trendline has acted as solid support, and now we're seeing strong momentum toward the key $3,500 resistance level.
🔍 Technical Setup:
✅ Price breakout from consolidation range
✅ Respecting a clean bullish trendline
📈 Immediate resistance at $3,490–$3,500
🔄 Potential for a retest before continuation
Strategy Insight: We may see a minor pullback to the breakout zone (~$3,400–$3,420), which could offer a solid buy-the-dip opportunity before further upside.
🎯 Bullish Targets: $3,500 and beyond
⚠ Invalidation Zone: Break below trendline
📢 Gold traders—what’s your plan? Are you in or waiting for a retest?
#XAUUSD #GoldBreakout #TechnicalAnalysis #PriceAction #ForexTrading #TrendlineSupport #TradingView

Redington Ltd - Breakout StockRedington Ltd is showing strong price action and is currently positioned as a breakout stock. The stock has surged above key resistance levels with supportive volume, indicating potential for further upside momentum.
📊 Traders and investors may consider keeping this stock on their watchlist for potential swing opportunities, subject to market conditions and proper risk management.

Teva: The flag’s ready — someone just needs to hit “launch”Teva Pharmaceutical (TEVA) is setting up for a potential continuation move after a clean impulse. On the daily chart, we have a textbook bull pennant — and not just any sloppy one. Price has broken above the 200-day moving average, and all key EMAs (50/100/200) now sit below price, confirming a solid bullish structure.
Volume behavior fits the script: declining inside the pennant, signaling pressure is building. More importantly, the Volume Profile reveals a low-volume void above current levels — meaning there’s little resistance until we hit the $22+ zone. In other words, once this breaks, it could run fast.
RSI is comfortably in bullish territory without being overheated, and the flagpole projection gives us clean upside targets:
– Entry: breakout above pennant resistance
– Target: $22.80 — full flagpole height
– Support: $17.60 — confluence of 0.5 Fib + volume base
TEVA isn’t asking for confirmation anymore — it’s showing it. All systems are technically armed. Now we just wait for the market to press the button.

AUDNZD Breakout Alert | Reversal in Play?The AUD/NZD pair is showing strong bullish momentum as price has finally broken above a long-standing bearish trendline. After a period of consolidation within a descending triangle, bulls have managed to push price above the resistance zone, signaling a potential trend reversal.
Key Observations:
🔹 Bearish Trendline Broken – Indicates a shift in momentum from sellers to buyers.
🔹 Resistance Level Target: 1.09216 – This level aligns with previous supply zones and is a key target for bulls.
🔹 Retest in Progress? – Watch for a possible retest of the breakout zone around 1.0780–1.0800. Confirmation here could offer a great long entry.
🔹 Bullish Projection – If the retest holds, price could rally aggressively toward the 1.09200 level in the coming sessions.
Trading Plan:
✅ Buy on retest confirmation of the broken trendline.
🛑 Stop-loss below the breakout zone (around 1.0760).
🎯 Target: 1.09216 (next major resistance).
💬 Let me know in the comments: Are you buying AUD/NZD or waiting for confirmation?
#AUDNZD #ForexTrading #Breakout #TrendReversal #TechnicalAnalysis #PriceAction #TradingView

BTCUSD Analysis – Mirror Market Concepts (MMC) Action + Target🧭 Mirror Market Concepts (MMC) Explained
Mirror Market Concepts analyze repeating emotional and structural patterns in the market—like looking at a price “mirror” that reflects past movements into the present. Core tools include:
Mind Curve Resistance/Support
CHoCH (Change of Character)
BOS (Break of Structure)
Price Reflection Zones
These tools let us understand not just what price is doing—but why it's reacting at specific levels.
📊 Technical Breakdown of the Chart
🔹 1. Black Mind Curve Support & Resistance
The chart is framed between a rising support curve and a descending resistance curve, forming a psychological squeeze zone.
These mind curves represent subconscious institutional memory—where reactions often repeat based on historical liquidity and risk-off/on behavior.
🔹 2. Major CHoCH (Change of Character)
Price broke below a previous minor higher low, shifting sentiment from bullish to neutral/bearish.
This CHoCH happened within the mind curve boundary, signaling that we’re transitioning into a decision phase.
🔹 3. Major BOS (Break of Structure)
The BOS occurred during the recent drop, confirming sellers took temporary control.
However, price respected the lower mind curve support, which may still hold as the "mirror zone."
🔹 4. Key Compression Pattern (MMC Symmetry)
Price is forming a symmetrical wedge between the two curves, often seen in MMC just before a major explosive move.
The pattern resembles past behavior where price compressed before breaking out in either direction.
🎯 Potential Scenarios (Plotted on Chart)
📈 Bullish Path:
If BTC breaks above the descending curve + confirms above 109,000, we may see:
✅ Target 1: 111,000 (BOS retest)
✅ Target 2: 112,500–113,000 zone (previous emotional high + liquidity sweep)
📉 Bearish Path:
A breakdown below 107,000 and curve support suggests sellers regain control:
⚠️ Target 1: 105,000 (local demand zone)
⚠️ Target 2: 102,500–103,000 (full MMC retrace)
⚠️ Watchlist Considerations:
Two key economic news events (highlighted on chart) could serve as catalysts.
Wait for confirmation and volume breakout before committing to either side.
This is a textbook MMC compression pattern, and patience is key before reacting.
🧠 What Makes This an MMC Setup?
🔄 Mirror Reflection of past rallies and drops forming current wedge
🧩 Mind Curve Boundaries acting like subconscious trend guides
🔁 CHoCH + BOS sequencing for momentum shift detection
💡 Psychological memory zones holding strong reactions
📌 Summary
BTC is caught in a psychological squeeze between mind curve support and resistance.
Structure favors a coming breakout or breakdown, but confirmation is critical.
MMC tools show a high-probability setup—either toward 112K or 103K based on where the breakout happens.
📣 Community CTA (Call-to-Action):
📊 How are you trading this BTC curve compression?
💬 Share your charts, setups, or alternate views below. Let’s decode the market mirror together.

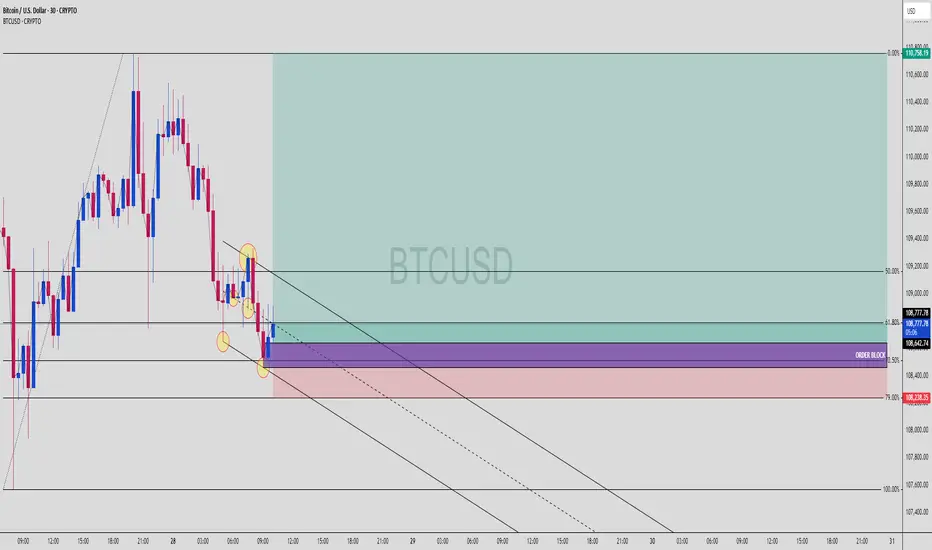
BTC Bulls Awakening from the Shadows – OB + 79% Fib Reaction 📈 BTCUSD | 30-Min Bullish Reversal Setup from OB + 79% Fib Zone
Smart Money never misses a good discount… and this BTCUSD setup is that juicy premium-to-discount play we wait for.
🔍 1. Price Action Context
Market sold off into a clearly defined Order Block
Price tapped precisely at the 79% Fib level
Internal liquidity sweep confirmed below recent equal lows
No candle close below OB = structure still intact
This is what we call the "Trap + Reverse" move. Late shorts just got baited.
🧱 2. Confluences Stacking Up
💎 79% Fib Retracement — Deep discount zone for Smart Money
💎 Bullish Order Block — Last up candle before the sharp sell-off
💎 Liquidity Sweep — Price swept short-term lows = inducement
💎 Channel Structure — Midline bounce = potential breakout
The OB + Fib overlap = a high-probability buy zone with minimal risk
🎯 3. Trade Plan
Entry Zone: 108,250–108,650
Stop Loss: Below 108,000
Take Profit: 110,758 (premium zone)
⚖️ 4. RRR (Risk-Reward Ratio)
📥 Entry: ~108,400
🔒 SL: 108,000
💰 TP: 110,758
✅ RRR ≈ 1:5.8
This is sniper-level asymmetric risk. You don’t chase candles — you wait here, like a lion in the grass 🦁.
🔁 5. What to Watch Next
Price must reclaim and close above 108,867 for confirmation
If we get a BOS (Break of Structure) above 109,200 = 🚀
Hold above the mid-channel line = bullish continuation
💬 Comment “LONGED BTC 💎” if you caught this with the OB bounce!
📌 Save this to study OB + Fib synergy.
👀 Watch price action at 109,200 — breakout zone incoming?
Silver (XAG/USD) Analysis Using Mirror Market Concepts + Target📌 Overview:
In this analysis, I’ve applied MMC (Mirror Market Concepts) to Silver’s recent price action. MMC helps traders like us identify symmetry, psychological zones, and repetitive structures in the market. This chart is a textbook example of how buyers and sellers leave patterns behind that we can mirror to predict what comes next.
Let’s dig deep into this elegant setup 👇
📈 1. The Curve Zone Support – Foundation for the Move
At the base of the chart, you’ll notice a curved support zone drawn in black. This isn’t just any random support—this is a rounded structure that shows how price gradually transitioned from bearish to bullish over time.
This Curve Zone Support indicates:
Sellers are getting exhausted.
Buyers are quietly stepping in, absorbing all sell-side pressure.
The market is preparing for an upside breakout.
This zone also aligns with mirror behavior—what price did before, it's setting up to do again.
🟣 2. Mirror Market Concepts in Action
MMC teaches us to reflect past structures into the future. Here’s how it plays out:
Previous dips into the curve zone were followed by strong bullish pushes.
Recent price action mimics earlier structures, forming mini-cups and curved bases.
This behavior suggests that Silver is mirroring its own bullish reversal structure again.
It’s like watching history repeat itself—with new energy.
🟡 3. Demand Zone + Break of Structure (BOS)
Around the $33.00 level, price dipped into a marked demand zone (highlighted in light purple). This is where buyers jumped back in and pushed price up again—proving strong interest at this level.
You’ll also notice a Minor Break of Structure (BOS) above this demand zone, showing:
A small, but significant shift in market sentiment.
Short-term trend change from bearish to bullish.
Fuel for the next leg up.
This BOS acts as confirmation that price is ready to move toward the target.
🎯 4. Targeting Major Resistance – $34.50 Zone
The ultimate goal is the Major Resistance Zone around $34.50. This zone has been tested before and caused strong rejections. But here’s the key difference now:
Price is approaching this level with momentum, structure, and buyer interest.
If MMC continues to play out, this zone could be taken out or at least retested for potential breakout continuation.
This area is marked as your Target Zone and is aligned with the mirrored projection.
🧠 5. What the Market Psychology Tells Us
Let’s not just read candles—let’s read the mind of the market:
Buyers are patiently absorbing every dip.
Sellers are losing control at each attempt to push price down.
The curve base structure is signaling accumulation.
Demand zones are holding perfectly.
Minor BOS adds more weight to bullish bias.
All these are classic MMC psychological footprints.
⚙️ Trade Plan (Educational Purpose Only):
🔹 Bullish Bias:
Entry: On confirmation above the minor BOS or demand retest.
Stop: Below the recent demand zone.
Target: $34.50 Major Resistance area.
🔹 Bearish Watch:
If price rejects from the curve or fails to hold above demand zone…
Price could revisit $32.50 or lower to re-test curve zone again.
📘 Final Thoughts:
This chart is a masterclass in how Mirror Market Concepts work. From the curve zone support to the demand hold, and now a clear target in sight, everything is lining up beautifully.
If you’re a price action trader, this is the kind of structure you wait weeks for.
If the bullish scenario plays out, we could see Silver make a strong run toward the $34.50 resistance zone in the coming days.
Keep your eyes on:
Curve zone support holding
Demand confirmation

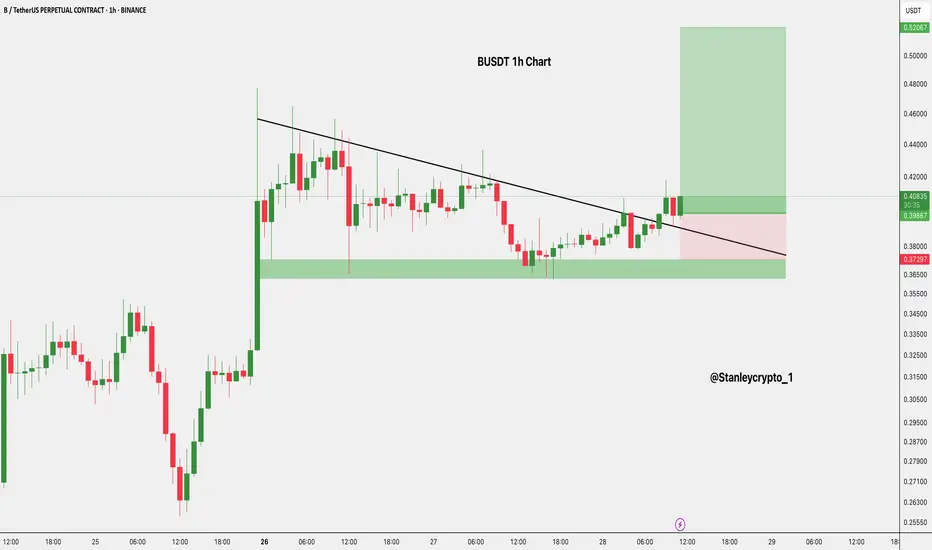
$B Long Setup 1H Chart Price has broken out of the trendline and is retesting the breakout zone
Strong support is seen around the $0.36–$0.37 demand zone.
- Entry: CMP
- Stop Loss: $0.37297
- Targets:
• TP1: $0.44455
• TP2: $0.53243
DYOR | NFA
SHYAM METALICS – Breakout Zone Alert Price is approaching a key resistance zone (~₹950) after breaking out of a descending channel with strong volume and RSI confirmation.
This setup indicates potential bullish continuation.
📌 Trade Plan:
Buy above ₹955
Stoploss: ₹915
Target 1: ₹1,010
Target 2: ₹1,065
Sell below: ₹915 (only if price rejects resistance with volume)
Reasoning:
Price broke long-term downtrend
Strong volume and RSI > 60
Clean resistance breakout in sight
For Education Purposes Only

2 out of 2? gBPcAd..iT’s tIMe yET?1D- Daily timeframe we saw price break structure lower but after the break price did not move lower in fact we saw it retracing.
4H- Here price agreed with the daily by breaking structure higher to go take the liquidity(Internal) resting higher, if we take a closer look at the leg that broke structure higher we can than identify imbalances in price and as ICT mentions price looks for two things 1. liquidity and 2. Imbalances. Right now our focus is price balancing before going for the buyside.

Bajaj Finserv Ltd scending Triangle formation on the monthly📌 Trade Setup: Bajaj Finserv Ltd (NSE)
Pattern: Ascending Triangle
Timeframe: Monthly
Signal: Approaching breakout of horizontal resistance zone
✅ Buy Recommendation
Buy above: ₹2,075 (Monthly close above resistance confirms breakout)
Aggressive entry: ₹2,035 (Current level with early risk)
Target 1: ₹2,400
Target 2: ₹2,750
Target 3: ₹3,000+ (Long-term projection from triangle height)
❌ Stop Loss
SL: ₹1,850 (Below recent swing low and trendline support)
for educational purposes only

Institutional Rotation & Setup for Potential Re-Rating in 2025 I have outlined some areas of interest in the chart and some possible ways to reach 2.50 area. Below my personal thoughts behind this.
Institutional Activity & Accumulation
• Mirabella Financial Services LLP holds 10.48% (77.6M shares); estimated VWAP entry: ~1.4217 NOK.
• Alden AS holds 32M shares (4.3%) and remains a large holder after trimming slightly.
• Previous active players in 2024 (Skøien AS, Tigerstaden AS, Dukat AS) have exited, marking a rotation.
• Institutional base is solidifying — setting the stage for potential re-rating in 2025.
Technical Structure
• Institutional accumulation range: 1.10 – 1.30 NOK.
• Strong historical bid defense around 1.150 – 1.160 NOK.
• Previous resistance: 1.40 – 1.45 NOK. Break above this level could trigger expansion leg.
• Volume patterns align with accumulation and shakeout phases.
Trade Strategy
• Add Zone: 1.15 – 1.18 NOK (on strength or dip support hold).
• Watch Zone: 1.22 – 1.26 NOK (for volume and continuation breakout).
• Profit Trim Zone: 1.55 – 1.65 NOK (historical upper range boundary).
• Stop Loss Consideration: Below 1.13 NOK (only if broken on volume).
Risk Management
• Watch for loss of support with accelerating volume.
• Avoid adding on breakdowns below 1.13 NOK.
Upcoming Catalysts
• Commercialization of solid-state batteries (volume shipments, integration deals).
• Revenue reports showing real customer traction.
• New strategic partnerships or OEM announcements.
• Market sentiment shift on green battery tech / reshoring themes.
Smart Money Summary
• Entry confirmation from Mirabella (~1.42 NOK), Alden (~mid-1.30s).
• 1.15 – 1.20 NOK has been a recurring buy zone across many sessions.
• Institutional rotation shows early traders out, long-term capital in.
Risks
• Early product and production phase.
• Funding might be needed in Q2 - 2025.
• General market sentiment due to high volatility at the moment.
Disclaimer: This post is for informational and educational purposes only and does not constitute investment advice or a recommendation to buy or sell any securities. The content reflects personal analysis and opinion based on publicly available data. Please conduct your own due diligence or consult a licensed financial advisor before making any investment decisions. I hold a personal position as disclosed and may update or change it at any time without notice.

VEDL long consolidation BOStock will start booming after a consolidation at a resistance before BO; otherwise, a reversal is likely from resistance if the supply is huge.
For a successful breakout, we should ideally see a strong 1week candle on our chart—it’s crucial to use that timeframe.
Following the breakout, the ideal entry point would be after a consecutive candle that breaks above the breakout candle
As always, remember to do your own research before making any investment decisions!

APL Apollo Bullish Breakout – Eyeing Higher Resistance Levels!➡️ Bullish breakout above ₹1510.45
➡️ Next targets at ₹1586.95, ₹1654.25, ₹1728.75

FSL Ready for Action: Breakout Looms with Key Levels to Watch
Bullish breakout above ₹322.45
Bearish breakout level: ₹300.75
Upside target: ₹344.50
Support levels: ₹275.05 and ₹237.08
Keep an eye on these levels for a potential breakout.

SBIN: Watch for Breakout - Bullish or Bearish?
Bullish Breakout Level: Above ₹832.15
Potential Upside: Targeting ₹899
Bearish Breakout Level: Below ₹794.75
Potential Downside: Targeting ₹731.10
Critical Juncture: The stock is at a key decision point. Monitor closely for a breakout in either direction to plan your trade.

IIFL Securities Ltd: Symmetric Triangle Setup➡ Symmetric Triangle pattern observed
➡ Breakout potential on either side
➡ Resistance at ₹240
➡ Strong support at ₹178

Coal India Ltd - Approaching Breakout LevelCoal India is nearing a crucial resistance level at 543.00. A breakout above this level could signal a strong bullish move. The stock has been following an ascending trend line, showing consistent upward momentum. Watch for a potential breakout and follow the trend for trading opportunities.


TATASTEEL : Awaiting Breakout Either DirectionIn Box range from few days.
Awaiting Breakout in either direction #BreakoutSoon
