AUDCHF Bearish Breakout Alert!➡️ Support Breakout: Awaiting a close below 0.56726
➡️ Target: 0.55174 📉
⚠️ Watch for a confirmed breakout below the support level for potential downside movement.
Breakoutsignal

TRENDLINE BREAKOUT IN VIP INDUSTRIES...NSE:VIPIND trade at 510. Stocks has given a trendline breakout. You can watch for an upside move at 650-700...

HOT Spot Trade | 2500 % or ATH in 2025🔥 HOT (Holo) is setting up for a massive 2500% surge or a new ATH in the 2025 bull run! With its unique decentralized hosting platform gaining traction, this could be a long-term winner. Don't miss the ride! 🚀 #HOT #Crypto #ATH"

CAD/CHF Bearish Pressure with Descending Trend Line➡️ Descending trend line shows bearish pressure
➡️ RSI divergence indicates weakening momentum
➡️ Bearish breakout expected below support at 0.6241
➡️ Next target: 0.6151 on the downside

GRASIM: Awaiting Bullish Breakout with Key Resistance Levels
Bullish breakout expected above ₹2,781.25
Upside target: ₹2,866.55

GBP/USD Breakout Alert: Potential Bear Ride Ahead!
Breakout Inside Day: A breakout inside day pattern is observed, signaling a potential move.
Critical Level: A close below 1.3100 could indicate a strong bearish momentum.
Support Zone: The next major support is at 1.2800, which could be the target if the bearish trend continues.
RSI Insight: RSI at 58 suggests momentum is cooling, making it a critical point to watch for a potential downturn.

HFCL Breaks Out: Bullish Momentum Ahead➡️ Bullish breakout above ascending trendline
➡️ Next target: ₹160 on the upside

GBPJPY Daily Chart: Bullish Breakout with Rising RSIJoin the Ride!!
➡️ Bullish breakout above the ascending trend line
➡️ RSI trending upwards, indicating bullish momentum
➡️ Next targets: 199.496, 204.255, 208.092 on the upside

AUDJPY Daily Chart: Bullish BreakoutBullish breakout above the ascending trend line.
Immediate resistance levels:
101.767
105.771
109.407
RSI showing bullish momentum.
Potential continuation of the upward trend.

$TSLA: Awaiting Breakout - Is Tesla Ready to Surge?
Breakout Level: Awaiting breakout above $215.66
Resistance Levels:
First Resistance: $221.05
Second Resistance: $224.85
Third Resistance: $228.26
Watch Point: Tesla is nearing a key resistance level. A breakout above $215.66 could trigger a strong bullish move.

INFY: Bull Ride Begins! Breakout Signals Strong Uptrend
Breakout Level: Above ₹1,951.30 - Confirmed
Support Level: Previous resistance at ₹1,902.55 now acting as strong support
Trend: Ascending trend line indicating continued upward momentum
Action: Monitor closely as the stock shows strong bullish signs

ASIANPAINT: Awaiting Breakout? Short Opportunity Ahead!Breakout Level: Awaiting a breakout at ₹3,203.10
Resistance Targets:
Target 1: ₹3,321.70
Target 2: ₹3,422.20
Festive Season Outlook: With Diwali approaching, keep a close watch on this stock for potential movements.

ABCAPIT Aditya Birla Capital Ltd. - Bullish Breakout Alert
➡️ Bullish breakout near ₹229.38 confirmed.
➡️ Resistance Target: ₹246.63

UCAL - 6 YEARS OF "W" PATTERN BREAKOUT6 Years of "W" Pattern Breakout breakout
BUY PRICE : 190
SL : 150 (only for swing traders)
TARGET : 250, 330 (72%)
Disclaimer - All information on this page is for educational purposes only,
we are not SEBI Registered, Please consult a SEBI registered financial advisor for your financial matters before investing And taking any decision. We are not responsible for any profit/loss you made.

GOOGL Awaiting Breakout in Symmetric Triangle!Symmetric Triangle forming, awaiting breakout either side!
🔼 Resistance levels: 176.39, 183.75, 191.85
🔽 Support levels: 154.81, 151.02

CAD/CHF Approaching BreakoutWatching closely for a potential breakout:
➡️ Bullish Breakout above 0.63000
➡️ Bearish Breakout below 0.62406
➡️ Resistance at 0.63701, Support at 0.61519

AUD/CAD on the Verge of Breakout: Key Levels to Watch
➡️ Bullish breakout above 0.9196
➡️ Bearish breakdown below 0.9114
➡️ Key levels to watch for potential moves
🔹 Resistance: 0.9264
🔹 Support: 0.9017 and 0.8949

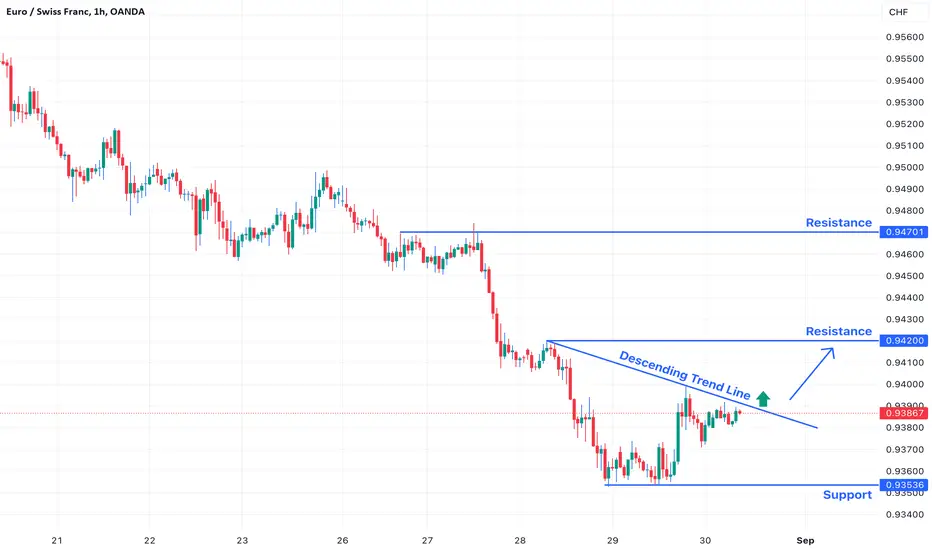
EURCHF: Descending Trend Line Breakout Potential➡️ Awaiting a breakout from the descending trend line.
➡️ Key resistance at 0.9420 and 0.9470.
➡️ Support at 0.9350.
CAD/JPY - Awaiting Symmetric Triangle Breakout
Symmetric Triangle formation observed.
Possible breakout on either side.
Key resistance at 108.84 and 112.08.
Supports to watch at 106.20 and 104.22.

AUD/USD Poised for a Breakout - Key Levels in Play📉 Support: Bearish breakout below 0.6762 could lead to 0.6697
📈 Resistance: Bullish breakout above 0.6813 may target 0.6871
Keep an eye on these levels as they signal potential movements.

GBPJPY: Awaiting Breakout frm Ascending Trend Line or ResistanceAwaiting Breakout from Ascending Trend Line & Resistance at 192.05
🔼 Potential bullish move above 192.05 targeting 199.52.
🔽 Watch for a bearish breakdown below 188.00 towards 180.09 support.

ETHUSD: Symmetric Triangle - Awaiting Breakout
BITSTAMP:ETHUSD is currently consolidating within a symmetric triangle pattern, indicating a potential breakout in either direction.
Resistance Level: $2,699
Support Level: $2,395
Watch these key levels as Ethereum nears the apex of the triangle, which could lead to a significant move.

AUD/CAD: Awaiting Breakout from Descending Trend Line➡ Awaiting breakout from the descending trend line
➡ Key resistance levels: 0.9185 and 0.9197
➡ Strong support at 0.9120
AUD/CAD is testing the descending trend line, with a potential breakout on the horizon. Traders should watch these levels for a clear directional move.
