EURCAD Short Order 😲Hello everyone,
Short trade/
Trend breakout, in my opinion buy after the market will open in one descending chart.
In my opinion :
TP 1.45500
SL 1.48000
Thank You, and Goodluck.
I will appreciate your Like & Follow us. 💓 💓 💓
Breakoutsignal

Life time High fundamental Let's begin analysis
Today stock SHALBY Ltd
•This stock was listed in DECEMBER 2017 but stock at 210 level work for that time as support but 2018 March this support break down 40 level it's 400+% down from High level.
•after 400% down stock trying hit and breakout 210 level in August 2021 but it work as resistance.
•stock come upto 100 leve from resistance level of 210, from 100 level stock creating higher high and High low formation.
•Now stock break resistance of 210 with High valume, the valumes are given idea about accumulation of the stock.
•keeping 185 as Stop loss get chance 280+, stock life time High also 270
•risk reward ratio 1:2
no recommendation for but and sell

JULY 26 RECOMMENDATION FOLLOW US
Product Portfolio
The Co. is engaged in the manufacturing of agricultural tractors, engines for agricultural tractors, construction, earthmoving and material handling equipment, round and flat tubes, heating elements, double-acting hydraulic shock absorbers for railways coaches, centre buffer couplers, automobile shock absorbers, telescopic front fork & Mcpherson struts, brake block, internal combustion engines and all types of brake used by railways.
Market Share
Agri Machinery: The Co. has a ~10.3% domestic market share in the manufacturing of tractors as of March 2022 against 11.3% in March 2021. The capacity utilization in FY22 stood at 75%.
Construction Equipment: The Co. has a market share of ~43% in the manufacture of Cranes and 12.6% market share in the manufacture of compactor and 2.3% market share in the manufacturing of BHL. During FY22, the segment operated at a capacity utilization of 42%.

EURUSD Still downtrendShort Position in my opinion.
EURUSD Still downtrend.
Break some important area.

Breakout stock life time High Weakly chart
1) Life time High working as resistance for the stock but now breakout at 228-230 level.
2) Channel pattern follow and now breakout.
3) Higher high and higher low formation.
4) 2018 and channel pattern breakout with High valume
5) global market in down but this stock breaking life time High so the have potential to create new life time High
6) stock may be take advantage of government development just resently announced by PM Modi
7) keep stop loss of 175-180
8) my Target to be 500 is the sentiments resistance
9) risk reward fit 1:6
10) 50SMA 170 this can be considered for stop loss
11) SMA 100 152
12) SMA 200 98
NO RECOMMENDATION FOR BUY OR SELL

BTCUSDT heavy dump ahead Soon last support zones here will break and after that heavy dump is ahead like the red arrows on chart and first support is 29K$ support zone and the second one is green trendline.
DISCLAIMER: ((trade based on your own decision))
<

How to trade Fake Breakouts in the range Range trading, characterized by price oscillations within defined support and resistance levels, offers traders a structured approach in sideways markets. However, even within these stable waves, deceptive price movements known as fake breakouts can occur. These false signals can lead traders astray if not properly recognized and managed. In this article, we'll delve into the world of fake breakouts within range trading, equipping you with strategies to identify and navigate these misleading market dynamics.
Understanding Fake Breakouts:
A fake breakout occurs when price seemingly breaches a support or resistance level but quickly reverses back into the established range. These deceptive moves often trigger stop-loss orders and entice traders into taking positions in the direction of the apparent breakout, only to experience a sudden reversal against their trades. Fake breakouts are fueled by market manipulation, emotional trading, or sudden news events.
Here are few examples of fake breakouts in big Time-frames :
Often, this is not enough for entering a position.
Combine this with divergences on RSI or other factors for entry.
Key Characteristics of Fake Breakouts:
Swift Reversal: A true breakout sustains its direction, while a fake breakout swiftly reverses back into the range.
High Volatility: Fake breakouts often coincide with spikes in volatility due to market confusion and emotional reactions.
Trapped Traders: Traders who entered positions based on the fake breakout are "trapped" when the market reverses, leading to potential losses.
Navigating Fake Breakouts:
Confirmation Through Candlesticks: Wait for candlestick confirmation beyond the breakout level. A close above resistance or below support lends greater credibility to the breakout.
Increased Volume: Look for a surge in trading volume accompanying the breakout, indicating genuine market participation.
Use of Indicators: Rely on technical indicators like the Relative Strength Index (RSI) or Moving Average Convergence Divergence (MACD) to validate breakout momentum.
Strategies for Trading Fake Breakouts:
False Breakout Reversal: Enter positions in the opposite direction of the fake breakout when price returns to the range, targeting a retracement towards the opposite boundary.
Wait-and-Watch Approach: Allow the breakout to develop and wait for confirmation before entering a trade, avoiding pre-mature positions.
Risk Management When Dealing with Fake Breakouts:
Tight Stop-Loss: Set a tight stop-loss order beyond the breakout point to limit potential losses if the breakout reverses.
Position Sizing: Allocate a smaller portion of your capital to trades involving potential fake breakouts due to the increased risk.
Pros and Cons of Trading Fake Breakouts:
👍 Pros:
Opportunities in Deception: Skilled traders can capitalize on market deception by trading against fake breakouts.
Enhanced Risk Management: Proper identification of fake breakouts allows traders to minimize losses through tight stop-loss orders.
👎 Cons:
Increased Complexity: Identifying fake breakouts requires additional analysis and indicators.
Risk of Mistakes: Mistaking a genuine breakout for a fake one or vice versa can lead to missed opportunities or losses.

Sapphire Foods India Ltd - Breakout StockAnother Breakout stock that came on my radar is Sapphire Foods India Ltd
This stock has been consolidating in a range since its listing.
The consolidation is happening in an ascending triangle.
Currently, the stock is trading near the resistance in a small range of approx 12 % from the past 9 weeks, suggesting there's is a high chance of a breakout this time.
And if the breakout happens the consolidating range would replicate on the upside and we can see the stock moving towards 2000 levels in the coming months.

Pull back to 0.95Monthly Chart
SUSHI BINANCE:SUSHIUSDT has downed 98% from ATH and created a reversal pattern DB
Daily Chart
Now, SUSHI is trading at 0.71x
BINANCE:SUSHIUSDT will move up to 0.95 for correction phase
Chart 4H TF
BINANCE:SUSHIUSDT is range from 0.7 - 0.75
Wait for breakout that range

Bikaji Looking Good Bikaji test Good Above 450
i think have be a big move .its makeing a Cup and Handle
Watch on Radar

HPAL Ready For Breakout HP ADHESIVES is a stock that can be another great positional pick considering the great risk-reward ratio it is offering right now.
The reason I picked this stock is that, it has been consolidating for the past 8 weeks in a tight range of approx 8-10%.
And this consolidation is happening at previous resistance around 410-460 levels, where the stock took resistance multiple times in the past.
Price Resistance
First in Jan 2022
Second on April 22
Third on Sep 22
And this time from June 22
By looking at price action, the breakout looks inevitable on the charts and stock can move fast towards 500 to 560 levels in the coming weeks which would constitute approx 20-23% return in a short span of a few weeks.

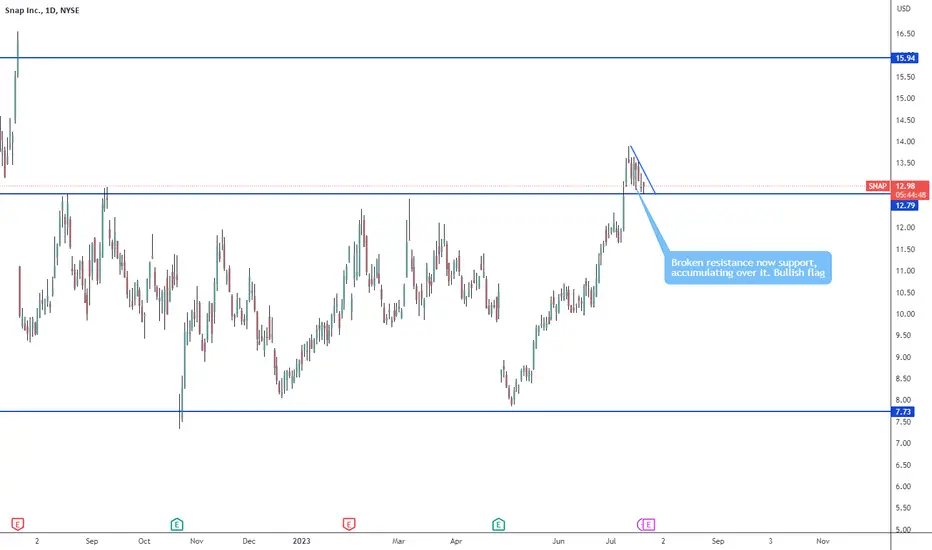
Calls idea - bullish flagI have some calls expire 07/28 strike 13. Looks like the price is forming a bullish flag, and giving it a whole week to break out and buying just above the support. Mi risk is low.
NIFTY IT near crucial breakout level.CNX IT on the verge of breakout above 31,100. It would be worth keeping an eye on the whole IT pack. Many like TECHM have been breaking out.
❤ & follow?

BTCUSD Potential Breakout TradeBTCUSD moving in range now wait for breakout to trade or place your buy stop and sell stop.
Manage risk according to your account size.

Breakout Trade in SHOPShopify is emerging from a beautiful Stage 2 base.
SHOP is up more than 100% since the start of a year – a clear sign this is a market leader.
Notice how volume is higher on the rallies up and lower when the stock pulls back. This is a subtle clue that buyers are in control and the smart money is building a position.
The breakout on Thursday came on 2X its average daily volume and the stock closed at the high of the candle – both good signs of a legitimate move.
I want to see SHOP stay above the breakout level or, at a minimum, above its 21-day moving average (blue line on chart).

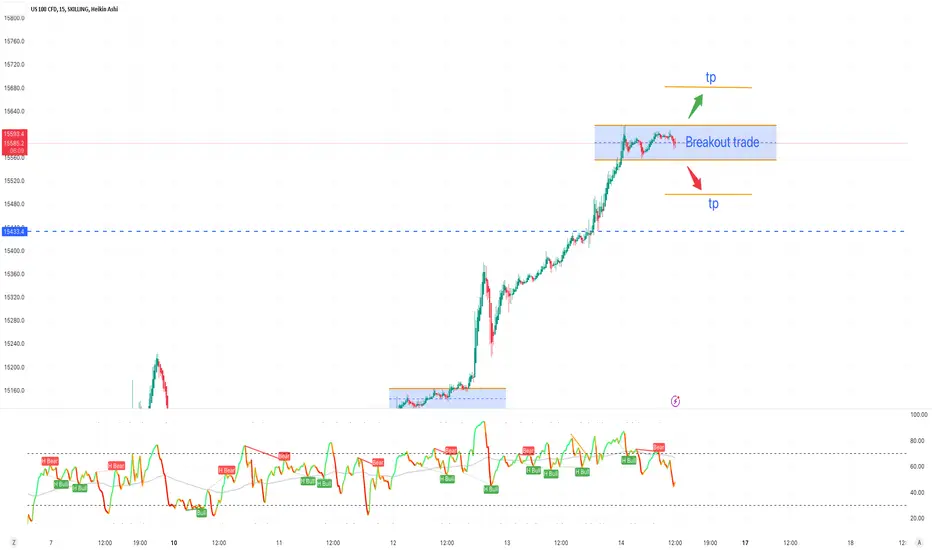
NASDAQ Breakout Trade PlanNASDAQ moving in range now wait for breakout to trade or place your buy stop and sell stop.
Manage risk according to your account size.
comp buy long Entry: 71.51
Profit: 220.91 (208.92%)
Stop: 51.14 (28.49%)
hello Traders, here is the full analysis for this pair, let me know in the comment section below if you have any questions, the entry will be taken only if all rules of the strategies will be satisfied. I suggest you keep this pair on your watchlist and see if the rules of your strategy are satisfied. Please also refer to the Important Risk Notice linked below.

BSE pullback or breakout?BSE weekly chart, price has reached the 700 zone for the third time. Was rejected twice from here in 2022. Successful breakout could eventually lead price to 950.
Don't rush in, buy only on pullbacks, retests after breakout.
Boost & follow for more.

GBPUSD Potential Breakout TradePotential Breakout trade on currency pair GBPUSD, place Buy Stop and Sell Stop Orders or wait for Breakout.
Manage your risk accordingly.

BTCUSD Resistance Break Trade SetupIf BTC broke the resistance we can see it around 32500 levels, place buy stop or wait for breakout.

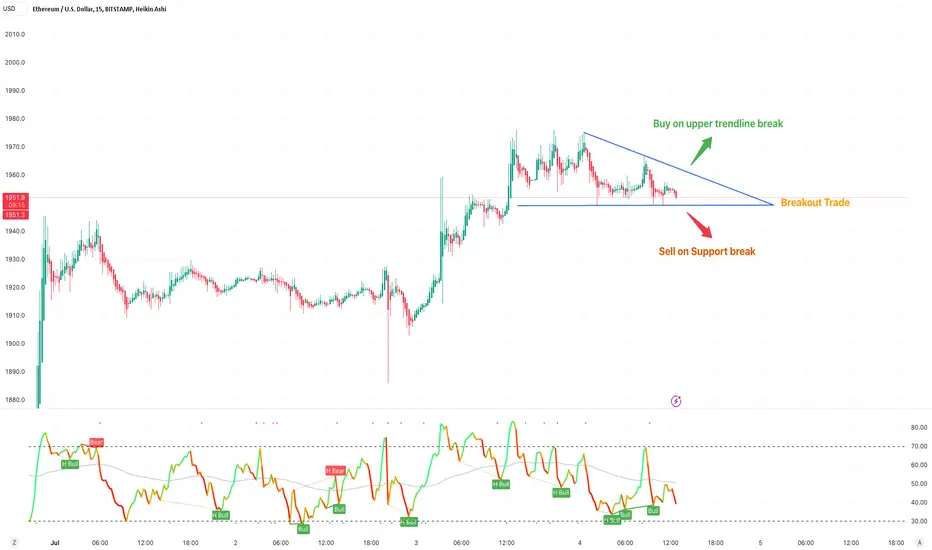
ETHUSD Breakout TradePlace your buy stop and sell stop or wait for breakout of trendline or support to get into the trade.
Manage your risk accordingly!
EURJPY Breakout Trade IdeaEURJPY Breakout Trade, place buy and sell stop.
Manage your risk according to Account Size!

IONQ is set for a breakoutNYSE:IONQ is breaking out from Stage 1 into Stage 2 with huge volume. Note this is on weekly and it would need at 2-3 quarters to pain out. For investors who want to hold long term the initial breakout is good entry point, but for traders they should wait for 2nd bounce after retrace from initial breakout.
NYSE:AI is retracing today back to the mean.
