Breakoutsignal

GMM next push up possible soonCoiling up after an amazing run-up. Set alerts, could be really profitable.
Details on the chart
Good luck traders

SUSHI USDT BULLISH TREND IN I HR TFBINANCE:SUSHIUSDTPERP Bullish Trend 1 HR TF, wait for break the level.

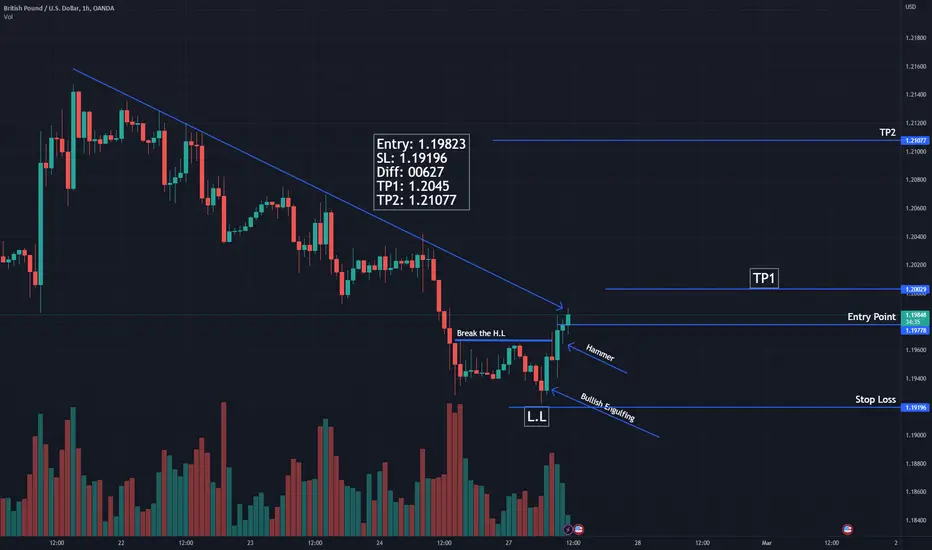
GBPUSD Bullish Trend Start in 1 HR TF.OANDA:GBPUSD On this chart, the first candle is a Bullish Engulfing Candle, and the second candle is a Hammer Candle. Mean buyers dominate the market at this time. GBP IUSD Break of previous Higher Low
Xau/UsdHello traders! In my opinion, this pair is sell.
Targets:
Sell 1786.50 (pivot)
Sell 1760.00
Sell 1720.00
Be careful and wait for a confirmation!
Don`t forget to look at the economic calendar!
MAKE MONEY AND ENJOY LIFE 💰
THANK YOU!
GOOD LUCK!
🙏🏻🙏🏻🙏🏻

PAYTM Expecting paytm to make a fresh move from here with the rumour of airtel investment in paytm.
Neat and clean Breakout on weekly chart with completion of retest done ✅
Breakout Volume Increase 💪
CMP 623
TGT 750-800+
Note: Just an idea not any recommendation to buy or sell the particular stock.

OGNUSDT needs the breakout!OGNUSDT is testing the descending channel below the static resistance level.
A descending channel is a technical analysis pattern that consists of two downward sloping trendlines. The upper trendline represents resistance, while the lower trendline represents support. In this case, the price of OGNUSDT is testing the lower trendline of the descending channel, which indicates a bearish trend.
Additionally, the static resistance level indicates an area where sellers are likely to take control of the price, making it difficult for buyers to push the price higher. If the price of OGNUSDT breaks above this level, it could signify a shift in momentum and the potential for a bullish trend.
To confirm a bullish trend, traders would need to wait for a breakout from the descending channel that satisfies Plancton's rules. Plancton's rules are a set of technical analysis guidelines that aim to identify high-probability trading opportunities. These rules include looking for strong trends, clear price patterns, and confirmation.
In summary, the current situation for OGNUSDT suggests a bearish trend within a descending channel below the static resistance level. Traders should watch for a breakout from the descending channel that satisfies Plancton's rules before entering a long position.
–––––
Follow the Shrimp 🦐
Keep in mind.
🟣 Purple structure -> Monthly structure.
🔴 Red structure -> Weekly structure.
🔵 Blue structure -> Daily structure.
🟡 Yellow structure -> 4h structure.
⚫️ Black structure -> <= 1h structure.
Follow the Shrimp 🦐

FCPO PALM CRUDE OIL INDEX BURSA MALAYSIABottom reversal pattern has been form on week 03-Oct-2022
Currently FCPO price in sideway range between 3730 (support)- 4500 (resistant)
Trade Strategy: (BUY / CALL)
Once FCPO price break out & goes beyond price 4500 with increasing volume.
TP1: 4990
TP2: 6230
CL: 3730
Risk Ratio Reward - 1 : 2
Fact supporting indicator:
Smart Money Pro bullish Profit-Chip (red bar) continuous increases for 3weeks and crossed over Profit-Chip Moving Average line.
#bursasaham #malaysiastockmarket #fcpo #palmcrude #bursamalaysia #malaysia #bursa
#trendline #trendanalysis #technicalanalysis #chartpattern #trendpattern #uptrend #bullbear
#supportresistance #technicalindicator #indicator #waveanalysis #bottomcatch #reversalsignal
Disclaimer:
This published Idea is solely for the purpose of education and opinion sharing, and should not be construed as investment advice or recommendations to buy or sell any security.
Get your trade advise from a legit broker, you are responsible on your own trade.

ZENTEC Weekly breakout zentec a good weekly breakout stock. Good volume seen. Accumulation zone 250-230

DOTUSDT Time to breakout?DOTUSDT is currently in an accumulation phase, as the market is consolidating below the key level of $7 on a weekly basis. During this phase, the price has been printing Higher Highs and Higher Lows, which indicates that buyers have been gradually gaining strength over sellers.
An accumulation phase is typically characterized by a period of sideways movement in the price, as buyers and sellers work to establish a new equilibrium. This can often take place after a prolonged downtrend, when investors are looking for a bottom in the market.
In the case of DOTUSDT, the accumulation phase is occurring below the important $7 level, which is a critical area of support and resistance. This level has held as a strong barrier to upside movement in the past, and as such, any potential breakout above it could signal a significant shift in market sentiment.
As we wait for a new breakout, it's important to keep an eye on Plancton's rules, which are a set of guidelines for identifying potential market movements. If and when a new breakout occurs, we can apply these rules to help guide our decision-making and potentially open a new long position.
–––––
Follow the Shrimp 🦐
Keep in mind.
🟣 Purple structure -> Monthly structure.
🔴 Red structure -> Weekly structure.
🔵 Blue structure -> Daily structure.
🟡 Yellow structure -> 4h structure.
⚫️ Black structure -> <= 1h structure.
Follow the Shrimp 🦐

BTSUSDT wants the breakout?BTSUSDT is testing dynamic support after a clear breakout of daily resistance. This indicates that the market has experienced a significant shift in momentum, with bulls taking control.
The dynamic support level refers to a moving average that adjusts to the most recent price action. In this case, the price is testing this support level, which suggests that buyers are willing to step in and buy at this price point. This is a positive sign for those looking for a long position in BTSUSDT.
If the price of BTSUSDT breaks out of this dynamic support level and satisfies Plancton's rules, it would be a strong signal to go long. Plancton's rules are a set of technical analysis guidelines that aim to identify high-probability trading opportunities. These rules include looking for strong trends, clear price patterns, and confirmation.
–––––
Follow the Shrimp 🦐
Keep in mind.
🟣 Purple structure -> Monthly structure.
🔴 Red structure -> Weekly structure.
🔵 Blue structure -> Daily structure.
🟡 Yellow structure -> 4h structure.
⚫️ Black structure -> <= 1h structure.
Follow the Shrimp 🦐

Best Buy Co. a best buy ⁉Placed my buy order in this stock. As you've seen the price has broken the consolidation rectangle to the upside. So let's see how this plays out ...

FIRSTSOURSE SOLUTION BREAKOUT soonFirstsourse Solution Lts. a breakout soon stock. stock above 30WMA . Trying to move into stage 2

GALAUSDT is ready for the breakout?The current price of GALAUSDT is testing a dynamic resistance level in the $0.05 area where the market also has a static daily resistance level. Additionally, the price is creating an inverse head and shoulders pattern, which is a technical chart pattern that may indicate a potential trend reversal from a downtrend to an uptrend.
An inverse head and shoulders pattern consists of three distinct troughs or valleys with the middle trough being the lowest, forming the "head," and the two outer troughs forming the "shoulders." The middle trough or the "head" is typically lower than the shoulders, and the pattern is completed when the price breaks above the "neckline," which is a trend line drawn connecting the high points between the shoulders.
If the price of GALAUSDT is able to break out from the neckline of the inverse head and shoulders pattern and the market satisfies Plancton’s rules, it may be a signal for a long position. To satisfy Plancton’s rules, a trader may have a predetermined entry price, set stop loss and take profit levels to manage risk and maximize profits, and monitor the price action for any signs of a trend reversal or invalidation of the initial analysis.
–––––
Keep in mind.
🟣 Purple structure -> Monthly structure.
🔴 Red structure -> Weekly structure.
🔵 Blue structure -> Daily structure.
🟡 Yellow structure -> 4h structure.
⚫️ black structure -> <= 1h structure.
–––––
Follow the Shrimp 🦐

OGNUSDT wants the breakout?The price of OGNUSDT is currently attempting to create a breakout from a supply area, which is a price range where sellers are more likely to enter the market and sell their assets, causing downward pressure on the price.
During its attempts to break out, the price of OGNUSDT has bounced several times on a dynamic support level, which is a price level that moves with the price action over time. This support level has provided a base for the price to rebound and gain new liquidity from a demand zone, which is a price range where buyers are more likely to enter the market and purchase assets, causing upward pressure on the price.
As traders, we are now waiting for the price to successfully break out from the supply area and apply Plancton’s rules for a long position, which may include buying OGNUSDT at a predetermined entry price, setting stop loss and take profit levels to manage risk and maximize profits, and monitoring the price action for any signs of a trend reversal or invalidation of our initial analysis. By following these rules, we aim to increase our chances of profiting from the potential uptrend in the price of OGNUSDT.
–––––
Follow the Shrimp 🦐
Keep in mind.
🟣 Purple structure -> Monthly structure.
🔴 Red structure -> Weekly structure.
🔵 Blue structure -> Daily structure.
🟡 Yellow structure -> 4h structure.
⚫️ Black structure -> <= 1h structure.
Follow the Shrimp 🦐

#linc #nsestockstobuyIts breaking 2018 high. I think it is best for further next move I have done my strategy check with your strategy. Must take stop loss before buy.

COCOS - next push soon?The oscillators look ready for another push. Details on the chart.
Good luck traders

MKRUSDT is loading a breakout?MKRUSDT recently experienced a false breakout from the daily resistance level, which is a key level that often represents a point of strong supply and demand. When the price breaks through this level, it can indicate a significant shift in market sentiment and a potential change in trend direction.
However, in this case, the breakout turned out to be false and the price is currently inside a descending channel. The market will need to create a new breakout from the static resistance level at around $760 for any long continuation to occur. This level is another key area of support and resistance and is a crucial level to monitor as it can indicate the direction of future price movement.
If the price breaks above this resistance level, we can apply Plancton's Strategies, a set of guidelines for identifying potential market movements, to help guide our decision-making and potentially open a new long position.
According to Plancton's strategy , we can set a nice order
–––––
Keep in mind.
🟣 Purple structure -> Monthly structure.
🔴 Red structure -> Weekly structure.
🔵 Blue structure -> Daily structure.
🟡 Yellow structure -> 4h structure.
⚫️ black structure -> <= 1h structure.
–––––
Follow the Shrimp 🦐

Take-Off for Micron Technology📈
above all moving averages
has just broken through the decending trendline
bullish seasonality
Expecting the price to rise in the next weeks and months.

EOSC - falling wedgeOut of space soon. It had a nice pump so attention is there.
Details on the chart
Good luck traders

This is what my BITCOIN CHART is showing me.Traders,
Looks like the Cup and Handle pattern I anticipated previously is being legitimized by recent price action. Here's where we go pending confirmation on the daily.
Stew

EURJPY potential breakout$EURJPY $EXY Do you think a breakout is possible EXY is reaching a trendline that has been tested 4 times and has broken out of horizontal support, also a huge amount of bullish volume is shown in EURJPY. Yet, again I don't trade breakouts this is just a thought.

USDJPY: potential long setupHey guys, here's a potential UJ move for this week maybe.
Based on the last 3-4 daily candles, the price direction looks quite bearish to me, so I will wait for either a small correction for a better entry with greater RR, BUT much riskier, or a break of the recent resistance zone and daily 50EMA and subsequent entry for a long position after a pullback to the same zone or near it.
