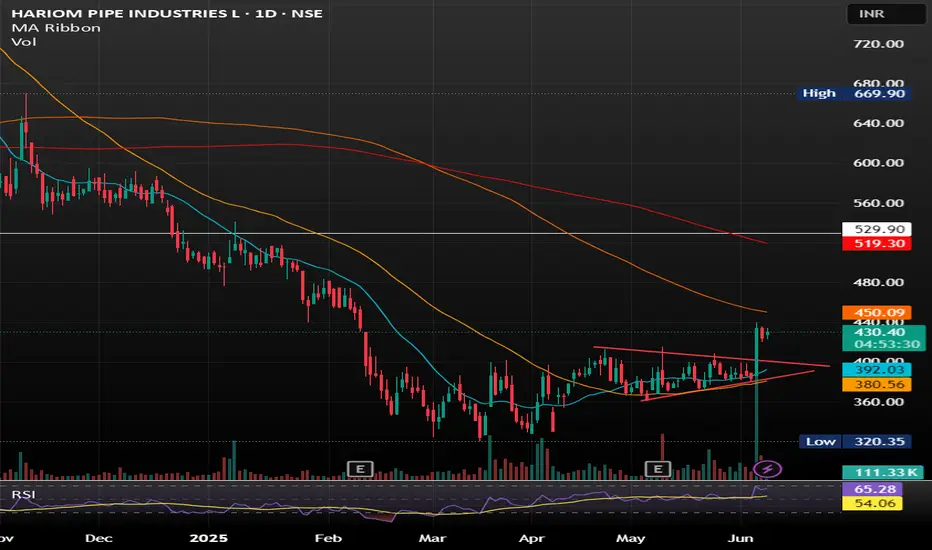
Hariom Pipes Industries Ltd Hariom Pipes Industries Ltd is a leading manufacturer of high-quality steel products, including HR Pipes, GI Pipes, GP Pipes, MS Pipes, HR Coils, and Billets. The company was established in 2007 and has grown into a major player in the iron and steel industry in India.
SYMETRIC TRIANGLE BREAKOUT WITH GOOD VOLUME SHOWING GOOD UPWARD MOMENTUM .
BUY IN ANY PULLBACK SUGGESTS.
Breakoutsignal
Amazing breakout on WEEKLY Timeframe - FORTISCheckout an amazing breakout happened in the stock in Weekly timeframe, macroscopically seen in Daily timeframe. Having a great favor that the stock might be bullish expecting a staggering returns of minimum 25% TGT. IMPORTANT BREAKOUT LEVELS ARE ALWAYS RESPECTED!
NOTE for learners: Place the breakout levels as per the chart shared and track it yourself to get amazed!!
#No complicated chart patterns
#No big big indicators
#No Excel sheet or number magics
TRADE IDEA: WAIT FOR THE STOCK TO BREAKOUT IN WEEKLY TIMEFRAME ABOVE THIS LEVEL.
Checkout an amazing breakout happened in the stock in Weekly timeframe.
Breakouts happening in longer timeframe is way more powerful than the breakouts seen in Daily timeframe. You can blindly invest once the weekly candle closes above the breakout line and stay invested forever. Also these stocks breakouts are lifelong predictions, it means technically these breakouts happen giving more returns in the longer runs. Hence, even when the scrip makes a loss of 10% / 20% / 30% / 50%, the stock will regain and turn around. Once they again enter the same breakout level, they will flyyyyyyyyyyyy like a ROCKET if held in the portfolio in the longer run.
Time makes money, GREEDY & EGO will not make money.
Also, magically these breakouts tend to prove that the companies turn around and fundamentally becoming strong. Also the magic happens when more diversification is done in various sectors under various scripts with equal money invested in each N500 scripts.
The real deal is when to purchase and where to purchase the stock. That is where Breakout study comes into play.
Check this stock which has made an all time low and high chances that it makes a "V" shaped recovery.
> Taking support at last years support or breakout level
> High chances that it reverses from this point.
> Volume dried up badly in last few months / days.
> Very high suspicion based analysis and not based on chart patterns / candle patterns deeply.
> VALUABLE STOCK AVAILABLE AT A DISCOUNTED PRICE
> OPPURTUNITY TO ACCUMULATE ADEQUATE QUANTITY
> MARKET AFTER A CORRECTION / PANIC FALL TO MAKE GOOD INVESTMENT
DISCLAIMER : This is just for educational purpose. This type of analysis is equivalent to catching a falling knife. If you are a warrior, you throw all the knives back else you will be sorrow if it hits SL. Make sure to do your analysis well. This type of analysis only suits high risks investor and whose is willing to throw all the knives above irrespective of any sectoral rotation. BE VERY CAUTIOUS AS IT IS EXTREME BOTTOM FISHING.
HOWEVER, THIS IS HOW MULTIBAGGERS ARE CAUGHT !
STOCK IS AT RIGHT PE / RIGHT EVALUATION / MORE ROAD TO GROW / CORRECTED IV / EXCELLENT BOOKS / USING MARKET CRASH AS AN OPPURTUNITY / EPS AT SKY.
LET'S PUMP IN SOME MONEY AND REVOLUTIONIZE THE NATION'S ECONOMY!

Bitcoin Analysis – Possible Scenarios🟠 Price is consolidating around 104,500, sitting right on the short-term ascending trendline. No clear breakout yet.
🔴 Supply Zones:
1️⃣ OB 1H:📍 107,800 – 108,600📌 Strong rejection zone that led to the current decline.
2️⃣ OB 4H:📍 106,100 – 107,500📌 Key resistance zone – a valid break above may trigger bullish continuation.
3️⃣ Upper OB 1H:📍 110,700 – 111,400📌 Higher resistance to watch in case of strong breakout.
🟢 Demand Zones:
1️⃣ FVG 1H:📍 103,900 – 104,300📌 Price is nearing this imbalance zone – bullish reaction expected if support holds.
2️⃣ Lower FVG 1H:📍 99,900 – 100,700📌 If current support fails, this is the next strong liquidity zone.
📊 Possible Scenarios:
1️⃣ Bounce from current trendline & FVG → move toward OB 4H (buy setup with confirmation)
2️⃣ Break below trendline → deeper pullback into 100K zone
3️⃣ Breakout above OB 4H → target next resistance at 108,600 and above
‼️ Wait for confirmation before jumping in – price action is at a decision point.
🔍 Insight by ProfitaminFX
If this outlook aligns with your bias, or if you see it differently, feel free to share your perspective in the comments. Let’s grow together 📈

Risk Can be Taken at Re-test of Breakout Level.Cup & Handle Formation.
Breakout from the main Resistance level
around 25.
Possible Targets can be around 30 - 31.
Breaking 23 will bring more Selling Pressure.

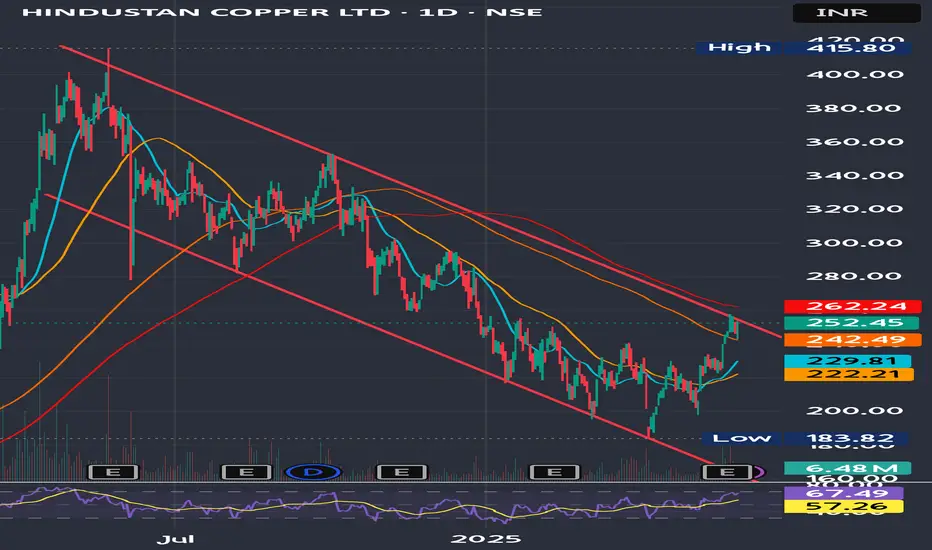
Hindcopper's Channel Breakout DueHindustan Copper Ltd. has recently garnered attention due to its strong financial performance and positive market sentiment.
Stock has broken out above key resistance around ₹240–₹245 with volume support.
Trend: Bullish
Indicators:
RSI ~67 (strong momentum)
MACD positive crossover
Above 50- & 200-DMA
Target Levels (Upside Potential)
Target Level Reason
270 Minor resistance zone (prior supply area)
292–295 Near-term swing high (Feb 2024 levels)
320+ Medium-term breakout target if momentum sustains
Stoploss Levels
Stoploss Type Level
Reason
Tight Stoploss 240 Previous breakout zone
Moderate SL 225 Near 50-day moving average
Positional SL 216 Breakdown confirmation below trend support
Buy on dips strategy around 245 -250 levels
MAXHEALTHCARE - Could Breakout from DTHMAXHEALTHCARE has resistance weakening on the Daily charts and may give a breakout with good volume in coming days.
The target of this pattern signals an upside potential of 15% from the current price level in the medium term.
The stock is trading above its 50- and 100-day exponential moving averages (EMAS) recently. Look for the range to more than 1.5X, and the Volume 1.5X the average.
CMP- Rs. 1149
Entry Price- 1200
Target Price- Rs1380 (15% upside)
SL- 1142
Need to wait for the entry to get triggered.
Disclaimer: This is not a buy/sell
recommendation. For educational purpose only. Kindly consult your financial advisor before entering a trade.

BTC at Crossroads: Rejection from ATH or Breakout.Key Zones Highlighted:
🟥 Recent ATH and Resistance Level (~$111,000 - $112,000)
The price recently tested this area, forming a new All-Time High (ATH).
This zone has acted as a major resistance, causing a pullback.
A break and close above this range would indicate bullish continuation.
🟩 Support Zone (~$105,000 - $106,000)
Price previously bounced from this zone.
Currently acting as a mid-level demand/support.
Likely to be tested again if bearish pressure continues.
🟩 Strong Supply Zone (~$102,000 - $103,500)
A more significant support area, where previous buying pressure emerged strongly.
If the upper support fails, this becomes the next possible bounce zone.
Price Action and Projection:
Price is currently at $108,209 and moving within a correction phase.
Two potential scenarios are highlighted on the chart:
Bullish Continuation:
Price rebounds from current level (black circle) and breaks above the resistance zone.
Targets new highs beyond $112,000.
Bearish Pullback:
Price fails to sustain above current level and dips into the support zone (~$105K).
If strong buying interest appears, a bounce back to the ATH zone is expected.
Technical Outlook:
Ichimoku Cloud: Price is testing the Kumo (cloud), indicating neutral to slight bearish momentum.
Volume: Slight uptick in volume during the recent drop suggests sell pressure is increasing.
Structure: Price is forming a higher high and potentially a higher low, maintaining a bullish structure as long as support holds.
Conclusion:
BTC is in a critical zone with mixed signals. A decisive move from the current level will likely set the tone for the next 24–48 hours. Watch:
A bounce at ~$108K for bullish continuation,
A dip toward $105K for potential re-entry opportunities.
Let me know if you’d like trade setup suggestions based on this.

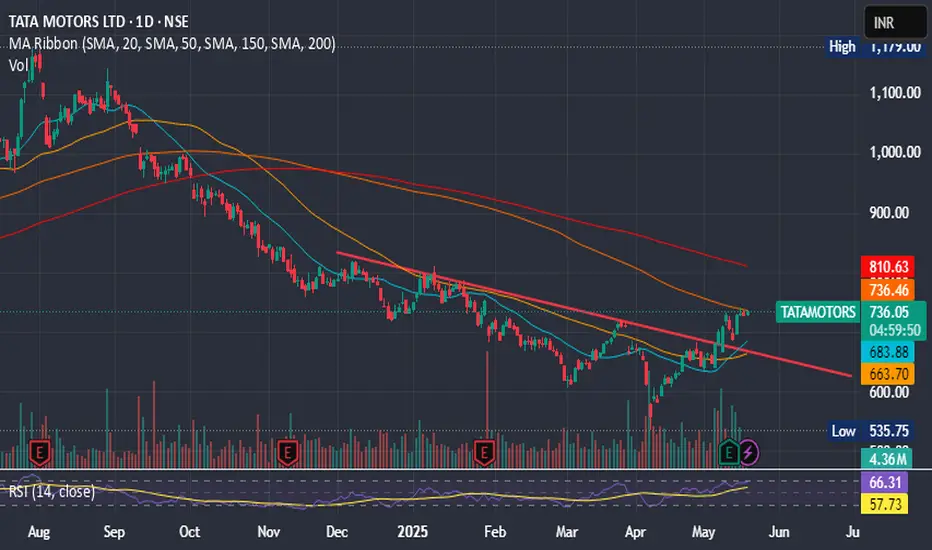
TATA MOTORS IGNITING MOMENTUM - Pivot Points: The classic pivot point is 731.45, with resistance levels at 733.4, 736.3, and 738.25, and support levels at 728.55, 726.6, and 723.7
Tata Motors' short-term trend appears bullish, with analysts predicting an upside target of ₹770–780 in the coming weeks. The stock has shown strong resilience near its support level of ₹715 and is trading above key short-term moving averages, signaling strength.
Key Levels:
- Support: 715–720
- Resistance: 735–740
- Target: 770–780 OR MORE TOWARDS 823
DHANI SERVICES MAY GIVE BREAKOUT SOONDhani Services is an Indian consumer business that operates through its app, Dhani. It provides a range of services, including digital healthcare, financial services, e-commerce, UPI payments, stock trading, and bill payments. The company was originally founded as Indiabulls Ventures Limited in 1995 but was later renamed Dhani Services Limited in October 2020.
SHORT TERM MAY TOUCH 69 TO 72 MARK.

Tata Power is showing strengthTata Power's technical indicators suggest a strong buy signal based on moving averages and oscillators. Here’s a quick breakdown:
- Relative Strength Index (RSI): 65.04 (indicating bullish momentum)
- MACD: 3.38 (positive crossover, signaling upward trend)
- Moving Averages: All major SMAs and EMAs indicate a buy
- Pivot Points: Key support at ₹388.64, resistance at ₹398.69
Close Above 400 mark will be positive
- Short-Term Forecast: Technical analysis suggests support around ₹390 and resistance near ₹626, with a potential price target of ₹417.23 in the next two weeks.

at the verge of Breakout!
at the verge of Breakout!
Sustaining 136 - 137 would lead it towards
141 - 144 & then 148-150.
Otherwise, 120-121 seems to be a Good
Support level.
and this time if 108 is broken,we will see
heavy Selling.

DLF BUILDING ABOVE CHANNEL RANGE DLF Limited is one of India's leading real estate development companies, founded in 1946 by Chaudhary Raghvendra Singh. It is headquartered in New Delhi and has developed residential, commercial, and retail properties across Delhi, Gurgaon, Haryana, and other regions.
Key Highlights:
- Industry: Real Estate
- Market Presence: Offices, apartments, shopping malls, hotels, and golf courses
- Major Projects: DLF Cyber City, DLF Mall of India, DLF Emporio, and various residential townships
- Revenue (2024): ₹6,958 crore (US$820 million)
- Net Income (2024): ₹2,724 crore (US$320 million)
Support & Resistance Levels
- Support: 670 INR
- Resistance: 695 INR (Potential breakout level)
- Next Target Levels: 740 INR and 800 INR (If breakout above 695 INR occurs)
Market Sentiment
- Overall Trend: Bullish
- Short-Term Outlook: Positive momentum with potential breakout
Short-Term Target Levels
- Immediate Resistance: 695 INR (Breakout level)
- Next Target: 740 INR (If breakout above 695 INR occurs)
- Higher Target: 800 INR (If momentum sustains)
- Support Levels: 670 INR (Key support zone)

HFCL LTD WORTH TRACKING FOR SHORT TERM HFCL Ltd. (Himachal Futuristic Communications Limited) is a telecom infrastructure enabler with a diverse portfolio spanning telecom equipment manufacturing, optical fiber cables, and turnkey services
Business Segments
- Telecom Products: Includes UBR radios, Wi-Fi access points, AI-driven network management, and home mesh routers.
- Optical Fiber Cables: Largest market share in OFC supplies.
- Defence: Offers electronic fuzes, thermal weapon sights, and surveillance radars.
- Passive Connectivity Solutions: Supplies cable assemblies and high-density cabinets.
- Aerospace & Automotive: Provides custom cable assemble
Forecasts suggest potential short-term targets between ₹91.66 and ₹93.60 for 2025. Meanwhile, long-term projections for 2026 indicate a possible price range of ₹146.02 to ₹149.07.

2nd Consecutive Cap after my call.
2nd Consecutive Cap after my call.
Now 162 - 163 is the Resistance.
Crossing it will lead it towards 170 & then 189-190

Inverted H&S Pattern in place.
Inverted H&S Pattern in place.
Breakout done.
May take a Risk with a SL of 81 on Closing basis.
Targets can be around 92 - 95 then 100-102

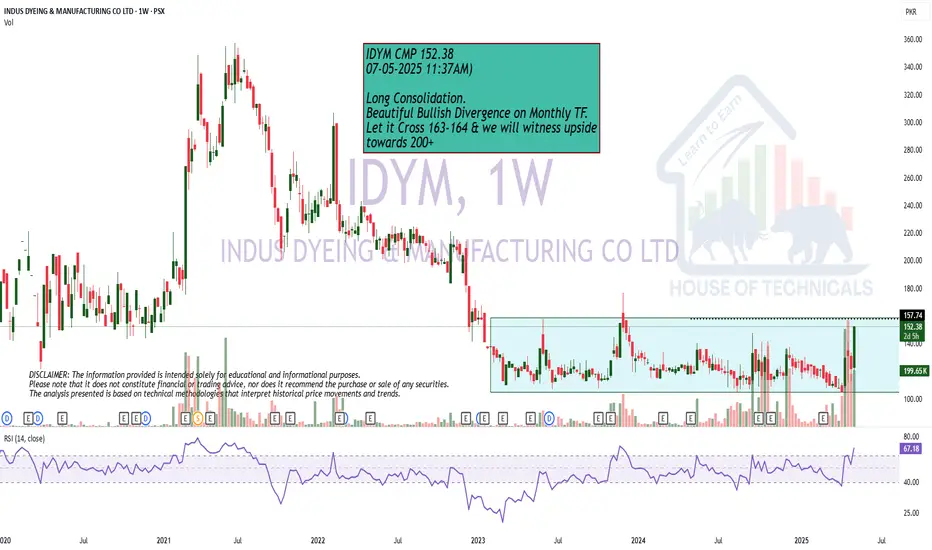
Near BreakoutLong Consolidation.
Beautiful Bullish Divergence on Monthly TF.
Let it Cross 163-164 & we will witness upside
towards 200+

NVDA - BullishForecast a break-out up as the price increased by 3.3% in the after hours.
- The price area in a falling wedge, almost a descending channel.
- The MACD indicator in the Weekly frame shows an uptrend after a rare day of oversold (04.04.2025).
The price today (04.30.2025): $108.92.
Price target: $135.00.
Stop loss: $95.00.
IMO, amateur trader.

H&S pattern Breakout.
H&S pattern Breakout.
67 - 68 can be an important Support.
71.50 - 72 is the initial Monthly Resistance.
Crossing & Sustaining this level may
take the price towards 82 - 85.
However, breaking 61 may result in
further selling pressure.

Breakout re-tested.Breakout re-tested.
Morning Star formation.
The only concerning thing is Bearish
Divergence appearing on Weekly TF.
Crossing & Sustaining 140 may lead it
towards 160.
However, breaking 120 may bring further
selling pressure.

NIVABUPANIVABUPA showing resistance breakout with decent volume and can go up to the recent arc curve depth ie approx 18%. It is very strong on weekly chart as well. Closing below 85 may change the view. keep it in your watchlist

Morning Star Formation on Bigger Tf.Morning Star Formation on Bigger Tf.
14.35 - 14.75 is a Very Important Support level.
However, 15.80 - 15.90 is a Very Strong Resistance
as of now.
If this level is Crossed & Sustained with Good Volumes,
we may witness 17.50 - 18 & then around 19.

USDCHFRSI indicates Bullish Divergence. Which means that at any time the market trend can change to HH and HL.
