#LAYERUSDT setup remains active 📉 LONG MEXC:LAYERUSDT.P from $1.5722
🛡 Stop loss: $1.5440
🕒 Timeframe: 1H
✅ Market Overview:
➡️ The coin is showing "its own game" — price action is independent of #BTC and #ETH, reacting to internal volume dynamics.
➡️ Ascending triangle breakout with a confirmed close above the key $1.5440 zone.
➡️ Empty space ahead — no major resistance levels until $1.6060–$1.6210.
➡️ Accumulation is forming between $1.5440–$1.5700 — a breakout may follow.
➡️ Important: candles must close above $1.5440 to confirm the long scenario.
🎯 TP Targets:
💎 TP1: $1.5880
💎 TP2: $1.6060
💎 TP3: $1.6210 (full measured move from triangle pattern)
📢 Recommendations:
If volume MEXC:LAYERUSDT.P increases during a breakout above $1.5722 — expect a rapid move.
If price pulls back — the $1.5254 area could offer a second entry opportunity.
The coin looks strong but slightly overbought — partial take profit at TP1 is advised.
📢 A strong breakout above $1.5700 may lead to a sharp move due to lack of resistance.
📢 Avoid 1H candle close below $1.5440 — scenario invalidation.
📢 If the move occurs on weak volume — watch for a potential reversal near TP1.
🚀 MEXC:LAYERUSDT.P setup remains active — holding the key level could lead to a move toward TP2–TP3!
Breakoutsignal
#AI16ZUSDT remains in a bearish momentum
📉 SHORT BYBIT:AI16ZUSDT.P from $0.1544
⚡️ Stop loss $0.1582
🕒 Timeframe: 1H
✅ Overview BYBIT:AI16ZUSDT.P
➡️ Price continues in a downtrend, breaking key support levels.
➡️ POC: $0.1615 marks a high-volume area where price was rejected, indicating strong selling pressure.
➡️ Resistance at $0.1582 — expect rejection on retest.
➡️ Entry zone: $0.1544, but wait for confirmation before entering!
➡️ Targeting TP1: $0.1510 and TP2: $0.1485 on further downside movement.
📍 Important Note: Watch for confirmation levels before entering! Do not enter too early.
🎯 Take Profit Targets:
💎 TP 1: $0.1510
💎 TP 2: $0.1485
⚡️ Plan:
➡️ Wait for confirmation before entering at $0.1544.
➡️ Stop loss $0.1582 — above resistance.
➡️ Take profits at $0.1510 and $0.1485.
🚀 BYBIT:AI16ZUSDT.P remains in a bearish momentum — follow the plan after confirmation!
"Bitcoin Breakout Setup: Potential Rally Towards $94K!"Key Observations:
Support Zone: A crucial support level is marked below the broken channel, indicating a potential area for a price reversal.
Bullish Projection: A breakout above this support level could push BTC higher towards the target price of 94,101.24 USD.
Technical Patterns: The price initially showed a strong downtrend, followed by a recovery forming an ascending channel, and now a potential bullish breakout is expected.
Trading Plan:
Bullish Scenario: If BTC holds above the support level, a strong move upwards toward 94,101.24 USD could be expected.
Bearish Scenario: A failure to hold support could result in further downside toward lower key levels.
Conclusion:
Traders might look for buying opportunities near the support zone with a potential upside target of 94,101.24 USD while managing risk in case of further breakdown.
Would you like to refine this further or add specific indicators? 🚀
#ARCUSDT is showing signs of reversal📉 Short BYBIT:ARCUSDT.P from $0.06780
🛡 Stop loss $0.07117
🕒 1H Timeframe
⚡️ Overview:
➡️ The main POC (Point of Control) is at 0.05873, indicating the area with the highest trading volume.
➡️ The 0.07117 level acts as strong resistance where the price previously reversed.
➡️ The chart shows a potential topping structure followed by a decline.
➡️ Volume concentration between $0.065 and $0.06210 suggests key zones for potential profit-taking.
🎯 TP Targets:
💎 TP 1: $0.06510
💎 TP 2: $0.06210
💎 TP 3: $0.06050
📢 Watch the key levels and enter after confirmation!
📢 The price has already started to move down — downside momentum remains strong.
📢 The TP levels are near a previous consolidation zone, allowing quick target execution.
BYBIT:ARCUSDT.P is showing signs of reversal — considering shorts with clear downside targets!
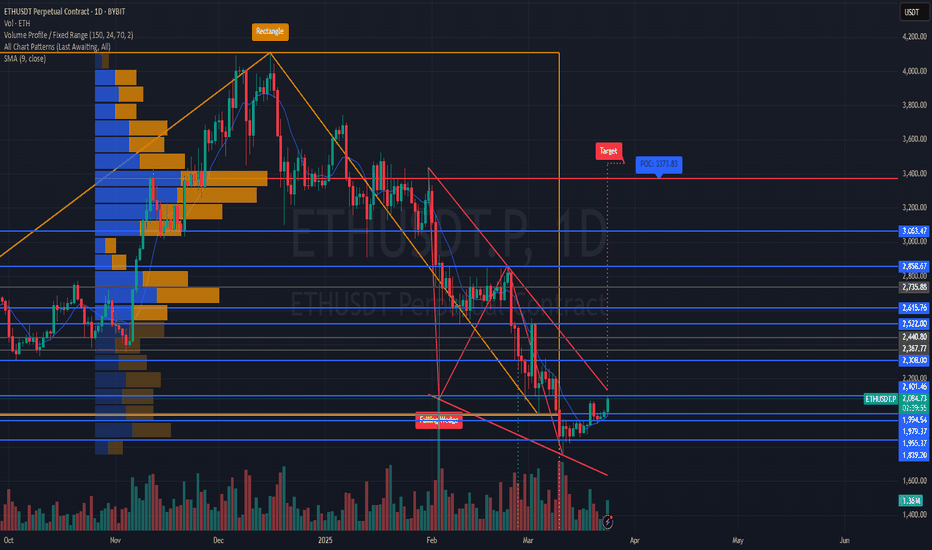
#ETHUSDT is forming a potential mid-term reversal📉 LONG BYBIT:ETHUSDT.P from $2102.90
🛡 Stop loss at $2083.00
🕒 Timeframe: 1D (Mid-term idea)
✅ Overview:
➡️ BYBIT:ETHUSDT.P Falling Wedge breakout confirmed on the daily chart.
➡️ Successful retest of the $1,955–$2,041 zone.
➡️ Holding above $2,101 opens the way to higher levels.
➡️ Volume is increasing post-breakout — confirming buyer interest.
➡️ Next strong resistance block lies between $2,308–$2,522.
🎯 TP Targets:
💎 TP 1: $2112.00 — nearest resistance and key liquidity zone.
💎 TP 2: $2125.00 — a critical daily level, zone of pullback from previous drop.
💎 TP 3: $2134.00 — potential impulse target toward major POC ($3,373).
📢 If price fails to hold above $2,068 and breaks below $2,041 — the setup is invalidated.
📢 A retest of $2,101 from below may be needed before a stronger upward move.
📢 Volume support at $1,955 is critical for the bullish case.
🚀 BYBIT:ETHUSDT.P is forming a potential mid-term reversal — if price holds above $2,101, a move toward $2,200+ and beyond is expected.
GBP/USD Technical Analysis – Potential Bearish MoveThis 4-hour GBP/USD chart indicates a potential bearish setup. Price has been trading within a range, with resistance around 1.30366 and support near 1.29467.
The price recently retested the support zone, showing signs of weakness.
If the support level fails to hold, a breakdown could push the price towards the 1.27035 target.
A stronger support level is observed further below, around 1.2600, which could act as a key demand zone.
Traders should monitor the price action near the support zone. A clear rejection could signal a potential buy opportunity, while a confirmed breakdown could validate a short trade targeting lower levels.
Key Levels:
🔹 Resistance: 1.30366
🔹 Support: 1.29467
🔹 Target: 1.27035
Would you like any modifications to the analysis? 🚀
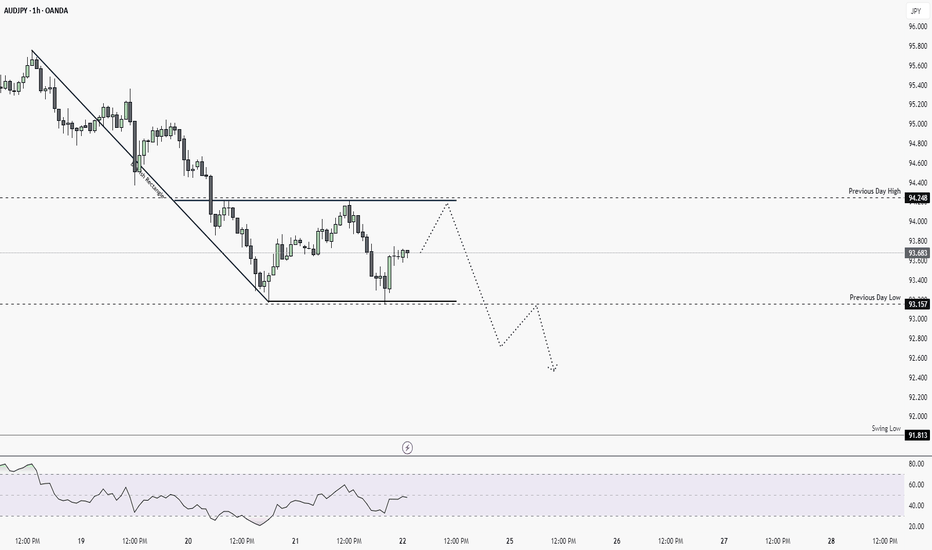
Will AUDJPY continue bearish trend? [Short Setup]Bearish rectangle is form on 1HR chart and there is no divergences. It's likely to continue bearish trend.
🔹When to Enter?
Enter in the trade when it retest it pervious day low which is 193.157. And target it to swing low, keep SL above pervious day low.
🔹 How to Take Trade?
- Only risk 1% of your portfolio
Like and subscribe to never miss a new idea! ✌🏼
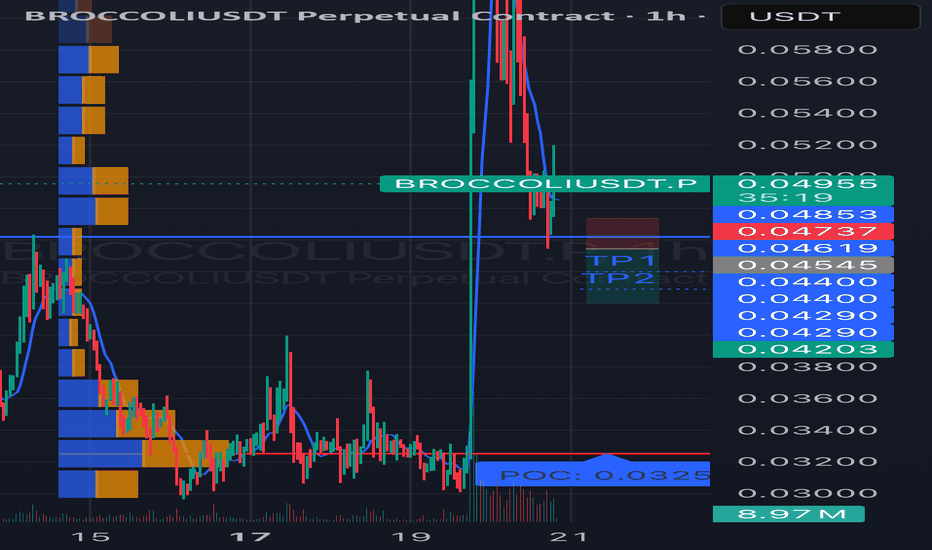
#BROCCOLIUSDT is showing bearish potential SHORT BYBIT:BROCCOLIUSDT.P from $0.04545
🛡 Stop Loss: $0.04737
🕒 Timeframe: 1H
⚡️ Overview:
➡️ BYBIT:BROCCOLIUSDT.P is showing bearish momentum on the 1-hour timeframe after a significant drop from $0.06000 to the current consolidation zone of $0.4203–$0.4885.
➡️ The price recently tested the $0.04545 level (a possible retest of a broken support, now acting as resistance), which could serve as an entry point for a short.
➡️ The volume profile on the left shows strong buyer interest at $0.0325 (POC), which acts as a key support level. However, the lack of significant buying volume at current levels suggests potential for further downside.
➡️ The price structure remains bearish: lower highs and lows are forming after the drop.
➡️ The RSI (14) indicator on the 1H timeframe is presumably around 45 (based on price action), indicating neutral momentum with room for a downward move.
🎯 Take Profit Targets:
💎 TP 1: $0.04400
💎 TP 2: $0.04290
💎 TP 3: $0.04203
⚡️Plan:
➡️ Entry: Sell below $0.04545 after the 1-hour candle closes below this level to confirm the rejection from resistance.
➡️ Stop Loss: Set at $0.04737, which provides a 7% risk from the entry point and protects against a potential breakout.
➡️ Risk/Reward Ratio: From 1:2 (for TP1) to 1:5 (for TP3), making this trade attractive from a risk management perspective.
➡️ After the drop, the price has stabilized, indicating possible consolidation or accumulation.
➡️ Resistance zone: $0.04885 (upper boundary of the current range).
Technical Indicators:
➡️ The chart shows candles in red and green, reflecting bearish and bullish movements.
➡️ After the sharp decline, the price has formed lower highs and lows, but in recent hours, there’s an attempt at recovery.
📢 A price rejection below $0.04545 with increasing selling volume increases the likelihood of reaching the targets.
📢 The $0.04400 and $0.04290 levels may act as areas for partial profit-taking, so monitor price action in these zones.
📢 Risks: If the price breaks above $0.04885, it could signal a false breakdown and a potential reversal to the upside. In this case, consider reassessing the position.
📊 The decline in BYBIT:BROCCOLIUSDT.P aligns with cautious sentiment in the crypto market.
📊 As of March 20, 2025, BYBIT:BTCUSDT.P is trading around $90,000, showing signs of consolidation, which may pressure altcoins like BYBIT:BROCCOLIUSDT.P
BYBIT:BROCCOLIUSDT.P is showing bearish potential on the 1H timeframe.
⚡️A confirmed rejection below $0.04545 is your signal to act!
#RAREUSDT continues its downtrend📉 Short BYBIT:RAREUSDT.P from $0,08345
🛡 Stop loss $0,08460
🕒 1H Timeframe
⚡️ Overview:
➡️ The main POC (Point of Control) is 0,09094
🎯 TP Targets:
💎 TP 1: $0,08196
💎 TP 2: $0,08050
💎 TP 3: $0,07950
📢 Monitor key levels before entering the trade!
BYBIT:RAREUSDT.P continues its downtrend — watching for further movement!
Bearish Divergence on Weekly TF but... there is a Breakout..Bearish Divergence on Weekly TF.
However, Breakout on Daily TF from 452 - 453.
Weekly Closing above this level would
be a positive sign.
Upside Targets can be around 495 - 500
& if this level is Sustained, with Good
Volumes , we may witness 540 - 550.
Should not break 400, otherwise, we may see
heavy Selling pressure.
Gold (XAU/USD) Trade Update**Gold (XAU/USD).
### **Key Observations:**
✔ **Uptrend Strength:** Gold had a strong bullish move earlier, with a notable spike in volume.
✔ **Support & Resistance:**
- **Immediate support:** Around **$2,932 - $2,928** (black moving average line).
- **Resistance:** Around **$2,936 - $2,940**, where price struggled to break higher.
✔ **Moving Averages:**
- The **short-term (red & blue)** moving averages are trending upwards, signaling ongoing bullish momentum.
- The **long-term (black) moving average** remains below, supporting the uptrend.
### **Potential Scenarios:**
📈 **Bullish Case:** If Gold breaks above **$2,936 - $2,940**, it could re-test **$2,950** and move toward higher highs.
📉 **Bearish Case:** A break below **$2,928** could trigger a retest of lower supports near **$2,920 - $2,912**.
#BANANAUSDT maintains bearish momentum📉 Short BYBIT:BANANAUSDT.P from $14.905
🛡 Stop loss $15.490
🕒 1H Timeframe
⚡️ Overview:
➡️ The main POC (Point of Control) is at 16.112, indicating the area with the highest trading volume.
➡️ The 15.490 level acts as a local resistance, as the price previously faced selling pressure there.
➡️ The volume and market profile highlight areas of high trader activity, especially in the 14.250 – 15.500 range.
➡️ The chart shows a potential decline after an impulse move and profit-taking.
🎯 TP Targets:
💎 TP 1: $14.580
💎 TP 2: $14.250
💎 TP 3: $13.920
📢 Monitor key levels before entering the trade!
📢 If 15.490 is broken upward, the trade may be invalidated.
📢 If the price continues to decline and breaks through TP 1, the downside potential remains.
BYBIT:BANANAUSDT.P maintains bearish momentum — expecting further downside movement!
#RUNEUSDT is showing signs of growth📈 Long BYBIT:RUNEUSDT.P from $1.161
🛡 Stop loss $1.140
🕒 1H Timeframe
⚡️ Overview:
➡️ The main POC (Point of Control) is at 1.08, indicating the area with the highest trading volume.
➡️ The 1.154 level acts as a local support, as the price previously bounced from this zone.
➡️ The volume and market profile highlight areas of high trader activity, especially in the 1.100 – 1.161 range.
🎯 TP Targets:
💎 TP 1: $1.174
💎 TP 2: $1.185
💎 TP 3: $1.195
📢 Monitor key levels before entering the trade!
📢 If 1.140 is broken downward, the trade may be invalidated.
📢 If the price holds above 1.161 and continues rising, the bullish momentum remains intact.
BYBIT:RUNEUSDT.P is showing signs of growth — expecting further upside movement!
#XLMUSDT is showing signs of growth📈 Long BYBIT:XLMUSDT.P from $0.26325
🛡 Stop loss $0.25955
🕒 1H Timeframe
⚡️ Overview:
➡️ The main POC (Point of Control) is at 0.25511, indicating the area with the highest trading volume.
➡️ The 0.25955 level acts as a local support, as the price previously bounced from this zone.
➡️ The volume and market profile highlight areas of high trader activity, especially in the 0.24984 – 0.26325 range.
➡️ The chart shows a forming bullish structure, confirming the potential for further upward movement.
🎯 TP Targets:
💎 TP 1: $0.26630
💎 TP 2: $0.26930
💎 TP 3: $0.27240
📢 Monitor key levels before entering the trade!
📢 If 0.25955 is broken downward, the trade may be invalidated.
📢 If the price holds above 0.26325 and continues rising, the bullish momentum remains intact.
BYBIT:XLMUSDT.P is showing signs of growth—expecting further upside movement!
GOLD TRADE UPDATE – Crucial Breakout Levels to Watch### **🚀 GOLD TRADE UPDATE – Crucial Breakout Levels to Watch ! 📊**
Gold is currently trading at **2915**, consolidating between **key support at 2912** and **resistance at 2920**. This means the market is at a critical decision point, and a breakout in either direction will determine the next major move.
---
## **📈 Bullish Scenario – Buy Setup**
If gold **breaks and closes above 2920**, it will confirm a **strong bullish momentum** and indicate that buyers have taken control. In this case:
🔹 **Entry:** Buy after a confirmed breakout above 2920
🔹 **Target 1 (TP1):** 2927
🔹 **Target 2 (TP2):** 2932
🔹 **Final Target (TP3):** 2937
### **Why?**
- A breakout above 2920 suggests strength in buyers and a continuation of the uptrend.
- The price could push toward higher resistance levels due to increased buying pressure.
---
## **📉 Bearish Scenario – Sell Setup**
If gold **breaks below 2912**, it confirms **bearish momentum**, signaling that sellers have taken over. In this case:
🔹 **Entry:** Sell after a confirmed breakdown below 2912
🔹 **Target 1 (TP1):** 2905
🔹 **Target 2 (TP2):** 2900
🔹 **Final Target (TP3):** 2895
### **Why?**
- A break below 2912 indicates weakness, pushing the price lower.
- The selling pressure could increase, leading to a drop toward the lower support levels.
---
## **📌 Trading Plan & Risk Management:**
✅ **Wait for a confirmed breakout (above 2920 for buy OR below 2912 for sell).**
✅ **Use stop-loss to avoid false breakouts (recommended SL: 10-15 pips from entry).**
✅ **Secure partial profits along the way to protect gains.**
✅ **Trade with proper risk management—never risk more than you can afford to lose.**
---
### **🔥 Final Thoughts:**
Gold is at a **critical level**, and the next move depends on whether the price **breaks support or resistance**. Be patient, wait for confirmation, and trade smartly to maximize profits while minimizing risk.
🚀 **Stay focused, manage risk, and catch the next big move!** 📈📉
BTCUSD UPCOMING TREND UPWARD READ IN CAPTION Bitcoin (BTC/USD)* currently at *83,918*, with key levels marked for potential trades. The *resistance* is at *92,026*, while the *support zone* is near *76,129*. The price is expected to test the *resistance* before potentially moving down to the support. Watch for a possible *bullish move* towards *92,026* or a *downward correction* to *76,129
#IPUSDT – Long Setup, Testing Resistance ZoneLONG BYBIT:IPUSDT.P from $7.0000
🛡 Stop Loss: $6.6900
⏱ 1H Timeframe
✅ Market Analysis:
📍 The BYBIT:IPUSDT.P price is showing strong upward momentum, breaking key resistance levels.
📍 The asset has held above the $6.8982 level, which may confirm a continuation of the uptrend.
📍 POC (Point of Control) at $4.8742 – the highest volume area, previously serving as a consolidation point.
🎯 TP Targets:
💎 TP 1: $7.3100
🔥 TP 2: $7.6200
⚡ TP 3: $7.8600
📢 Holding above $6.8982 could confirm trend strength.
📢 A dip toward $6.6900 (stop loss) could be a fakeout – monitoring price action is crucial.
📢 The $7.3100 level is the first TP, where a retracement may occur before further upside.
📢 If the price breaks $7.6200, the move toward $7.8600 becomes more likely.
🚀 BYBIT:IPUSDT.P is showing strength – monitoring the $7.0000 breakout and securing profits as the price moves up.
#DOGEUSDT remains weak📉 SHORT BYBIT:DOGEUSDT.P from $0.23740
🛡 Stop Loss: $0.24040
⏱ 1H Timeframe
✅ Overview:
➡️ BYBIT:DOGEUSDT.P broke support and exited the rising wedge, signaling a bearish trend shift.
➡️ POC (Point of Control) at $0.25386 now acts as key resistance.
➡️ The price dropped sharply with increased volume, confirming strong selling pressure.
➡️ Liquidity has shifted lower, increasing the probability of continued downside movement.
⚡ Plan:
➡️ Enter short at $0.23740 after confirming downward momentum.
➡️ Stop-Loss set at $0.24040, above the nearest resistance level.
🎯 TP Targets:
💎 TP1: $0.23410
🔥 TP2: $0.23155
🚀 BYBIT:DOGEUSDT.P remains weak — expecting further decline toward key targets!
#ADAUSDT is forming a strong bullish trend📈 LONG BYBIT:ADAUSDT.P from $0.8110
🛡 Stop Loss: $0.8046
⏱ 1h Timeframe
🔹 Overview:
➡️ Price is showing a strong uptrend after a correction, forming a support zone and bouncing off the local trendline.
➡️ POC (Point of Control) at $0.7826 highlights the key volume area where the reversal occurred.
➡️ Key resistance levels are marked, indicating potential price targets.
➡️ Volume spikes confirm increased buyer interest, signaling momentum.
➡️ An impulse breakout is possible if buying pressure sustains at TP levels.
⚡ Plan:
➡️ Main scenario – long position with profit-taking at TP levels.
➡️ Expecting a breakout above $0.8110 and resistance level tests.
🎯 TP Targets:
💎 TP 1: $0.8160
🔥 TP 2: $0.8210
🚀 TP 3: $0.8262
📢 BYBIT:ADAUSDT.P is forming a strong bullish trend — preparing for resistance breakouts!


