BTC | Bitcoin CURRENT CANDLE | NEW ATH or 70kThe previous weekly candle seemed unable to make a higher high after retesting the support at 76K.
However, today's bullish impulse has suddenly shocked right through two resistance zones, with the price now trading just above 90k.
If we can successfully CLOSE the weekly candle above 91K, it's likely that BTC is in for a new ATH which would mean ETH will also reach a new ATH, and then altseason will commence 🥳
Watch the following and make sure you are prepared for ALTSEAON:
___________________
BINANCE:BTCUSDT
Breakouttrading

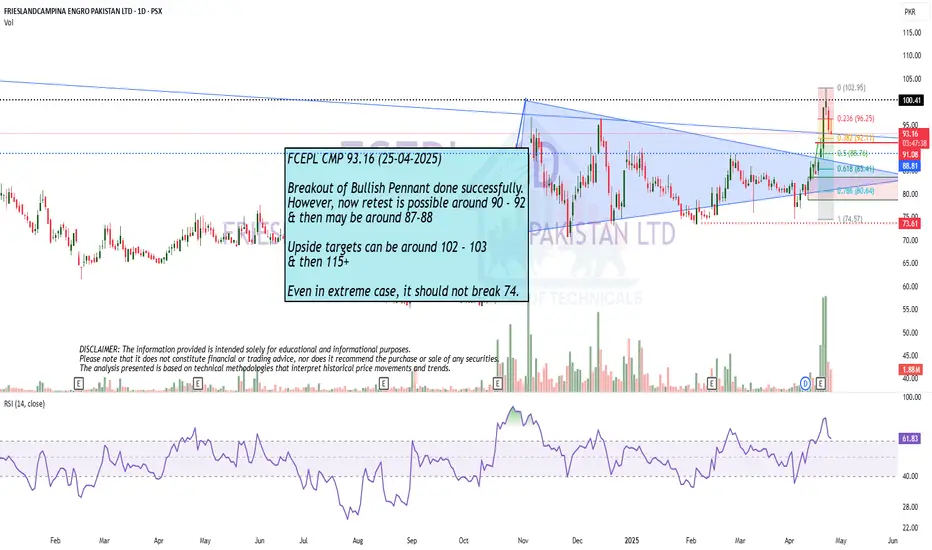
Breakout of Bullish Pennant done successfully.
Breakout of Bullish Pennant done successfully.
However, now retest is possible around 90 - 92
& then may be around 87-88
Upside targets can be around 102 - 103
& then 115+
Even in extreme case, it should not break 74.
LONG GRND // Swing TradingBreaking out a range between $15s n $19s.
Favorable RSI and increasing volumen. Nice base formation.
According to Finviz, insiders own 77% of floating shares. 12% short float.
Maybe a pullback before a rally but price action is OK.
Earning release are close (19 May - unconfirmed) so just little position.
Target: $24 at least.

DIVISLAB | Strong Volume Breakout from Multi-Month Resistance 📈 Trade Recommendation:
✅ For Intraday:
Buy Above: ₹6,250 (on sustained breakout and volume)
Intraday Target: ₹6,350–₹6,420
Stoploss: ₹6,180 (below breakout zone)
📊 For Short-Term (1–2 weeks):
Buy on Retest: ₹6,200–₹6,250 (ideal risk-reward)
Target 1: ₹6,500
Target 2: ₹6,750
Stoploss: ₹6,050 (below retest support)
🔍 Technical Highlights:
Volume surge confirms breakout strength
RSI breakout above 70 indicates strong bullish momentum
Past resistance zone now acting as support on retest

ASTRAL LTD | At Key Trendline Resistance | Breakout or Rejection🟢 Buy Recommendation (Breakout Trade)
Entry: Buy only on breakout and daily close above ₹1,420–₹1,430 (above trendline resistance).
Target 1: ₹1,550
Target 2: ₹1,650
Stop Loss: ₹1,320 (below recent consolidation support)
📌 Rationale: If price breaks above the trendline on good volume and closes above ₹1,430, a trend reversal may begin.
🔴 Sell/Short Recommendation (Rejection Trade)
Entry: Sell if the price gets rejected from ₹1,400–₹1,420 and shows a red candle (confirmation).
Target 1: ₹1,280
Target 2: ₹1,180
Stop Loss: ₹1,445 (above the trendline)
📌 Rationale: If the price fails to break the trendline, it could resume the downtrend. RSI is overbought, and sellers might take over.
for educational purposes only

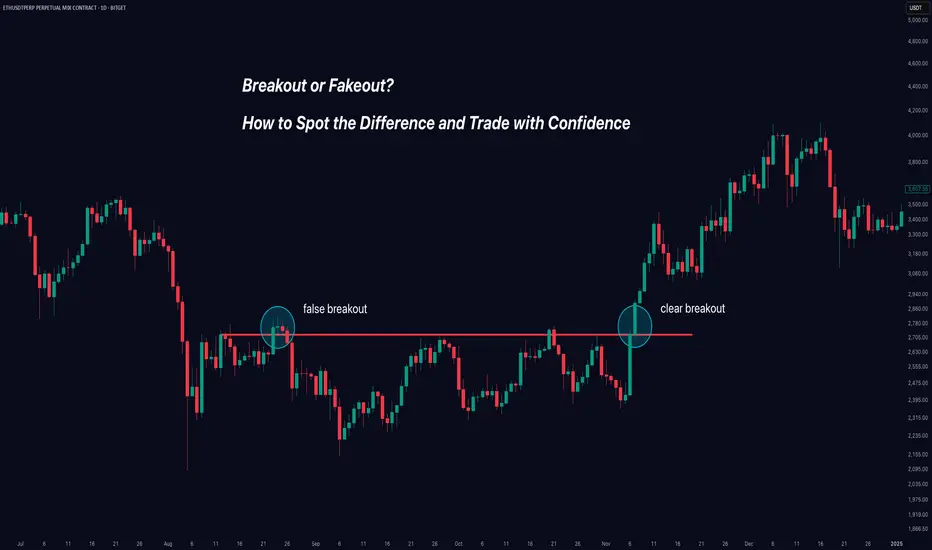
Breakout or Fakeout? How to Spot the Difference and Trade.Trading breakouts can be exciting - and profitable - when they're real. But how do you avoid getting caught in those frustrating false breakouts (fakeouts) that trap many traders?
In this clear and practical guide, you'll learn exactly how to identify genuine breakouts, avoid traps, and improve your trading decisions instantly.
Here's what we'll cover:
✅ Real Breakouts vs Fakeouts: Why it matters.
✅ Market Psychology: Why false breakouts happen.
✅ Volume: Your best friend for spotting authenticity.
✅ Price Structure & Context: When breakouts mean business.
✅ Momentum Confirmation: The hidden indicator that changes everything.
Let’s dive in!
🚩 Real Breakout vs Fakeout: Know the Difference
A breakout occurs when price decisively moves beyond a clear support or resistance level. Imagine Bitcoin breaking above $50,000 or Gold dropping below $1,900.
A fakeout happens when price briefly breaks these key levels—but quickly reverses, leaving traders stuck on the wrong side of the market.
Why it matters: Fakeouts aren't just frustrating—they’re costly. They drain your capital and confidence. Recognizing them early keeps you profitable and disciplined.
🧠 Why Do Fakeouts Happen? (The Psychology)
Fakeouts thrive because traders chase excitement and fear missing out (FOMO). Here’s the secret many traders overlook:
Bull and Bear Traps: Institutional traders deliberately push prices slightly past key levels to trigger stop orders—only to reverse the price sharply.
FOMO-driven trades: Retail traders jump in excitedly at any small breakout, providing fuel for these short-lived moves.
Understanding these tactics can help you stay calm and avoid impulsive entries.
🔥 Volume: The Ultimate Breakout Indicator
Want to know if a breakout is real? Look at volume—it reveals the market’s true intention.
High Volume: Means broad market participation and conviction, supporting a genuine breakout.
Low Volume: A red flag! This signals low market conviction and a higher likelihood of reversal.
Example: If Ethereum breaks above $4,000 with unusually high volume, that's a strong signal. But if volume remains low, beware—it's likely a fakeout.
📐 Context and Price Structure Make a Difference
Not all breakouts are created equal. Pay attention to these key context clues:
Trend Alignment: Breakouts in the direction of a clear existing trend are more reliable.
Significance of Level: Breakouts of major support/resistance levels (weekly or monthly highs/lows) have higher odds of success.
Follow-through and Retests: Genuine breakouts often retest broken levels, turning old resistance into new support.
⚡ Momentum Confirmation: Your Secret Weapon
Momentum indicators (like RSI or MACD) tell you what's happening beneath the surface. They help confirm or reject breakout validity:
Strong Momentum: If indicators confirm the breakout direction, the breakout is more reliable.
Divergence (Warning Sign): If price makes a new high but momentum indicators show lower highs, beware—a fakeout could be near.
Use momentum as your final confirmation step. It’s the missing piece that many traders ignore.
🎯 Quick Breakout Checklist
Use this simple checklist next time you're assessing a breakout:
🚦 Trade Breakouts Wisely: Final Tips
Be Patient: Waiting for breakout confirmation saves you from costly mistakes.
Set Clear Stops: If a breakout fails, exit quickly. Small losses protect your capital.
Scale into Trades: Enter gradually to manage your risk effectively.
Mind Market Context: Always align breakouts with the broader market direction.
Trading breakouts doesn't have to be stressful. When you know what signs to watch for, you trade with confidence—not guesswork.
🚀 Conclusion: Trade Better, Not Harder
Avoiding fakeouts is all about patience, confirmation, and understanding market psychology. By using volume, context, and momentum effectively, you'll greatly improve your breakout trading.
Now, put these strategies into practice. Stop guessing—start confidently trading real breakouts today!
Happy Trading!
Like this post? Follow us for more clear, actionable trading education.
#TradingTips #Breakouts #TechnicalAnalysis #TradingEducation #Crypto #Forex #StockTrading
KIMSKIMS has given inverted H&S breakout with decent volume. The depth is around 28-30% from neckline to bottom of the head. So if we add it to breakout line then we may see the same move on upper side. If we look at weekly timeline then also it has given resistance breakout. Seems very promising.

Waaree Energies Ltd (WRTL)🛒 Buy Recommendation
Buy Zone: ₹2,180–₹2,230
The stock is trading close to a support zone near the 23.6% Fib level (₹2,305) and trying to break out of the falling trendline.
RSI has bounced from the oversold region and is near 50, indicating a possible reversal.
🎯 Targets (Short to Medium-Term)
Target 1 – ₹2,585 (38.2% Fibonacci level)
Target 2 – ₹2,810 (50% Fibonacci level)
Target 3 – ₹3,036 (61.8% Fibonacci level – major resistance)
Swing Target – ₹3,766 (100% Fibonacci level – recent high)
🛑 Stop Loss
SL: ₹2,050 (Below recent swing low & below trendline support)
Risk is around ₹180 from entry; ideal for a reward of 1.5x–3x on targets.
🔎 Additional Technical Signals
Volume: Increasing volume on green candles shows buying interest.
RSI: Forming a bullish divergence and heading upward.
Breakout Point: A daily close above ₹2,305 would confirm a breakout of the trendline and strengthen the bullish case.
for educational purposes only

Breakout from a Parallel Channel.
Breakout from a Parallel Channel.
Monthly Closing above 20.20 - 20.30
would be a positive sign.
Re-tested the Breakout leve around 21.20
Stoploss as of now should be 20.20 with
Buy on Dips Strategy.

BANKNIFTY -CnH - BO -Daily Here's a technical analysis of the **Bank Nifty (Nifty Bank Index)** chart you've shared:
---
### 🧠 **Pattern Analysis: Cup & Handle + Double Bottom**
- The chart clearly shows a **Cup and Handle** pattern forming from **December 2024 to mid-April 2025**, followed by a **bullish breakout** above the neckline at **₹51,990.40**.
- Within the base of the cup, there is also a visible **Double Bottom** (highlighted on chart), adding further **bullish confluence**.
---
### 💥 **Breakout Confirmation**
- **Neckline**: ₹51,990.40
- **Current price**: ₹54,290.20 (Already broken out with strong follow-through)
- Breakout candle shows a **2.21% gain** with **high volume**, confirming a **valid breakout**
---
### 🎯 **Target Projection**
- **Cup depth**: ~₹4,111.85
- **Target = Neckline + Depth = ₹51,990 + ₹4,111 = ₹56,100** (aligned with resistance at **₹56,050.70** on chart)
- Also, an alternative smaller cup handle gives a target of ~**₹54,467**, which seems to be almost achieved
---
### 📊 **Volume Analysis**
- Strong volume spike at the breakout = confirmation of institutional buying
- Volume also increased on the right side of the cup and during the handle, which is ideal in such patterns
---
### 🧱 **Support and Resistance Levels**
- **Immediate Support**: ₹51,990 (neckline)
- **Major Support Below**: ₹47,870 and ₹47,702 (double bottom zone)
- **Next Resistance Zone**: ₹56,050.70 (cup projection target)
---
### 📌 **Summary**
- ✅ **Bullish breakout from Cup & Handle**
- ✅ Double Bottom within the structure adds confidence
- ✅ Volume confirmation present
- 📈 **Upside Target**: ₹56,000+ zone
- 🔁 Potential for retest of ₹52,000 before continuation

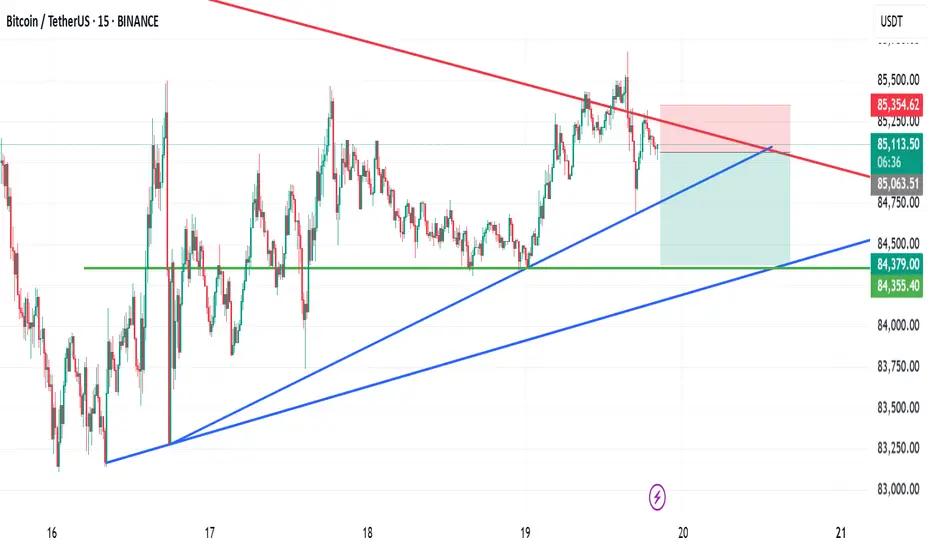
15M sell trade for BTC 15M sell trade for BTC
a small time frame, short for BTC with RR of 1:2.3 if it plays out.
Morning Star Formation on Bigger Tf.Morning Star Formation on Bigger Tf.
14.35 - 14.75 is a Very Important Support level.
However, 15.80 - 15.90 is a Very Strong Resistance
as of now.
If this level is Crossed & Sustained with Good Volumes,
we may witness 17.50 - 18 & then around 19.

Nat West breakoutClear breakout from 327, which was established resistance since 2016. Inverse Head and Shoulders pattern completed.
Volumes have been ramping up since Feb this year and the shares are not oversold on the weekly RSI yet.
Market likes their results today too.
In my opinion, heading for 400p.
Do your own research and this is NOT a solicitation to hold, buy or sell.

Gold - Heading Higher For Another +30%!Gold ( TVC:GOLD ) won't stop any time soon:
Click chart above to see the detailed analysis👆🏻
Back in 2015 we witnessed a significant rounding bottom formation on Gold, starting the next major bullrun. With the all time high breakout back in the end of 2023, this rally was just confirmed and after the recent trendline breakout, Gold can still head much much higher.
Levels to watch: $4.000
Keep your long term vision,
Philip (BasicTrading)

Breakout Retest Possible?431 - 433 is a Good Support level as of now.
However, Extreme Pressure may bring the price towards
420 - 429 which is also the breakout re-test level.

Still Bullish.Still Bullish.
Long Consolidation Box - Breakout
Still has the potential to touch 26 - 27
Huge Volumes; though candle of 24-03-2025
closed red due to heavy selling but...

Bullish Flag / Pennant Pattern Formation appearing.
Bullish Flag / Pennant Pattern Formation appearing.
87 - 88 is the Breakout Level; but Important Resistance
lies around 90 - 92
Closing above 100 - 101 would trigger more positivity.
Crossing & Sustaining this level may expose new Highs
around 130.
However, it should not Break 73.

Breakout Retest done?Retested previous Breakout level around 93 - 94.
For Fresh Entry, 105 - 106 is the watchout level.
Immediate Targets then can be around 112 - 113
initially.

Will Gold Retest 3170 ATHs in Sight Amid Rising Global TensionsXAU/USD has decisively broken above the significant 3170 resistance level, confirming bullish momentum and signaling a potential continuation of its long-term uptrend. This breakout is not just technical—it's backed by a growing fundamental storm.
With escalating geopolitical tensions, the ongoing trade war rhetoric surrounding Trump’s tariff policies, and persistent global macro uncertainty, gold is once again asserting its role as a premier safe haven asset. These drivers are creating the perfect backdrop for further upside, possibly pushing gold toward new all-time highs.
Currently, price is in a healthy correction phase, pulling back toward the former resistance zone at 3170, which now acts as strong support. A retest and confirmation in this area may offer a high-probability long setup for trend-followers and breakout traders alike.


Bullish on Bigger Time Frames.Bullish on Bigger Time Frames.
but Important Resistance area is around 145 - 148.
Crossing this rangewith Good Volumes will expose
the levels around 170 & then 190.
132 & 125 are important Support levels as of now.

Breakout trading
(Title)
Breakout trading starts with finding support and resistance points
-------------------------------
Hello, traders.
If you "Follow", you can always get new information quickly.
Please click "Boost" as well.
Have a nice day today.
-------------------------------------
I will take the time to talk about breakout trading.
This is my opinion, so the content may be lacking.
The reason I did not explain what other people say with examples is because trading is a psychological battle.
Most of the content in books or on the Internet is explained with patterns.
However, it is not easy to find patterns when checking the movement of a real-time chart.
Therefore, I think it is more important to understand why such movements occur than to explain them with patterns.
Therefore, I think it is better to create a trading strategy by finding support and resistance points and checking whether or not they are supported by the support and resistance points rather than memorizing patterns.
Breakout trading refers to starting a transaction after checking whether there is support at a point or section when the price rises above a certain point or section, and there is a possibility of a larger rise.
If you do a breakout trade incorrectly, you may end up buying at a high point, which could result in a large loss, so it is recommended to always keep a stop loss point when trading.
In order to reduce the stop loss, you need to make an effort to lower the average purchase price by selling in installments when the price rises after purchasing and buying in installments when the price falls again.
Therefore, the stop loss point is when it is beyond the range you can handle.
-
Let's take the BTCUSDT 1D chart as an example.
It has fallen after renewing the ATH.
Looking at the current price position, it feels like it will fall further.
However, if the price rises to around the HA-Low indicator on the 1D chart, that is, around 89294.25, you will feel like it will turn into an uptrend.
Even if you think that you won't feel that way now, you will feel that way after it rises.
Therefore, the most important thing in breakout trading is to find important support and resistance points.
To find support and resistance points, you need to basically understand candles.
Any book or video about candles will do.
I recommend that you don't try to memorize the content in it, but read or watch it repeatedly several times.
In my case, after watching the video about candles about 3 times, my understanding of the chart became easier.
The reason for finding support and resistance points is to select a trading point.
What you need to find support and resistance is a horizontal line.
It is not easy to start trading with chart tools that are not horizontal lines but diagonal lines or curves.
The reason is that when you try to start a trade, you are more likely to miss the timing because your psychological state is added.
-
You can see that the uptrend started when it broke through the 73072.41 point.
Therefore, you can see that it is possible that the uptrend will start when it breaks through the 106133.74 point this time as well.
However, in this case, since it is rising while renewing the ATH, it is a point where it is thought to be difficult to actually start trading.
In other words, it is likely that you will be reluctant to trade because it is thought to be a high point.
Therefore, as I mentioned earlier, the actual breakout trade will be conducted when it breaks through the 89294.25 point.
Then, even if it rises to around the 106133.74 point, you will be more likely to respond stably without feeling much psychological anxiety.
-
However, there is one problem.
That is, the StochRSI indicator is currently in the overbought zone.
Therefore, when it rises near the 89294.25 point and confirms support, the StochRSI indicator should show a downward trend from the overbought zone.
Otherwise, the 89294.25 point is likely to act as a resistance point.
Even if the market is messy and difficult to predict, you should not be too busy finding support and resistance points.
After all, you need to have a standard for creating a trading strategy to start trading.
It is better to create a trading strategy and respond at the support and resistance points you have selected if possible.
Even if you suffer a loss, if you continue to trade, you will be able to better organize the support and resistance points.
For reference, the indicators that can create a trading strategy on my chart are the HA-Low and HA-High indicators.
-
Thank you for reading to the end.
I hope you have a successful trade.
--------------------------------------------------

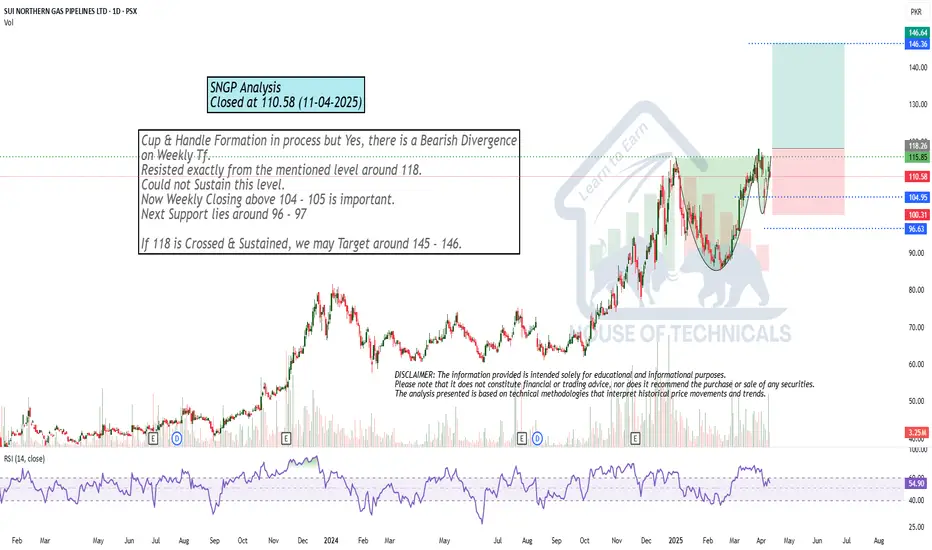
Cup & Handle Formation in process but Cup & Handle Formation in process but Yes, there is a Bearish Divergence
on Weekly Tf.
Resisted exactly from the mentioned level around 118.
Could not Sustain this level.
Now Weekly Closing above 104 - 105 is important.
Next Support lies around 96 - 97
If 118 is Crossed & Sustained, we may Target around 145 - 146.