XAUUSD Analysis Falling Wedge breakout Setup to Target🔍 1. Market Context & Structure
Gold has recently experienced a sharp decline, as evident from the aggressive bearish candles leading into the consolidation phase. Following this downward momentum, the market began to consolidate, forming a Falling Wedge pattern—a bullish reversal structure that often signals an impending upside breakout, especially after a strong bearish trend.
📉 2. Falling Wedge Pattern
The wedge is formed by two downward-sloping trendlines that converge, containing price within lower highs and lower lows.
Notice how price is respecting both boundaries, confirming the validity of the pattern.
The pattern also features a series of higher lows, showing a loss of bearish momentum.
🟩 3. Support and Resistance Levels
Resistance Zone: Around $3,035 to $3,045 — This level previously acted as a strong supply zone where price was rejected multiple times.
Support Zone: Around $2,972 to $2,985 — Clearly marked area where buyers stepped in strongly during the sharp pullback.
These levels are critical to observe for any breakout or breakdown confirmation.
📊 4. Trade Plan Based on the Chart
✅ Bullish Bias:
Given the falling wedge setup and slowing bearish pressure, the trade idea favors a breakout to the upside.
🔵 Entry Point:
A confirmed breakout above the wedge’s upper boundary (around $3,030–$3,035), ideally on strong bullish volume.
🎯 Target:
The first take profit level is marked at $3,078.438, aligning with a prior resistance and measured move projection from the wedge’s height.
🔴 Stop Loss:
Positioned just below the most recent swing low and wedge boundary at $3,013.707, offering protection if the breakout fails.
🧠 5. Why This Setup Matters
Wedge patterns are high-probability when they form after a sharp move, as seen here.
Volume confirmation on the breakout would solidify this as a reliable opportunity.
Risk-to-reward ratio appears favorable, with a tight stop and a higher projected upside.
🧭 Conclusion
This is a textbook falling wedge breakout scenario. The consolidation after a bearish leg, narrowing price action, and repeated support reactions indicate that bulls are gearing up. If Gold breaks above the wedge with momentum, there’s potential to ride the move toward $3,078. Always wait for confirmation and manage your risk accordingly.
Breakouttrading

Can EURUSD Take Out the Major High 1.12000?EURUSD Major Forex Pair
Following Trump’s tariff policies announced on Friday, the price of the EURUSD forex pair broke the daily higher high structure and is now returning to retest that level. This morning, the price bounced off the 0.618 daily Fibonacci level, suggesting that it may move upward again, potentially reaching the major high around 1.12000 or hitting one of the Fibonacci extension levels.
Price Action on the 4-Hour Chart
I have shifted down to the 4-hour chart to analyze the price action in more detail. While it appears somewhat chaotic due to Friday's news and the aggressive bullish impulse, it’s encouraging that the price broke through the higher high structure and is now retesting it.
At this point, I would like to see the price remain above the 0.618 daily Fibonacci level and stay within the upward trendline. Additionally, the price is forming a symmetric triangle. Once it breaks out of this pattern, I plan to enter a buy position with a risk-to-reward ratio of 1:2, targeting the supply area near the major high.
I will provide an update as more price action develops later in the week, so stay tuned!

Dogecoin - You Should Not Be Afraid!Dogecoin ( CRYPTO:DOGEUSD ) could reverse right now:
Click chart above to see the detailed analysis👆🏻
Four months ago Dogecoin perfectly retested the previous all time high and is now creating the anticipated bearish rejection. However during every bullish cycle we saw a correction of at least -60%, which was followed by a parabolic rally, so there is no reason to be worried at all.
Levels to watch: $0.2, $0.5
Keep your long term vision!
Philip (BasicTrading)

It's about to explodeThe British Pound looks very strong across the board. Check my post of GPBCHF lines below. Is forming a bullish flag at the monthly resistance to break it up violently. If it pulls back I'll add more. SL triggers is a weekly candles closes under the bottom of the flag but I hardly doubt it. I'm almost all in on the British Pound.

"ETH/USD: Breakout Incoming? Buy Signal from Falling Wedge!"It illustrates a downward trend with a falling wedge pattern, which is a bullish reversal pattern.
Key Observations:
Falling Wedge Pattern:
The price has been trading within a downward-sloping channel.
The wedge pattern suggests a potential breakout to the upside.
Breakout Opportunity:
The price is currently near the lower boundary of the wedge, suggesting a potential buying opportunity.
A buy signal is indicated at a key support level.
Target Price:
The chart has a target zone around $2,531 – $2,562, which suggests an expected upward move.
Technical Indicators:
The price is currently around $1,815, indicating a possible bottom formation.
A bullish move from this level is expected.
Trading Idea:
Entry: Buy near the current price ($1,815).
Target: $2,531 – $2,562.
Stop-Loss: Below $1,723 for risk management.
This analysis suggests a bullish reversal with a potential breakout from the falling wedge. However, traders should confirm with volume and other indicators before entering a trade.

Enterprise Products Partners L.P. 5 Day Long Swing IdeaI found a good stock, and I shared my target profit and stop loss in the video. Also, I shared the screener I use alongside in a kangaroo market.

#HIVEUSDT is maintaining a bearish structure📉 Short BYBIT:HIVEUSDT.P from $0.2424
🛡 Stop loss $0.2455
🕒 1H Timeframe
⚡️ Overview:
➡️ The POC (Point of Control) is at 0.2527, marking the area with the highest trading volume and now acting as major resistance.
➡️ The 0.2455 level serves as local resistance — price has already started to decline from that zone.
➡️ Price BYBIT:HIVEUSDT.P is steadily moving lower and staying below volume clusters, confirming the bearish structure.
➡️ A breakdown below $0.2424 could lead to acceleration toward target zones.
🎯 TP Targets:
💎 TP 1: $0.2399
💎 TP 2: $0.2379
💎 TP 3: $0.2366
📢 Watch for confirmation of the $0.2424 breakdown — it’s key for continuation.
📢 If price reclaims $0.2455, the short setup becomes invalid.
BYBIT:HIVEUSDT.P is maintaining a bearish structure — expect quick target reaction if the signal confirms.

XAUUSD Breakout Trade – Target Hit!In this trade, we identified a downtrend breakout on Gold (XAU/USD) using the 1-hour chart. A descending trendline was broken, signaling a shift in momentum. After price retested a key support zone around $3,023.75, buyers stepped in, confirming the breakout.
A long position was taken with a stop loss below the recent lows, ensuring a safe risk-to-reward ratio. The trade played out beautifully, with strong bullish momentum pushing the price towards our take profit (TP) level at $3,057.37.
This setup highlights the power of trendline breaks and retests, offering high-probability entries for traders. With gold showing strength, we’ll watch for further bullish continuation or potential pullbacks for new opportunities.
📊 Key Takeaways:
✔ Trendline breakout confirmed by retest
✔ Strong bullish momentum
✔ TP hit successfully for solid profits
#Gold #XAUUSD #ForexTrading #BreakoutStrategy #TradingSuccess

Gold (XAU/USD) – Triangle Breakout & Bullish Trade Setup Overview
This 1-hour Gold Spot (XAU/USD) chart showcases a well-defined symmetrical triangle pattern, which has successfully broken out to the upside. This breakout indicates strong bullish momentum, setting up a potential rally towards $3,107 and beyond.
The analysis below will cover:
✅ Triangle Pattern Formation & Breakout Explanation
✅ Key Technical Levels (Support, Resistance, ATH)
✅ Entry, Stop Loss, & Take Profit Strategies
✅ Risk Management Considerations
✅ Final Trade Setup & Market Sentiment
Let’s dive into the details.
1️⃣ Chart Pattern: Symmetrical Triangle Formation
What is a Symmetrical Triangle?
A symmetrical triangle is a common continuation pattern in technical analysis that forms when price consolidates within two converging trendlines. This structure indicates a period of indecision in the market before a potential breakout occurs.
When price breaks above the upper trendline, it signals a bullish continuation.
If price breaks below the lower trendline, it suggests a bearish move.
In this case, gold has broken above the upper resistance trendline, signaling a continuation of the existing uptrend.
Pattern Breakdown (Step by Step):
Triangle Formation: The price made higher lows and lower highs, compressing within the pattern.
Price Squeeze: As the market approached the apex of the triangle, volatility decreased, indicating an imminent breakout.
Breakout Confirmation: A strong bullish candle closed above the resistance trendline, validating the pattern and confirming bullish momentum.
2️⃣ Key Technical Levels & Zones
🔹 Support & Resistance Zones:
Support Level: $3,012 - $3,020 (Highlighted as a strong demand zone where buyers stepped in).
Resistance Level: $3,080 (Previously acted as strong resistance but has now turned into support post-breakout).
All-Time High (ATH): Marked just below $3,090, where price previously struggled to break through.
🔸 Breakout Target & Price Projection
Breakout Level: The breakout happened above $3,080, confirming an uptrend continuation.
Target Calculation:
The height of the triangle is projected upwards from the breakout point.
This gives us a price target of $3,107 - $3,120 in the short term.
3️⃣ Trading Strategy Based on Breakout
✅ Entry Strategy:
Aggressive Entry: Entering immediately after the breakout candle closes above $3,080, riding the momentum.
Conservative Entry: Waiting for a potential pullback to $3,080 (now acting as support) before entering a long position.
⛔ Stop Loss Placement:
Ideal Stop Loss: Below the previous support zone at $3,012, ensuring protection against fake breakouts.
Tighter Stop Loss: Just below the breakout point at $3,065, in case of a minor retracement before moving higher.
🎯 Profit Target Strategy:
Short-Term Target: $3,107, based on the triangle’s measured move.
Extended Target: If momentum sustains, $3,120+ could be achieved, aligning with previous bullish trends.
4️⃣ Risk Management & Market Considerations
Risk Factors to Monitor:
🔸 Volume Confirmation: A breakout with high trading volume is a stronger signal than one with low volume.
🔸 Market Fundamentals: Events like US inflation data, Federal Reserve rate decisions, and geopolitical tensions can impact gold prices.
🔸 False Breakout Risk: If price falls back below $3,080, the breakout might be invalid, signaling a potential reversal.
Risk-Reward Ratio:
📌 Entry: $3,080
📌 Stop Loss: $3,012 (Approx. 68 points risk)
📌 Target: $3,107 - $3,120 (Approx. 27-40 points reward)
📌 Risk-to-Reward Ratio: 2:1+, making this a favorable trade setup.
5️⃣ Market Sentiment & Final Trade Setup
📈 Bullish Outlook:
The successful breakout above the symmetrical triangle signals continued bullish strength.
Price is holding above the previous resistance zone at $3,080, now acting as support.
The next resistance target is $3,107 - $3,120, aligning with previous swing highs.
🔴 Bearish Scenario (If Invalidated):
If price falls back below $3,080, it could indicate a false breakout.
A break below $3,065 might lead to a retest of the $3,012 support zone.
📊 Final Trading Plan:
✅ Buy (Long) at: $3,080 - $3,085
🎯 Target 1: $3,107
🎯 Target 2: $3,120+ (Extended Target)
⛔ Stop Loss: $3,012
🔥 Conclusion: Bullish Bias with Caution
Gold (XAU/USD) has successfully broken out of the symmetrical triangle, signaling a strong bullish continuation. As long as price holds above $3,080, the bias remains bullish, targeting $3,107 - $3,120.
💡 Key Takeaway: Watch for a pullback and retest of $3,080 before entering, ensuring confirmation before committing to the trade.
🚀 Final Outlook: Bullish – Gold is positioned for further upside if momentum continues!

Gold (XAU/USD) Bullish Retest SetupMarket Structure & Analysis:
Uptrend Confirmation: Price has been in a strong bullish trend, forming higher highs and higher lows.
Resistance & Retest: The price recently hit a resistance zone around $3,054 and pulled back for a retest.
Support Zone: A key support level is marked at $3,010, which has held multiple times.
Bullish Retest Setup: If the price successfully retests this support level and confirms bullish momentum, we can anticipate a potential move toward the next resistance level.
Target Levels:
First Target: $3,054 (recent high)
Final Target: $3,089 (next major resistance)
Trading Plan:
Buy Setup: Enter after confirmation of bullish price action at the support level ($3,010).
Stop Loss: Below $3,010 to avoid false breakouts.
Take Profit:
TP1: $3,054
TP2: $3,089
Risk Factors:
If the support at $3,010 breaks, price may drop toward the next major support at $2,911, invalidating the bullish setup.
Economic events (such as FOMC meetings, CPI data, or geopolitical risks) may cause unexpected volatility in gold prices.

USDJPY 18K PROFIT LIVE TRADE AND BREAK DOWNUSD/JPY rebounds toward 150.50 on risk recovery
USD/JPY is bouncing back toward 150.50 in Wednesday's Asian session. The pair reverses US President Trump's fresh tariff threats and hawkish BoJ commentary-led drop, tracking the rebound in risk sentiment and the US Dollar. All eyes stay on US tariffs, data and Fedspeak.

Ethereum (ETH/USD) Bullish Breakout – Eyes on $2,500+ Target 📈 Chart Overview:
Timeframe: 4H (Ethereum/USDT)
Trend Reversal: Ethereum has broken out of a falling wedge pattern, indicating a shift from bearish to bullish momentum.
Support Level: Around $1,800 - $1,900, where price previously found strong buying interest.
Retest Confirmation: ETH successfully retested the breakout level (~$2,020), confirming a potential bullish continuation.
Resistance Zone: The next key resistance area is around $2,250, followed by a potential move towards the $2,530 - $2,550 target zone.
📊 Trade Setup:
Bullish Bias: Price action suggests an upward move towards $2,250 and potentially $2,530.
Risk Management: A stop-loss can be set below $2,020 to minimize downside risk.
🔥 Conclusion: If Ethereum maintains momentum above the retest zone, it could see a strong rally in the coming days! 🚀

#ETHUSDT is forming a potential mid-term reversal📉 LONG BYBIT:ETHUSDT.P from $2102.90
🛡 Stop loss at $2083.00
🕒 Timeframe: 1D (Mid-term idea)
✅ Overview:
➡️ BYBIT:ETHUSDT.P Falling Wedge breakout confirmed on the daily chart.
➡️ Successful retest of the $1,955–$2,041 zone.
➡️ Holding above $2,101 opens the way to higher levels.
➡️ Volume is increasing post-breakout — confirming buyer interest.
➡️ Next strong resistance block lies between $2,308–$2,522.
🎯 TP Targets:
💎 TP 1: $2112.00 — nearest resistance and key liquidity zone.
💎 TP 2: $2125.00 — a critical daily level, zone of pullback from previous drop.
💎 TP 3: $2134.00 — potential impulse target toward major POC ($3,373).
📢 If price fails to hold above $2,068 and breaks below $2,041 — the setup is invalidated.
📢 A retest of $2,101 from below may be needed before a stronger upward move.
📢 Volume support at $1,955 is critical for the bullish case.
🚀 BYBIT:ETHUSDT.P is forming a potential mid-term reversal — if price holds above $2,101, a move toward $2,200+ and beyond is expected.

BTC/USD – Bearish Rejection, Targeting SupportChart Analysis:
BTC/USD is trading within a descending channel, showing a bearish trend.
Price recently tested the resistance zone but faced rejection.
A strong sell signal is indicated, suggesting a move towards the support level around $79,877.
If price breaks below support, further downside is possible.
Trading Plan:
Sell below resistance with a target at support.
Watch for confirmation signals before entering a position.
If price breaks above resistance, a trend reversal could be possible.

XAUUSD – Symmetrical Triangle Breakout or Breakdown?Gold (XAUUSD) is currently coiling within a symmetrical triangle on the 1H timeframe, indicating that a high-probability breakout or breakdown is imminent. Price is consolidating after a strong bullish trend, but volatility is compressing—typically a precursor to explosive movement.
📊 Technical Analysis
1. Symmetrical Triangle Formation
Price has been tightening within a symmetrical triangle, marked by lower highs and higher lows.
These patterns typically resolve in the direction of the preceding trend—but can also serve as reversal zones, especially at key highs.
2. Dual Scenarios Mapped Out
Bullish Breakout: If price breaks above the triangle, bulls may push toward the psychological resistance and Fibonacci extension target near 3,101.642, continuing the trend.
Bearish Breakdown: A rejection at triangle resistance and clean break below the support line could send gold down to the demand zone around 2,929, a 2.6% potential move, aligning with previous structure support.
3. Key Support Zone
The highlighted yellow block shows a strong demand zone, previously respected during a mid-March consolidation.
Price could seek this level if the triangle resolves to the downside.
🧠 Trade Setup Ideas
Bullish Bias: Break and hold above 3,020, potential long entry with TP around 3,101
Bearish Bias: Breakdown and close below 3,000, targeting the 2,930–2,915 zone
Invalidation Levels: Above 3,035 for bearish, below 2,995 for bullish

Break or Bounce? EUR/USD OpportunityHi Traders! The price is in a descending channel and is testing the lower boundary.
🔹 Scenarios:
Buy if it breaks above 1.0845, with a stop loss at 1.0790 and targets at 1.0870, 1.0900, and 1.0950.
Sell if it breaks below 1.0780, with a stop loss at 1.0830 and targets at 1.0750, 1.0720, and 1.0700.
📊 RSI is in the oversold zone—a potential bounce is possible! Watch the price action closely.
📢 Stay updated with live market movements!
🔥 Smash that like button and show some energy! Let’s trade like pros!
⚠️ Disclaimer: This analysis is for educational purposes only and does not constitute financial advice. Trade at your own risk.

Bounce from 200 EMA – Is XRP Ready to Fly?XRP is currently showing bullish momentum as it pushes toward the strong resistance zone after bouncing off the 200 EMA, which is acting as dynamic support. This move follows a consolidation phase above the strong support zone, indicating accumulation.
If the price breaks and sustains above the resistance zone, it could trigger a strong upward move.
DYOR, NFA


CHF/USD Trading Setup – Triple Bottom Reversal & Breakout Setup🔍 Overview of the Chart Setup
The CHF/USD (Swiss Franc vs. U.S. Dollar) 1-hour timeframe chart reveals a classic Triple Bottom pattern, which is a well-known bullish reversal signal. This pattern indicates that sellers have attempted to break the support level three times but failed, suggesting a potential shift in momentum from bearish to bullish.
Traders closely watch this structure as it often leads to a strong upward breakout once key resistance levels are breached. The current setup provides an excellent risk-to-reward trading opportunity, especially for those looking to capitalize on the breakout.
📊 Key Levels in the CHF/USD Chart
1️⃣ Support and Resistance Zones
🟢 Support Level (~1.1300 - 1.1280 Zone)
This zone has been tested three times, confirming strong buying interest at this price level.
The formation of long wicks on candlesticks signals strong demand and buyer dominance.
A breakdown below this level would invalidate the bullish setup and may indicate a continuation of the bearish trend.
🔴 Resistance Level (~1.1415 - 1.1430 Zone)
This level acts as a price ceiling, where previous bullish attempts were rejected.
A break and retest above this zone would confirm the Triple Bottom breakout.
🎯 Target Level (~1.1457 Zone)
The projected target is based on the height of the pattern, which is measured and added to the breakout point.
This level aligns with previous price action zones and acts as a natural take-profit area for traders.
🚨 Stop-Loss Level (~1.1243 Zone)
A stop-loss is placed below the support zone to protect against false breakouts or an invalidation of the pattern.
📉 Understanding the Triple Bottom Pattern
The Triple Bottom is a strong bullish reversal formation that occurs at the end of a downtrend. It signals that sellers are exhausted, and buyers are gradually taking control.
🔹 Breakdown of the Triple Bottom Formation
✅ Bottom 1 (First Low)
The first bottom forms when the price hits the support level and bounces back.
Sellers are still active, so price declines again to test the same support zone.
✅ Bottom 2 (Second Low - Confirmation of Support)
The second test of the support zone validates the demand area.
Buyers step in again, pushing the price upward.
The market still lacks enough momentum for a breakout, leading to a third retest.
✅ Bottom 3 (Final Low and Strong Rejection)
The third bottom is crucial because it signals the last test of support before a breakout.
The failure to break lower creates a higher probability of an upside move.
📌 Breakout Confirmation & Price Action Signals
🔵 The breakout is confirmed when:
The price closes above the resistance zone (1.1415 - 1.1430) with strong momentum.
Volume spikes during the breakout, indicating institutional buying interest.
A successful retest of the resistance zone as new support further validates the trend reversal.
If the breakout lacks volume or gets rejected, traders should be cautious of a fakeout or potential retracement.
📈 Trading Strategy & Execution Plan
🔹 Conservative Entry (Safe Approach)
Enter after a confirmed breakout above 1.1415, ensuring a strong candle close above resistance.
Look for a retest of the breakout level before entering the trade.
🔹 Aggressive Entry (Early Positioning)
Enter near the third bottom (~1.1300 - 1.1320) with a tight stop-loss.
Higher risk but better reward if the price moves upward without retesting.
🔹 Stop-Loss Placement
Conservative traders: Place the stop-loss below the support zone (~1.1243).
Aggressive traders: Place a tight stop below the recent swing low for better risk management.
📌 Profit Target Projection
Take Profit Target: 1.1457, based on the height of the pattern.
📌 Risk-to-Reward Ratio
Risk: ~60 pips (from entry to stop-loss).
Reward: ~150 pips (from entry to target).
Risk-to-Reward Ratio: 1:3, making it a high-probability trade.
📡 Additional Confirmation Indicators for Stronger Trade Setup
📊 1. Volume Analysis
A spike in volume at the breakout level suggests strong buyer interest.
Low volume on the breakout may indicate a potential fakeout.
📈 2. RSI (Relative Strength Index) Confirmation
RSI should be above 50 and trending upward to confirm bullish momentum.
If RSI is overbought (>70), watch for a pullback before entering the trade.
📉 3. Moving Averages Support
If the 50-period or 200-period moving average supports the breakout level, it adds extra confirmation.
A moving average crossover may further validate the trend reversal.
🔍 4. Beware of Fake Breakouts
If the price briefly moves above resistance but fails to hold, it may be a bull trap.
Always wait for a candle close above resistance and a potential retest before confirming the entry.
🛠️ Alternative Scenarios & Market Risks
🔺 Bullish Scenario (Breakout & Rally to Target)
Price breaks above 1.1415, confirming a trend reversal.
A retest of resistance as support gives additional buying confidence.
Price reaches 1.1457 target before facing new resistance.
🔻 Bearish Scenario (Fakeout & Breakdown Below Support)
Price fails to hold above resistance and falls back below support.
A breakdown below 1.1243 invalidates the pattern, triggering a bearish continuation.
Traders should cut losses quickly if the setup is invalidated.
⚠️ Fundamental Risks to Watch
U.S. Dollar news events (FOMC, NFP, CPI reports) can increase volatility.
Swiss economic data may impact CHF strength.
Unexpected geopolitical events can influence currency movements.
🔎 Summary of the Trading Plan
📌 Trading Strategy Checklist
✅ Pattern: Triple Bottom (Bullish Reversal).
✅ Entry Strategy: Buy after breakout confirmation above 1.1415.
✅ Take Profit Target: 1.1457.
✅ Stop-Loss Level: Below 1.1243.
✅ Risk-to-Reward Ratio: 1:3 (High-Profit Potential with Proper Risk Management).
💡 Final Thought:
This setup provides a high-probability bullish trade with strong technical confluence. However, always remain cautious of market news, economic reports, and sudden volatility that could influence price action.
🚀 Patience & discipline are key—wait for confirmation before entering! 📊

Breakout ExpectedMonthly Closing above 18.40 will trigger
further upside.
Long Consolidation Breakout Expected.
Bullish on Weekly TF.
Hidden Bullish Divergence on Weekly TF.

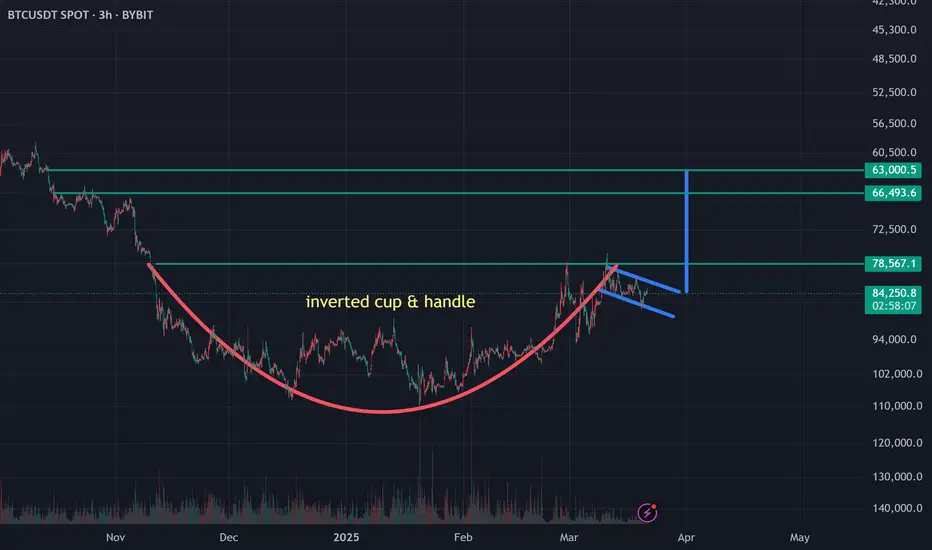
Bitcoin Inverted Cup & handle Bitcoin is forming an inverted Cup & handle pattern with a target of 63k-66k. I was surprised to see this when I inverted the chart. Just sharing with you what I see, and I hope the pattern changes and we continue to go up. However the highest probability at the moment is further downside, but we may still have a bounce toward 89k-91K before seeing the blood.
NikePoor results mean Nike has broken out of a triangle pattern which started forming in March 2022.
Clean break down with large sell side volume.

EUR/GBP Analysis – Symmetrical Triangle Breakdown & Bearish MoveThis EUR/GBP chart on the 1-hour timeframe showcases a well-defined symmetrical triangle formation, a widely recognized pattern in technical analysis that signals potential breakout opportunities. The price action has respected the converging trendlines, indicating consolidation before a decisive move. Recently, the market has broken below the support zone, confirming a bearish breakdown and providing a strong signal for potential downside movement.
This analysis will cover pattern formation, key technical levels, trading strategy, risk management, and future market outlook to provide a comprehensive professional breakdown of this setup.
1. Chart Pattern Analysis – Symmetrical Triangle Formation
A symmetrical triangle consists of two converging trendlines that squeeze price action into a narrowing range, reflecting market indecision. This pattern is considered a continuation pattern, meaning that the price is likely to continue in the direction of the prevailing trend after the breakout.
Pattern Characteristics in This Chart:
✅ Lower Highs: Price fails to break previous peaks, indicating weakening bullish momentum.
✅ Higher Lows: Buyers step in at higher points, preventing aggressive declines.
✅ Volume Decrease: Typical of consolidation within a symmetrical triangle.
✅ Breakout Confirmation: A strong bearish candle broke below the support level, signaling further downside potential.
2. Key Technical Levels & Zones
📌 Resistance Level + All-Time High (ATH) – 0.8421
This level represents the highest point in the pattern, where price faced repeated rejections.
It aligns with a historical resistance zone, indicating a strong supply area.
A breakout above this level would shift the market to a bullish bias.
📌 Support Level – 0.8379 (Now Acting as Resistance)
Previously a key demand zone where buyers defended the price.
Price has now broken below this level, confirming it as new resistance in a bearish scenario.
A successful retest followed by rejection increases downside confirmation.
📌 Stop-Loss Placement – 0.8421
Located above the upper trendline and recent highs to avoid false breakouts.
If price regains this level, the bearish scenario will be invalidated.
📌 Target Zone – 0.82926 (Major Support Area)
This is the next strong support level, acting as a potential take-profit zone for short positions.
It aligns with a previous price reaction area, making it a logical target for sellers.
3. Trading Setup & Strategy – Bearish Trade Plan
The breakdown from the symmetrical triangle structure presents an opportunity to short the pair with a defined risk-to-reward setup.
📌 Entry Strategy:
Enter short positions after price breaks and retests the 0.8379 support level as resistance.
Confirmation should come from bearish candlestick patterns like engulfing candles or pin bars.
📌 Stop Loss:
Placed above 0.8421, above the last swing high, to protect against potential false breakouts.
📌 Take Profit (TP) Target:
First TP: 0.8325 (Intermediate support)
Final TP: 0.82926 (Major support and key structure level)
Alternative Scenario – Bullish Reversal Possibility
If price reclaims 0.8379 and closes above it consistently, the bearish breakdown might be a false move.
A move above 0.8421 would invalidate the bearish setup, leading to potential bullish momentum.
4. Risk Management & Trade Confirmation
✅ Volume Analysis
A significant increase in volume on the breakdown strengthens the bearish outlook.
Low volume retests may indicate a weak reversal attempt, favoring continuation downward.
✅ Bearish Price Action Confirmation
Lower highs and consistent lower lows reinforce a bearish sentiment.
Rejections from the broken support (now resistance) validate the trade setup.
✅ Risk-to-Reward Ratio (RRR)
The Stop-Loss (SL) is tight, and the profit target is significantly larger, making this a high RRR trade.
Ideally, a RRR of at least 2:1 or 3:1 should be maintained for proper risk control.
5. Market Sentiment & Future Outlook
Bearish Bias Strengths:
Trendline break indicates strong downside pressure.
Failed attempts to break resistance suggest weakening bulls.
Global macroeconomic factors and fundamental catalysts may favor GBP strength over EUR in the near term.
Reversal Risks:
A strong bullish breakout above 0.8421 would shift momentum to the upside.
Fundamental news events (e.g., ECB or BoE statements) can impact market direction unexpectedly.
6. Summary & Conclusion
🔹 The EUR/GBP 1-hour chart has broken below a symmetrical triangle pattern, confirming a bearish breakout.
🔹 Key levels to watch: Resistance at 0.8421, support at 0.82926.
🔹 Trading strategy favors short positions, with a target at 0.82926 and a stop loss at 0.8421.
🔹 Confirmation comes from trendline breaks, volume analysis, and lower highs/lows structure.
📌 Final Verdict:
The setup is bearish unless price reclaims 0.8379 and invalidates the structure.
Traders should monitor price action, volume, and news events for further confirmations.
🔥 Potential Profit Target: 80-90 Pips 📉
⚠️ Risk Management is Crucial – Always Use Stop Loss & Proper Position Sizing
