Bitcoin/USDT 1-Hour Outlook: Consolidation Near 200 EMA at 86k.As traders awaiting for breakout
1. **Trend & EMA (200):**
- The **200-period EMA** (Exponential Moving Average) is plotted, acting as dynamic support/resistance.
- Price hovering near the EMA suggests a potential inflection point. A sustained break above could signal bullish momentum, while a drop below may indicate bearish pressure.
2. **Key Levels:**
- **Immediate Resistance:** 86,000 USDT (current price level).
- **Support Levels:** 84,000 → 82,000 → 80,000 USDT.
- A close below 84,000 could trigger further downside toward 82k or 80k. Conversely, holding above 86k might target new highs.
4. **Actionable Insights:**
- **Bullish Scenario:** Hold long positions if price sustains above 86k, targeting 88k–90k.
- **Bearish Scenario:** A break below 84k could signal short opportunities toward 82k.
- Use tight stop-losses (e.g., below 84k for longs) due to the tight consolidation range.
Breakouttrading

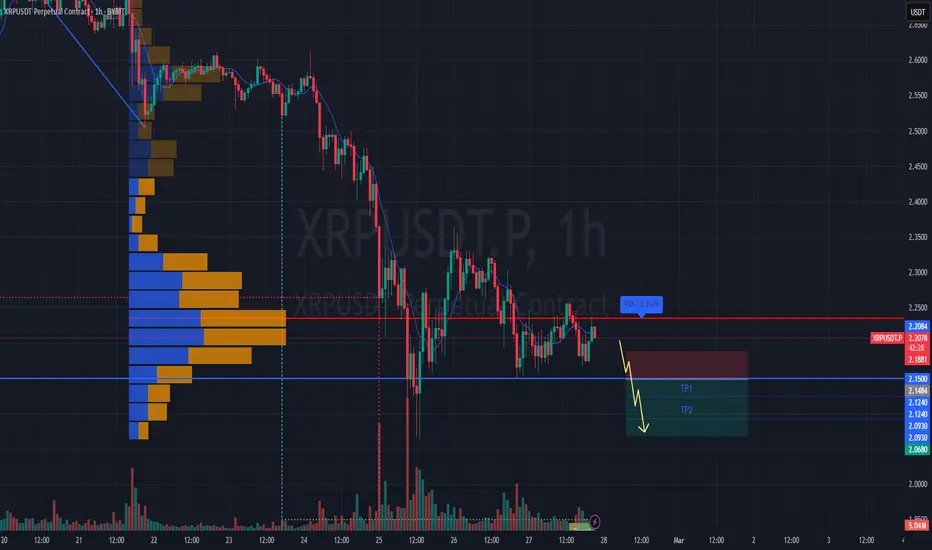
#XRPUSDT – Bearish Scenario, Expecting a Breakdown📉 SHORT BYBIT:XRPUSDT.P from $2.1484
🛡 Stop Loss: $2.1881
⏱ 1H Timeframe
⚡ Trade Plan:
✅ The BYBIT:XRPUSDT.P price is consolidating below POC (Point of Control) at $2.2119, indicating strong seller dominance.
✅ Attempts to push higher have been quickly rejected, suggesting buyer weakness.
✅ If the current support breaks, a strong downward move is likely.
🎯 TP Targets:
💎 TP 1: $2.1240
🔥 TP 2: $2.0930
⚡ TP 3: $2.0680
📢 A close below $2.1484 would confirm further downside movement.
📢 POC at $2.2119 is a major volume area, now acting as resistance.
📢 Increasing volume on the drop supports the bearish outlook.
📢 Taking partial profits at TP1 ($2.1240) is a smart risk-management strategy.
🚨 BYBIT:XRPUSDT.P remains under selling pressure – monitoring for confirmation and securing profits at TP levels!
#TRUMPUSDT – Bearish Scenario, Expecting a Downward Breakout📉 SHORT BYBIT:TRUMPUSDT.P from $12.492
🛡 Stop Loss: $12.785
⏱️ 1H Timeframe
⚡️ Trade Plan:
✅ The BYBIT:TRUMPUSDT.P price continues to decline after a recent sharp drop.
✅ The chart shows that the asset is consolidating below POC (Point of Control) at $13.105, indicating seller dominance.
✅ The price is testing a support level, and a breakdown could trigger a stronger bearish move.
🎯 TP Targets:
💎 TP 1: $12.305
🔥 TP 2: $12.110
⚡️ TP 3: $11.966
📢 A close below $12.492 would confirm the downward move.
📢 POC at $13.105 is a key volume area that now acts as resistance.
📢 Increasing volume on the decline supports the bearish trend.
📢 Securing partial profits at TP1 ($12.305) is a risk-management strategy.
🚨 BYBIT:TRUMPUSDT.P remains under pressure – monitoring for a confirmed breakdown and securing profits at TP levels!

BPR with Directional Momentum-Filtered Breakouts – PerformanceThe BPR with Directional Momentum-Filtered Breakouts indicator identifies breakout opportunities by filtering momentum shifts and trend strength. The script integrates Balance Price Range (BPR) with an EMA-based trend filter and a cooldown mechanism to refine signal accuracy.
Performance Analysis
📉 Bearish Signals Effectiveness
• The indicator effectively captured multiple shorting opportunities during the downtrend.
• Sell signals aligned with price staying below the EMA, confirming trend direction.
• Momentum-based filtering reduced false signals in sideways conditions.
📈 Bullish Signals Efficiency
• Buy signals appeared in early trend reversal phases, indicating potential bullish setups.
• Some bullish breakouts led to trend continuation, while others encountered resistance.
• A trendline breakout confirmation helped validate certain long entries.
📊 Trade Cooldown & Noise Reduction
• Cooldown mechanism prevented excessive signals in choppy price action.
• Volume-based breakouts helped distinguish strong breakouts from false moves.
Key Observations
✅ Works best in trending markets – Strong trend direction improves signal reliability.
✅ Momentum filtering enhances breakout accuracy – Reduces unnecessary entries.
⚠️ Certain bullish breakouts lacked strength – Additional confirmation may help.
Conclusion
The BPR with Directional Momentum-Filtered Breakouts indicator provides a structured approach to breakout trading by leveraging momentum shifts, EMA-based trend validation, and a cooldown filter to avoid false signals. The script performs effectively in clear trending conditions while reducing noise in ranging markets.

#IPUSDT – Long Setup, Testing Resistance ZoneLONG BYBIT:IPUSDT.P from $7.0000
🛡 Stop Loss: $6.6900
⏱ 1H Timeframe
✅ Market Analysis:
📍 The BYBIT:IPUSDT.P price is showing strong upward momentum, breaking key resistance levels.
📍 The asset has held above the $6.8982 level, which may confirm a continuation of the uptrend.
📍 POC (Point of Control) at $4.8742 – the highest volume area, previously serving as a consolidation point.
🎯 TP Targets:
💎 TP 1: $7.3100
🔥 TP 2: $7.6200
⚡ TP 3: $7.8600
📢 Holding above $6.8982 could confirm trend strength.
📢 A dip toward $6.6900 (stop loss) could be a fakeout – monitoring price action is crucial.
📢 The $7.3100 level is the first TP, where a retracement may occur before further upside.
📢 If the price breaks $7.6200, the move toward $7.8600 becomes more likely.
🚀 BYBIT:IPUSDT.P is showing strength – monitoring the $7.0000 breakout and securing profits as the price moves up.

Ready to Skyrocket? Story/USDT at Key Level!The chart shows a strong uptrend, respecting an ascending trendline with three confirmed touches (1, 2, and 3). The price is currently testing a minor resistance zone, which has previously acted as a rejection point.
At this moment, the price is near the trendline for a potential fourth retest (marked as "4?"). If the trendline holds, it could act as a springboard for another upward move, potentially breaking the minor resistance and continuing the bullish trend.

USDCHF Bearish Breakdown on 4H Chart: Double Top FormationUSDCHF has confirmed a Double Top pattern, followed by a trendline breakout, signaling potential downside momentum. The rejection from the resistance zone led to a breakdown, aligning with Fibonacci extension targets. The first bearish target (Level 1) is set at 0.89215, with a further drop toward (Level 2) at 0.88661 if selling pressure continues.

Aditxt (NASDAQ: ADTX) Set for 3,000% Surge Amidst Falling Wedge Aditxt Inc. (NASDAQ: ADTX) is on the brink of a potential game-changing breakout.
We believe NASDAQ: ADTX could deliver a staggering 3,000% surge, presenting a massive short-term opportunity while holding long-term potential as a leader in the biotech space.
About Aditxt Inc. (NASDAQ: ADTX)
Aditxt Inc. (NASDAQ: ADTX), a cutting-edge biotechnology company founded in 2017 and headquartered in Richmond, Virginia, is revolutionizing immune system monitoring and modulation through its groundbreaking technologies aimed at improving health outcomes. Operating within the healthcare sector, Aditxt specializes in developing and commercializing innovative solutions such as AditxtScore, a pioneering platform designed to help individuals understand, manage, and monitor their immune profiles, offering critical insights into immune responses and potential threats.
Technical Overview
Aditxt Inc. (NASDAQ: ADTX) shares have seen a 5.35% decline in the past 24 hours, currently trading within a steep falling wedge pattern—a historically bullish structure that often precedes explosive breakouts. This wedge has been forming since August 2023, signaling a prolonged consolidation phase. With RSI at 19, ADTX is in deeply oversold territory, making it an attractive setup for a significant reversal.
The support level has already been established, preventing further downside pressure. If ADTX breaks above the 38.2% Fibonacci retracement level, it could act as the catalyst for a 3,000% surge, as traders recognize the wedge breakout and align with the strengthening biotech sector trend.
Despite being listed on NASDAQ, ADTX has an intraday market cap of just $6.879 million, an unusually low valuation given its positioning. This makes it a prime candidate for a revaluation, especially as trading volume continues to rise, indicating increased interest from buyers.
Further reinforcing the bullish thesis is the fact that ADTX is trading below the 50-day, 100-day, and 200-day moving averages. Historically, when a stock is far below these levels with growing volume, it often signals a reversal is on the horizon. The combination of a tight trading range, declining seller pressure, and increasing accumulation suggests that ADTX is nearing a breakout point, with technical conditions aligning for a massive upward move.
#Sponsored

Tesla - The Failed All Time High Breakout!Tesla ( NASDAQ:TSLA ) will reject the all time high first:
Click chart above to see the detailed analysis👆🏻
Tesla was actually not able to create a sustainable all time high breakout and if a stock doesn't move up, it will come down. However Tesla still remains absolutely bullish and is now starting to create a textbook break and retest which will eventually still lead to new all time highs.
Levels to watch: $400, $280
Keep your long term vision,
Philip (BasicTrading)

$NASDAQ:AISP breaking resistance for a 35%++ upsideNASDAQ:AISP broke it's double bottom pattern resistance with some upside potential.
Entry Point: At the current price OR (as I suspect there will be a retest of the $6 resistance) somewhere around $6
Price Target: $8.14 - 35% from the $6 resistance.

Key Support Test – Will RAY Hold & Rally?$RAY/USDT chart shows a key retest of the breakout zone, which previously acted as resistance and is now a crucial support level. A successful bounce could confirm bullish continuation, while a breakdown may lead to further downside.
Additionally, the Stochastic RSI is signaling a bullish crossover at oversold levels, indicating potential upward momentum. If buyers hold this zone, RAY could see a strong rally.
DYOR, NFA

#BTCUSDT remains in a bearish trend📉 SHORT BYBIT:BTCUSDT.P from $94,831.0
🛡 Stop Loss: $95,276.0
⏱ 4H Timeframe
✅ Overview:
➡️ BYBIT:BTCUSDT.P is trading within a descending range after forming a Head and Shoulders pattern, indicating potential further downside.
➡️ Volume Profile suggests that the main liquidity (POC) is positioned above the current price ($95,933.6), reinforcing seller dominance.
➡️ A break below $94,831.0 will strengthen the bearish impulse and confirm buyer weakness.
➡️ The main downside targets are in the $94,470.0 – $94,120.0 range, where a short-term bounce may occur.
⚡ Plan:
➡️ Short entry after breaking $94,831.0, confirming bearish momentum.
➡️ Stop-Loss at $95,276.0—placed above the nearest resistance level to minimize risk.
➡️ Main targets: $94,470.0 and $94,120.0, where demand may emerge.
🎯 TP Targets:
💎 TP 1: $94,470.0
🔥 TP 2: $94,120.0
🚀 BYBIT:BTCUSDT.P remains in a bearish trend—expecting further downside!
📢 BYBIT:BTCUSDT.P is forming a bearish trend, and consolidation below $94,831.0 will reinforce it.
📢 Watch for price reactions near $94,120.0, where a slowdown might occur.

Breakout in Innodata Inc...Chart is self explanatory. Levels of breakout, possible up-moves (where stock may find resistances) and support (close below which, setup will be invalidated) are clearly defined.
Disclaimer: This is for demonstration and educational purpose only. This is not buying or selling recommendations. Please consult your financial advisor before taking any trade.

RUDRABHISHEK READY FOR VOLUME BREAKOUT...NSE:REPL trade at 260 level. Stocks give an 18% upside move on a single day with high volume.
You can watch for a all time high breakout above 280 level...

WAIT FOR BREAKOUT...MCX:COPPER1! trade in a triangle range since 7 month, you wait watch for an upside move after breakout.

GOLD Ready for ALL TIME HIGH BREAKOUT...MCX:GOLD1! trade at 79000 level. You can watch for more upside move after 80000 level breakout.

Wait for Breakout in Silver...MCX:SILVER1! trade at 91600 level. Silver trade in a triangle range last 6 month. You can watch for either up or down side move after breakout...

$NYSE:BBAI 72% Upside - Breaking double bottom resistanceLooks like NYSE:BBAI is finally breaching the double bottom resistance line.
Volume is respectable, relatively higher.
Squeeze is starting to expand
MACD and Williams %R are also flowing in the right direction.
Entry point - anything after the stock closes above $4.81
Initial Price target is ~$8
72% Upside

$NASDAQ:APPS Breaking Out on Massive Volume 73%++ upsideNASDAQ:APPS is breaking out, having closed above the double bottom pattern resistance (at $4.64).
Entry: Any point now. If you want to get it at a more affordable price point, this may retest $4.64.
Price Targets:
$8.06 to complete the Double Bottom pattern 73% upside
$9.91 to complete the Falling Wedge pattern 113% upside

$NYSE:BBAI Gapping up for the next Price TargetNYSE:BBAI broke resistance overnight of $9.94 and is now working toward its next Price Target of ~$12 - $13
$9.94 Should now become the support and we should close above it for the day even if retesting it.

#GNOUSDT remains weak after a strong drop📉 SHORT BYBIT:GNOUSDT.P from $181.40
🛡 Stop Loss: $186.50
⏱ 1H Timeframe
✅ Overview:
➡️ BYBIT:GNOUSDT.P experienced a sharp rally above $210, followed by an equally strong pullback.
➡️ The POC (Point of Control) at $187.27 indicates the highest liquidity area, which serves as a strong resistance level.
➡️ Price is consolidating below $183.12, signaling potential seller dominance.
➡️ If $178.55 breaks downward, further decline toward $175.30 is expected.
⚡ Plan:
➡️ Enter short upon a confirmed break below $181.50.
➡️ Stop-Loss placed at $186.50, above the resistance zone.
🎯 TP Targets:
💎 Take Profit1- 178.55
🔥 Take Profit2- 175.30
🚀 BYBIT:GNOUSDT.P remains weak after a strong drop—expect further downside.

Bitcoin - This Cycle Is Pretty Clear!Bitcoin ( CRYPTO:BTCUSD ) is still 100% bullish:
Click chart above to see the detailed analysis👆🏻
It is actually quite a surprise that we did not see new all time highs on Bitcoin for the past two months. However we had the same thing happening back in 2017 before Bitcoin actually finished the cycle with a parabolic blow off top. So we all know what is very likely to happen next.
Levels to watch: $70.000, $300.000
Keep your long term vision,
Philip (BasicTrading)

Bullish Outlook on 4H Chart: Key Fibonacci Levels in Focus
AUDCAD appears bullish on the 4-hour chart, with the first resistance level (Level 1) at 0.90550. A breakout above this level could drive the pair toward the next key resistance (Level 2) at 0.91257, aligning with Fibonacci retracement levels.
