KOPRAN Showed Breakout with Huge Volume at 52 Weeks High ZoneNSE:KOPRAN
The co. has set up a new API plant at Panoli, commercial production at this facility is expected to be started from Q3 FY25. In FY23, it completed upgradation and expansion of the multi-product plant at the Mahad facility for existing products and to manufacture new molecules.
An integrated Pharmaceutical Company, committed to supplying International
Quality Formulations and Active Pharmaceutical Ingredients (APIs) globally.
State-of-the-art manufacturing facilities and products with various accreditations
and approvals by major global regulatory authorities.
The formulations vertical is operated through Kopran Limited.
The API vertical is being operated under Kopran Research Laboratories Ltd.
(KRLL), a wholly owned subsidiary of Kopran Limited
Breakouttrading

FIEMIND Turned ON its Marubozu Headlights At ALL TIME HIGH ZONE NSE:FIEMIND
GOVT. APPROVED R&D CENTRE
• FIEM’s state of the art R&D Centre offers its clients design and development capabilities in Automotive Lighting & Signalling Equipments and Rear View
Mirrors which meet the specifications of the clients requirements.
• Government of India, Ministry of Science and Technology, Department of Science and Industrial Research has accorded Recognition to Company’s in-house
R&D Unit situated at Rai Industrial Estate, Sonepat.
• The Company’s R&D Centre is established with modern infrastructure, state-of-the-art technology, equipped with latest software, qualified and
experienced manpower.
• FIEM’s in-house R&D Centre has various kinds of testing facilities such as Product Testing, Photometry Testing, Environmental Testing, Thermal Tests,
Electronic Test, Vibration Test, Chemical Test, Mechanical Tests etc.
• Photometry Laboratory of the Company is NABL Accredited.
• Some examples of R&D conducted by company:
• In-house design and development of Railway IPIS (Integrated Passenger Information Systems with LED Display)
• In-house design and development for four wheeler LED Rear combination, LED direction indicator light etc.
• Advantages of in-house R&D unit:
• Diversified and large portfolio of lighting products developed.
• New generation LED technology in automotive and home lighting segments developed.
• Reduction in development time and cost savings to clients.
Company is almost debt free.
Company has delivered good profit growth of 24.4% CAGR over last 5 years
Company has been maintaining a healthy dividend payout of 29.3%

INDOAMIN Showing Volume Strength near ALL TIME HIGH Zone NSE:INDOAMIN
Strengths:
Established market position: IAL was promoted by Mr Vijay B Palkar in 1979, as Techno Chemical Industries, and converted to IAL in 1992. Over the years, the promoters have developed strong expertise in the chemical industry. The company now manufactures oleo, specialty and performance chemicals, used across various industries, such as pharmaceuticals, agrochemicals, fertilizers, petrochemicals, pesticides and perfumeries. Benefits from the longstanding presence of the promoters in the chemical industry and their established relationships with customers and suppliers will continue over medium term.
Above average financial risk profile: The financial risk profile is above average with a robust net worth of around Rs. 213.86 crore as on March 31, 2023. This supports the financial flexibility of the group. Supported by a robust net worth the capital structure is moderate with total outside liabilities to adjusted networth (TOLANW) of 1.72 time as on March 31, 2023. This is expected to remain comfortable going forward. Capital structure is expected to improve over medium term on the back of healthy accruals, absence of large debt funded capex and scheduled repayments. Overall financial risk profile is expected to further improve over medium term.

TATACONSUM: Symmetric Triangle Setup with Key Levels➡ Symmetric Triangle pattern observed
➡ Breakout potential on either side
➡ Strong support levels at ₹1,063 and ₹1,017
➡ Resistance to watch at ₹1,250

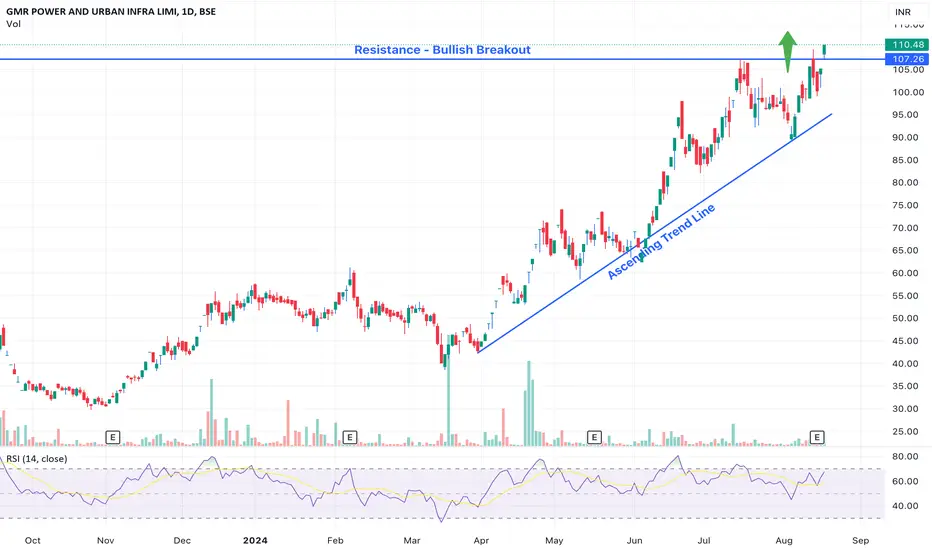
GMR Power: Strong Breakout with Financial MomentumFundamental View
➡ Net profit of ₹1,225.2 crore in Q1 FY24
➡ EBITDA margin expanded by 150 bps YoY
➡ Strong financial performance driven by operational efficiencies
➡ Positioned well in the power and infrastructure sector
Technical View
➡ Bullish breakout above ₹107 with strong momentum
➡ Ascending trend line providing robust support
➡ RSI near 67, indicating strong momentum
7204: Breakout and Retest7204 was in correction for a while within descending parallel channel.
Breakout followed by retest is observed on parallel channel.
Price has started showing HH, HL formations after
taking support from horizontal line
which is also golden pocket fib level.
A Bullish divergence is also formed.
Take entry now (with aggressive or conservative SL) and ride the trend.
Do proper risk management based on your portfolio and appetite.

ADSL: Breakout Retest with Strong Support➡ Previous breakout with significant volumes
➡ Retested and now reversing
➡ Supported by strong levels at 200-190
➡ Momentum expected to pick up above 216
➡ Next resistances to watch: 239 and 254

Tech Mahindra Ltd: Strong Fundamentals and Bullish BreakoutFundamental View:
➡️ PE Ratio: 61 | ROCE: 12% | ROE: 8.63% | Market Cap: ₹1,55,031 Cr
➡️ Strong long-term financials with a 96% dividend payout
➡️ Ranked 5th out of 147 in IT Software
➡️ Global presence with diverse services across 90+ countries
Technical View:
➡️ Bullish breakout observed
➡️ Next resistance from Dec 2021 at 1,660
➡️ Ascending trend line providing strong support
➡️ RSI at 67, indicating strong momentum
➡️ Price above key moving averages (50, 100, 200-day)

JKIL potential breakout Strong prior buying force/uptrend.
Trading in a narrow/tight range.
Low risk entry point.
Volume contraction.

Ethereum Update - Exactly as planned!See last video on Ethereum (from 2 days ago) which said what we were looking out for - buying continuation. We proved our tapered bullish algorithms and are now ready for takeoff!
Happy Trading :)

Gold is set to rise - Bullish Momentum Ahead!Welcome to another analysis, where we dive into the latest market trend and chart the potential path ahead for GOLD !
So is gold a good long-term investment? In my view, the short answer is YES .
Gold is likely to continue rising in the coming years due to several fundamental factors. Firstly, ongoing global economic uncertainty, including inflation concerns and geopolitical tensions, often drives investors toward gold as a safe-haven asset. Central banks around the world are also increasing their gold reserves, reflecting confidence in its long-term value.
If we examine the consolidation period between 2016 and 2019, we can see that the breakout from this consolidation initiated Elliott Wave 3.
What's particularly noteworthy is how well the technical indicators have aligned throughout this process.
The Fibonacci extension tool accurately predicted where gold would peak in 2020. After reaching that peak, gold entered a new period of consolidation and sideways movement as we moved into the new years.
Once again, it appears we've entered another phase of Elliott Wave 3 and will probably soon have a minor correction or sideways time period before going into wave 5.
Looking ahead, my long-term projection for gold suggests a potential peak between $3,200 and $3,500, likely around 2026.
Only time will tell!
Thanks for reading, and make sure to follow me here on tradingview and on X for more updates as we progress: @PuppyNakamoto
CAPITALCOM:GOLD TVC:GOLD MCX:GOLD1!

SHK is Spreading its Fragrances on ChartNSE:SHK
.....................................................................................................
.....................................................................................................
Q1 FY25 performance overview compared with Q1 FY24.
Revenue from operations at Rs. 470.3 crore as against Rs. 422.6 crore, up by 11.3%.
EBITDA** at Rs. 83.3 crore as against Rs. 70.6 crore, higher by 18%.
EBITDA** margin at 17.7% as against 16.7%, expanding by 100 bps.
Adjusted PBT stood at Rs. 46.5 crore as against Rs. 37.8 crore, up 23.1%.
Cash profit at Rs. 55.8 crore as against Rs. 47.7 crore, growing by 17.0% .
.....................................................................................................
.....................................................................................................
Key Developments.
Incorporation of step-down subsidiary – Keva Germany GmbH.
Incorporated Keva Germany GmbH to serve as a Creative Development Centre (CDC)
for European operations, while also providing support to customers in Dubai and
Middle East.
.....................................................................................................
.....................................................................................................
Update on Debt Position:
The Company’s net debt increased to ~Rs. 542 crore as on 30th June 2024 as
compared to Rs. 504 crore as on 31st March 2024.
The debt increase was due to the need to replenish inventory following the fire incident
at its Vashivali facility in April 2024 .
.....................................................................................................
.....................................................................................................
Update on the Fire Incident at the Company’s Fragrance facility located at Vashivali.
A fire incident occurred at the Company’s Vashivali facility in April 2024.
There was no loss of human life, and the safety of all personnel was ensured.
The Company has comprehensive insurance coverage including cover for loss
of profit.
The Company operates five manufacturing locations in India and, in response to the
incident, swiftly implemented a Business Continuity Plan (BCP) by shifting production
to alternate sites.
The new facility is projected to be re-established within 9 to 12 months.
All facilities are now operating in double/triple shifts, ensuring adequate capacity to
meet current and future customer requirements.
Recently commissioned Indonesia facility is ramping up production to cater to both
local and export orders, ensuring continuity and fulfilling commitments to overseas
customers.
An exceptional loss of ₹120 crore (net of tax) was recorded during the quarter due to
the fire, covering plant and machinery, building, and inventory. This loss is expected
to be fully offset by insurance reimbursement in FY2025.
The Company has filed a request for interim payment of Rs. 50 crore with the Insurance
Company. The Insurance company is carrying out the necessary procedure to process
the claim .

IRCTC: Strong Q1 Performance and Key Technical Levels to Watch💰 IRCTC reports a 32.5% increase in net profit for Q1 FY25, indicating strong growth
🔄 Wait to Retrace from major support level
📈 Potential bullish breakout above 955, with resistances at 1002, 1057, and 1139
📉 Watch for bearish breakout if support fails
📊 Follow for analysis!

ONGC: Bullish Breakout Potential with Key Fundamentals
📈 Awaiting bullish breakout above resistance
✅ ₹10,501 crore OPaL investment approved by the government
✅ Gas priced 20% higher than government-set rates
🔄 38.2% Fibonacci retracement level held strong

Preparing for BreakoutSimilar setup to a couple other weed stocks, some which have already broken this down trend line (like ACB). Wait for breakout and retest for ultimate assurance or trust your gut.

HERO MOTOCORP LTD - Awaiting Bullish Breakout
Strong Uptrend: The stock experienced a strong upward movement in May, establishing a bullish trend.
Descending Channel Formation: Currently, the stock is trading within a descending channel, a pattern that often precedes a breakout.
Awaiting Breakout: A bullish breakout above the channel could lead to a continuation of the uptrend.
Target Level: If the breakout occurs, the next target could be the resistance at ₹5,852.

Voltas Ltd: Bullish Breakout Confirmed
Bullish breakout confirmed above the ₹1,556.20 resistance level.
Strong volume support indicating potential for continued upward momentum.
RSI indicates a healthy trend, not yet overbought.
Potential for further gains in the near term.
Keep an eye on upcoming market movements for opportunities.

IREDA Nearing Breakout Levels: Key Zones to WatchIndian Renewable Energy Development Agency (IREDA) is approaching a critical breakout zone. Currently trading at ₹244, it's positioned within a key range with strong resistance at ₹310. Keep an eye on the stock for a potential breakout above ₹254 or a breakdown below ₹233. These levels could define the next major move.

Auro Pharma - Bullish Harami - Daily Time Frame#AuroPharma
PCR : 0.78
Daily Volume : ++ 2.8x
Daily Fut OI change : +2.3
ATM IV : 27.6 (+1.5)
IVP : 16

Tata Steel Ltd - Key Levels for BreakoutTata Steel is currently at a critical juncture. Watch for a potential breakout in either direction. Key resistance levels to monitor are at 169.00 and 181.00. A decisive move in either direction could signal the next major trend.

XRP/USD at a Crossroads: Major Move Imminent!Welcome to another Wolf of Block Street analysis, where we dive into the latest market trends and chart the potential paths ahead!
XRP/USD is at a pivotal juncture, with indicators pointing to a potential significant move in either direction. After years of consolidation, XRP has established strong support at key levels, suggesting that a breakout above recent resistance could trigger a major bullish move. Howewer on the bearish side, XRP is contending with resistance from a downtrend line and declining volume, which eventually could lead to the liq grab to the downside before further upside.
The coming trading sessions will be crucial in determining whether XRP breaks higher or dips lower, making this a critical moment for traders.
Fundamentally, I still believe XRP is the best crypto coin, thanks to Ripple’s extensive work in building a robust payment network and continue their work despite the SEC lawsuit. XRP is faster and more efficient than Bitcoin in every way, offering quicker transaction times and lower fees. An NFT platform is also being built on the XRP-Ledger and we can finally say that Bitcoin and XRP are the only digital assets that have achieved any regulatory clarity!
On that note, thanks for reading!
Make sure to follow me on X for weekly updates: @PuppyNakamoto

AUDUSDAUDUSD has formed inverted Head and Shoulder with strong bullish divergence. As the buyers are getting bids with this confluence.
If the sell pressure resumes and buyers gets active the optimum target will be 0.6780.
What you people think of this idea ?
