Brent Oil Critical ResistanceWhen we apply FRVP analysis to the Brent oil chart, I think HKEX:86 is a critical resistance on the daily timeframe. I can say that brent oil, which has failed to break this level by testing it many times, will test this level again.
Brent

GASOIL UpdateWith today's vicious dip, Gasoil invalidated many alternative scenarios, and I am inclined to see a bullish trend accelerating.

#OIL UpdateWith this flash crash, presumably caused by US-Iran news about a possible swap of nuclear program for oil sanctions , we're back to the scenario where wave [ 2] is already complete and we're in a leading diagonal formation. The nefarious option of an expanding diagonal remains, but it is less likely.

USOIL UpdateIn addition to the base case scenario labelled in colour letters and pale lines, I am introducing a new scenario in which wave [ ii] is not yet completed and is undergoing a more complex yet statistically probable combination of flat (w), double zigzag (x), and triangle (y).
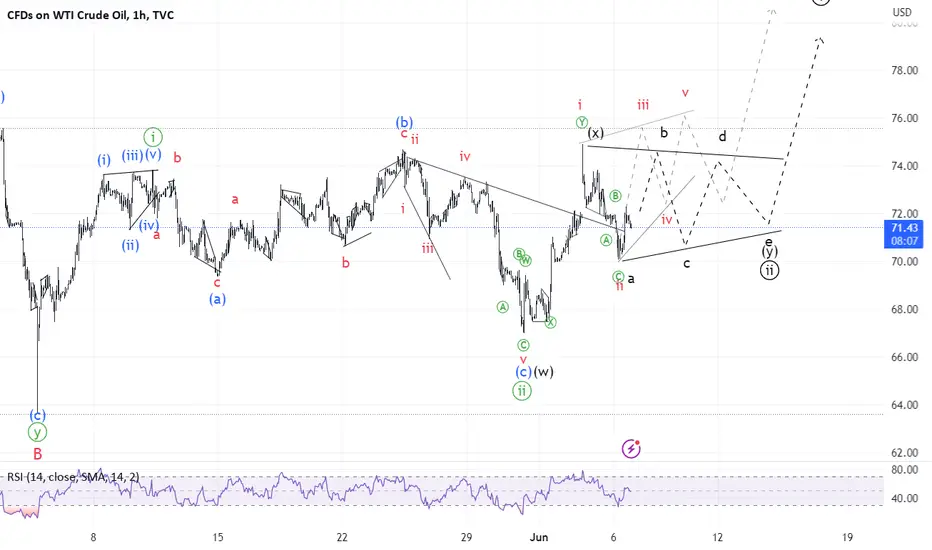
USOIL Oil Update Yesterday was an early call. The market moves in the form of a simpler yet more effective simple zigzag, which can easily develop into a more intricate wxy later on.
Nonetheless, the market has retraced significantly, and I anticipate that the uptrend will continue soon.

USOIL UpdateRight... Clearly, the market is not impressed by His Royal Highness' ability to reign over the oil price. Having said that, I still see an immediate uptrend.
So, either the market will reconsider or something new will occur.
The outlook remains unchanged; I simply had to shift local tops and bottoms.

Brent.Medium-term forecastSeries of 1-2 1-2 can lead brent price to 30 dollars area . It seems impossible today , but in the end of 2019 before the crash " everything was good " Recession , Deflation , liquidity problems will prices down . Everyone hopes on light recession , but everything will be much more worse

WTI UpdateOkay, the Saudis did cut. I must confess that I underestimated His Royal Highness's ability to surprise. That leaves us with a possible gap on Monday. Given the market pressures and the fact that the previous cut was ineffective in sustaining the price, the gap is unlikely to be as large as in April.
The gap is, most likely, wave 3 of (c) of the first wave up in the leading diagonal. There is still a chance that wave (ii) will close the gap, as shown on the chart.
MBS, you did an excellent job. I am not as long as I could have been.

USOIL Additional Chart I feel compelled to share another possible scenario. If OPEC+ fails to agree on a meaningful cut, we may see increased volatility, which could shape an expanding leading diagonal (red dotted line and pale wave count).
The bigger picture is in the previous post .

USOIL Medium Term UpdateI promised in the previous post that I would discuss medium-term charts.
I've been calling for an abrupt rise in ABC flat for a while now. However, price movements develop much more slowly than the human brain expects. I believe I read about this bias in books by R. Prechter on the fundamentals of Elliott Wave analysis.
This time, there is another layer of uncertainty because Brent did not follow WTI in the flash crash on May 4, which marked the local bottom (wave B low) for WTI but not for Brent.
While my expectation of the impending impulse wave C matches the WTI chart perfectly, it is not the same for Brent, where I anticipate an ending diagonal to complete the correction.
This weekend is the much-awaited OPEC+ meeting. However, as I mentioned in my previous post, I suspect limited progress in production-cut talks or a tepid market reaction to any agreed cuts. OPEC core members are grumbling about the cuts as Russia's seaborne exports hit all-time highs to markets that OPEC countries consider their fiefdom, forcing them to redirect volumes to the EU, missing out on shipping.
Therefore I doubt OPEC+ can come up with a decision that will drive oil prices sharply higher in June-July and keep them elevated by the end of the summer. OPEC+ decisions usually lag the market developments and tend to cause short-lived fluctuations at best (though painful when unexpected).
Instead, war drums and EU discussions about the 11th sanctions package could be the catalysts. The EU is considering prohibiting EU entities from purchasing refined products made of Russian oil. Read - India can no longer buy cheap Russian crude to produce diesel and ship to the EU.
I have some ideas about what it could mean for energy markets in the long run, which I will elaborate on in a website article.


Crude - st target 92-96Crude has built the base for a wave (C) to complete circle wave 2. Expect to see a sharp move up to 92-96 zone in Brent. Wouldn't recommend taking longs afterwards.

Crude Oil (WTI) Bullish Pattern Forming 🛢️
It looks like WTI Crude Oil is forming an ascending triangle formation on a daily time frame
that signifies a bullish accumulation.
To confirm a bullish continuation, monitor the neckline of the pattern.
If the price breaks and closes above 74.3 that will confirm the strength of bulls.
A bullish continuation will be expected to 76.6 level then.
❤️Please, support my work with like, thank you!❤️

BRENT CRUDE OIL FUNDAMENTAL ANALYSISCrude oil: gaining on lower inventories
While the broader macro conditions remained complex as hawkish Fed speak and debt ceiling deadlock weighed, crude oil prices managed to inch higher and start the week on a positive note after heavy selling both in paper and physical market over the last few weeks. Supply side news remain mixed with Russian exports remaining firm while OPEC’s early April production cut is only now starting to be felt. Extreme heat across Asia has ramped up demand for fuel oil to run air conditioning and lights while oil traders will be on alert for comments scheduled later today from Saudi Arabian Energy Minister Prince Abdulaziz bin Salman at the Qatar Economic Forum, especially following the recent jump in short selling by funds to levels seen before the April 2 production cut.


BRENT CRUDE OIL FUNDAMENTAL ANALYSISOil prices have remained under pressure over the past month, with Brent crude falling 13.6% amid recession fears in the US and weaker-than-expected economic data out of China. Still-elevated Russian exports and the sizable inventory build at the start of this year due to a milder winter in the Northern Hemisphere have also played a role.
We now see the Brent price reaching USD 95 a barrel by the end of this year, down from our previous forecast of USD 105/bbl, as we expect Russian oil output to stay at around 9.6 million barrels per day (mbpd) instead of 9mbpd in the second half of this year.
However, this means an upside of over 25% from current levels. We still see several main reasons to expect the oil market to be under supplied in coming months:
The International Energy Agency sees robust global oil demand. In its latest monthly oil market report published this week, the Paris-based agency raised its forecast for global 2023 oil demand by 100,000bpd to 102mbpd. It also anticipated tighter market balances in the second half of the year, “when demand is expected to eclipse supply by almost 2mbpd.” While our own forecast puts current global demand at around 101mbpd, we see higher demand in June, boosted by the driving season in the US and more oil being used to generate power to cool down buildings in the Middle East. In fact, we expect the oil market to be undersupplied by nearly 1.5mbpd next month.
Inventory draws are set to be more visible in the months ahead. The US Department of Energy said earlier this week that it plans to purchase 3 million barrels of crude oil for the Strategic Petroleum Reserve for delivery in August, after a record sale last year that pushed the level of the reserve to the lowest since 1983. It remains to be seen whether the tender will be concluded, but we expect to see larger inventory draws as the Northern Hemisphere enters summer while the impact of strategic oil reserve release fades.
OPEC+ cuts should tighten the market further amid other supply constraints. The voluntary output cut by nine OPEC+ members this month should continue to tighten the market, while wildfires in Canada’s primary oil-producing province Alberta has forced shutdowns of oil and gas production. Iraq’s total oil exports this month are also likely to be limited amid continued suspension of production in the north. We anticipate oil production will fall back toward 100mbpd in May from around 101mbpd in 1Q23.
A tighter market should convince financial investors to return to the oil market, thus supporting prices. So, we maintain our most-preferred rating on oil alongside our positive stance on broad commodities. We continue to advise risk-taking investors to add long exposure via first-generation indexes or longer-dated Brent contracts, or to sell Brent’s downside price risk. We also see value in emerging market energy bonds for an attractive yield pickup versus developed market government and investment grade debt.

Crude Oil (WTI) 2 Scenarios Explained 🛢️
WTI Crude Oil is stuck between 2 solid structures.
Depending on the reaction of the price to these structures, I see 2 potential scenarios.
Bullish Scenario.
If the price breaks and closes above 74.3 resistance on a daily,
a bullish continuation will be expected to 76.57 level.
Bearish Scenario.
If the market drops and closes below 69.4 support,
a bearish movement will be expected to 65.0 level.
Wait for a breakout, it will show you the future direction of the market.
❤️Please, support my work with like, thank you!❤️

Crude Oil (WTI) Key Levels to Watch This Week 🛢️
Here is my latest structure analysis for USOIL.
Support 1: 63.6 - 64.5 area
Resistance 1: 73.88 - 74.3 area
Resistance 2: 76.5 - 77.0 area
Resistance 3: 78.6 - 79.9 area
Resistance 4: 83.17 - 83.5 area
Consider these structures for pullback / breakout trading.
❤️Please, support my work with like, thank you!❤️

CRUDE OIL (WTI) Bearish Pattern Explained🛢
WTI Crude Oil has recently reached a key horizontal resistance.
Testing that, the price formed a head and shoulders pattern.
Its neckline was broken yesterday.
The price is currently retesting that.
I believe that selling volumes are currently accumulating.
Probabilities are high that we will see a bearish move soon.
Goals will be: 69.87 / 68.11
❤️Please, support my work with like, thank you!❤️

CRUDE OIL (WTI) Key Levels to Watch This Week 🛢
Here is my fresh structure analysis for WTI Crude Oil for this week.
Resistance 1: 73.88 - 74.3 area
Resistance 2: 76.56 - 77.10 area
Resistance 3: 78.60 - 79.85 area
Resistance 4: 83.2 - 83.5 area
Support 1: 67.90 - 68.05 area
Support 2: 64.4 - 66.9 area
Consider these structures for pullback/breakout trading.
❤️Please, support my work with like, thank you!❤️


Crude Oil (WTI): Detailed Structure Analysis🛢️
Here are the key levels that I spotted on WTI Crude Oil.
Resistance 1: 76.6 - 77.0 area
Resistance 2: 78.6 - 79.9 area
Resistance 3: 83.2 - 83.5 area
Support 1: 69.8 - 71.6 area
Support 2: 64.4 - 66.9 area
Consider these structures for pullback/breakout trading this week.
❤️Please, support my work with like, thank you!❤️

UKOIL D1 AnalysisPossible Reversal H&S.
We except higher prices as we analyzed before.
Have a look at our previous analysis, link below👇
