Brent showing a further plummet to $67.89 Rising Flag has formed after the downtrend with Brent.
The price has broken below the rising flag which confirms bearishness.
200 > 21 > 7 - Bearish
RSI <50
Target $67.89
FUNDAMENTALS:
We've seen the US Dollar start to strengthen a bit which is can continue to do so for the next few weeks.
A strengthening US dollar can cause Brent crude price to drop because oil is priced in dollars. When the value of the dollar increases relative to other currencies, it makes oil more expensive for buyers using those currencies, which can result in decreased demand and lower prices. Additionally, a strong dollar can also make it more attractive for investors to sell commodities, including oil, in exchange for the higher-valued currency, putting downward pressure on prices.
Brent

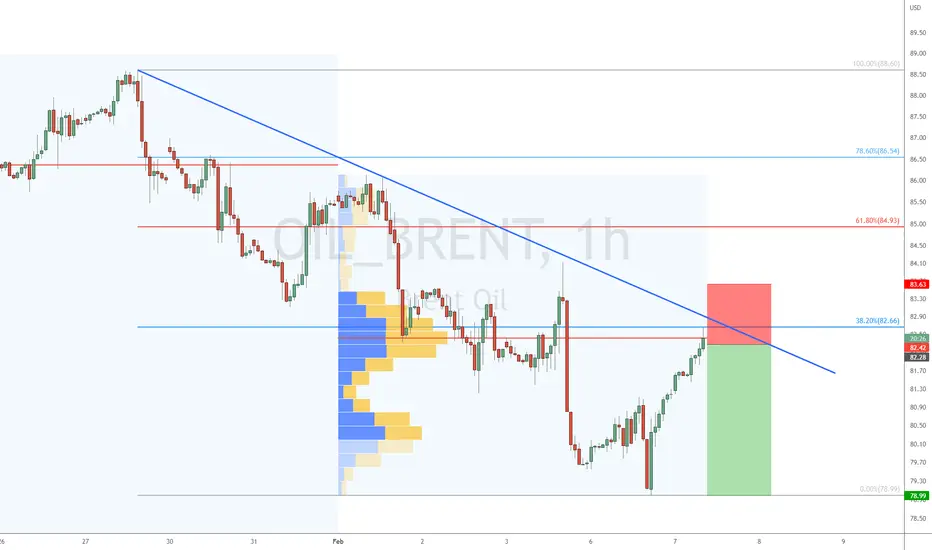
Joe Gun2Head Trade - Oil set to reverse corrective gains?Trade Idea: Buying Brent Oil
Reasoning: Rallied into resistance
Entry Level: 82.28
Take Profit Level: 78.99
Stop Loss: 83.63
Risk/Reward: 2.5:1
Disclaimer – Signal Centre. Please be reminded – you alone are responsible for your trading – both gains and losses. There is a very high degree of risk involved in trading. The technical analysis , like all indicators, strategies, columns, articles and other features accessible on/though this site is for informational purposes only and should not be construed as investment advice by you. Your use of the technical analysis , as would also your use of all mentioned indicators, strategies, columns, articles and all other features, is entirely at your own risk and it is your sole responsibility to evaluate the accuracy, completeness and usefulness (including suitability) of the information. You should assess the risk of any trade with your financial adviser and make your own independent decision(s) regarding any tradable products which may be the subject matter of the technical analysis or any of the said indicators, strategies, columns, articles and all other features.
sell idea Oil is making the opposite cup pattern. After it goes up according to the blue line, we will get ready to sell to the target of 70 and 68

USOIL WTI H4 Triple Top Pattern Breakout Target 74.70USOIL WTI H4 Triple Top Pattern Breakout Target 74.70 area let's see the market condition.

Brent OIL for Sell !!!Hi Brent Oil traders,
We think Brent Oil will be in sell in the coming days ...
Contact us for more informations or analysis or recommendations...
Team @TradeItDB
Good luck

WTI Crude Oil / CL1 - Accumulation Before Global ConflictA lot of fundamentals say that oil should be going up. A lot of Twitteratti and furus say that oil should be going up. Yet, it's not. Oil hasn't been bullish since literally June .
The only reason sentiment is still confusedly bullish like this is because WTI isn't (yet) trading like bonds.
People say that OPEC+ cutting production was some kind of battle with Washington and that the Biden Administration are doing some green energy nonsense saboteuring the country by selling off the Strategic Petroleum Reserve (SPR), because Joe Biden is senile.
That's not what's happening. Are you high? The United States is going to endanger its energy reserves while it's in a war with Russia? Don't be fooled by appearances. You need to start exercising critical thinking.
In my view, what has transpired is pretty simple:
1. The Biden Administration said they would refill the SPR at $80
2. When WTI fell to $76, instead of refilling it, they sold more of the SPR
3. They keep selling more of the SPR on this bounce at $80 and 90
4. The average price the SPR was filled at, the last time I looked, was $60
So why did OPEC+ cut production? Because they're smart money and they realized the United States is short on oil.
The U.S. and its vassals (including Canada) are by far the largest producers of oil in the world. It's their market, especially while Russia is out of the picture, and whoever makes the market sets the price.
So OPEC+ understands that oil is going down and cuts production accordingly. When the Biden Administration refills the SPR, that's the bottom, WTI will bounce hard, and OPEC will increase production again.
This is a lot of words to tell you that oil is going to make new lows, not new highs. This call that I made at the beginning of September is still definitely in play.
WTI Crude / CL - An Intervention: Saving Blind Bulls
There are some really important factors to look at in the longer timeframe charts. Consider that we're almost all the way through October and yet WTI, while it's in a bearish market shift, has not made a monthly low:
This is even more obvious on the Weekly, where a gap is revealed:
This ~$80 January gap range has now been traded extensively but has not produced the requisite re-continuation of a bull run needed, which means that lower prices are on the way.
The reason is, $120 was not the top. A big number like $180 or $220 is incoming, probably in 2023, but before then comes manipulation and accumulation, frankly speaking, probably in the $50 range.
Whether bulls want to hear that or not or want to believe that or not, that's how it goes. Not very many people believed Natural Gas was going to go from $10 to $4.9 either, but it did.
Natural Gas / NG - It's Officially a Bear. Now, Hold My Beer
The big wild card right now is actually not the conflict between the Russian Federation and NATO/Washington via Ukraine as a proxy. Even less is it whether the Federal Reserve keeps clowning around with interest rates.
Xi Jinping was just crowned leader of the notorious Chinese Communist Party for an unprecedented third term and has consolidated the Politburo with only his own people. But more concerningly, the man who should be fulfilling his historic role to collapse the CCP from within a la Gorbachev instead was quoted by ABC as having made communism and the deteriorating CCP "absolutely central to China's development and future."
This amounts to an abject disaster in Xi Jinping's life, a disaster for the Chinese people, and a disaster for the human race. If man won't do something about the problem of the Chinese Communist Party and its campaign of organ harvesting Falun Gong, then Heaven will.
The CCP may or may not attack Taiwan. That's a major wildcard in this call. Personally, I don't think the Party has enough stability while being sacked by Wuhan Pneumonia and hit by economic problems to really dare do it.
Yet, the more imminent a possible attack on Taiwan is, or the more imminent a major escalation with Russia is, the more violently the US oil market makers will dump WTI/Brent to where they want it to be so they can accumulate and refill the SPR.
How you want to trade it and what you want to do is up to you. But I believe we see a number like $89 on WTI this week and I intend to go long on bear ETFs with a target under $50 imminent by January.
Oil is something that is going to make a violent and impressive new high, but those cowboys are not going to let early money and dumb money come along for the ride particularly easily.
Be careful. Humanity has officially entered the most dangerous moment, and at a period where we're already in the proverbial "Triple Overtime."
What you believe can happen and what is actually happening, in reality, are often two different things.

Crude Oil (WTI): It Will Keep Falling! Here is Why: 🛢️
Crude Oil broke and closed below a support line of a rising wedge pattern on 4H.
Taking into consideration that the market has recently reached a solid supply area,
probabilities are high that the market will keep falling.
Goals: 78.3 / 77.4
❤️Please, support my work with like, thank you!❤️

Crude Oil (WTI): Detailed Technical Outlook 🛢️
Multiple time frame analysis on WTI Crude Oil.
Price action & key levels.
Trading recommendations & potential scenarios.
❤️Please, support this video with like and comment!❤️

sell idea Keep an eye on wti oil. If the trend line is broken, you can sell to the target of 77 and 75

Natural Gas / NG - Act II: A Number That Starts With "2"My previous call on natural gas made Sept. 19 has come to fruition, achieving all three targets, and in a shorter than expected period of time:
Natural Gas / NG - It's Officially a Bear. Now, Hold My Beer
The question I've asked myself for the last few days is simply: Now that the June lows have been taken out, is it time for a reversal?
And frankly, I don't believe a (sustained) reversal is imminent, mostly because I really do believe $18 NG1 is incoming and these market makers, who are total maniacs, will not make it so easy for one to go long.
Things to keep in mind when we're so close to the end of the month and major lows have been achieved:
1. Look out for bounces as monthly candle wicks are painted
2. Look out for monthly candle highs to be painted in the first days/weeks of November
3. Big volume gaps between $6.3 and $5. "It's only 23%!"
4. Big bounce from $4.9 to $5.3 June lows are likely
Trendlines are astrology, for real. Stop believing in them. No banks and no trading floors at Shell, Exxon, Aramco, Gazprom, are sitting there thinking of what to do with billions of dollars of inventory and drawing a diagonal line between two lows and thinking to themselves about such and such "support." That is truly absurd.
Yet, you should pay attention to these things because, to the contrary, they're used to fleece dumb money. The markets revolve around fleecing dumb money, and there are entire funds with billions of dollars of dumb money.
To put this trendline into perspective, although it looks reasonable on the 4H, look how absurd this is on the monthly:
That being said, it's also reasonable on the 1W and 1D charts:
&
We are notably at that point, below the psychological $5 level and more or less at the trendline, and at the end of the month. When June made its Armageddon move downwards it came right as the monthly contract closed, so I personally do not expect a repeat of the same situation.
I think a bounce to $5.3 is more or less inevitable, and I suspect rather than break through it and act like Silver/Gold/WTI has retracing to newer highs, it will bounce off the low and manufacture the kind of "resistance" found in technical analysis books to encourage late shorts.
Early November may actually show us a more bullish impulse back to $6, but keep in mind that to get back to that mid-October weekly gap would more or less fill the entire October monthly bar with a November wick, so that gap is likely a breakaway gap that will stay in place for some time.
Anyways, what I expect to see is after some retrace to catch late shorts and squeeze and break them, as well as to exploit early bulls, we will see a retrace, one that won't last long and will probably be quickly accompanied by another breakaway gap.
I believe that natural gas will, in a very quick period of time, actually print a number as low as $2.9, a move that will be accompanied by WTI also setting new lows and approaching $50, as I noted in a recent call:
WTI Crude Oil / CL1 - Accumulation Before Global Conflict
Europe has already filled their coffers with $9-10 US LNG delivered via boat and until they need to refill the barrels in a few months after Freeport is re-opened, prices should be suppressed as producers and funds get net long on energy.
The reason is, problems between NATO and Russia and problems between the World and the Chinese Communist Party under the new found "Emperor" Xi and his delusional miscalculation to stay attached to Marxist-Leninism and communism will lead the Party to either attack Russia alongside NATO or to pinch both Russia and NATO with an assault on Taiwan.
Energy will be _extremely_ expensive everywhere once the global conflict breaks out. But as with all such moves, first come lows that are more uncomfortable than early bulls and scared bears are comfortable with.
2023 will not be a pleasant year, so make sure you do your utmost to have a proper Christmas with your family and act like a good person.
Whoever you are who is reading this, what I want to tell you is this: If you want a future, you need to start by first rejecting communist culture, especially all things Marxist-Leninism.
Next, you need to reject the Chinese Communist Party, for it is guilty of the crime of live organ harvesting genocide against Falun Gong and will be purged by history.
Third, you need to start to emphasize virtue and improve your conduct and morality on a foundation of traditional human culture.
I am not talking about dogma, and I am not talking about religion. Both of those are totally useless. I am talking about a rational understanding of what it means to be "a human being," the things that have allowed this civilization and this cycle of history to persist over the last 5,000 years, founded on the back of the Chinese dynasties.
There are so many lessons in history. I hope that whoever has the fortune to encounter my words can walk out of the catastrophe. But if your thoughts are unrighteous, then if you can't, you can't.
Regrets, however, will be no help at all.
It's just like poker: you have to figure it out and have your bets placed before the cards are turned face up. Once the truth is revealed, everything is fixed.


USOILOil looks likely to make a new high, with a higher low formed and divergence on the RVGI, Price is also trading above TWAP, wait for weakness to look for buys.

Brent Could Cruise to $100 Soon- Demand from China is soaring.
- The US dollar index has recoiled.
- Supply is not rising as fast as demand is.
- I think recession fears are overblown. Where I live, people are traveling like crazy.
- European Union will announce new Russia sanctions on February 5.

Brent: Wax your Skis ⛷️Brent accomplished the climb above the $86.06-mark and should continue to rise to finish the blue wave . Once completed, we see the course heading for a steep downwards slope to dip right into the green target zone between $77.13 and $42.20. Within the target zone, we expect the Oil to sink further to end the blue wave around the $62-mark, before rising back North to wrap up the blue wave . Followed by another correction, the course should dig deeper and get closer to the bottom of the green target zone, in order to finalize the green wave .


Crude Oil (WTI) Your Trading Plan Explained 🛢️
Price action analysis for WTI Crude Oil.
Key levels & detailed trading plan.
Directional bias and thoughts.
❤️Please, support this video with like and comment!❤️

USDWTI D1 - Short SignalUSDWTI D1 - Still lots pending at the moment with regards to the dollar, we are starting the week off bullish, with the dollar up .15$% on the day, cable down .25%, XAU down .27% and WTI down a huge 0.5% so far... Hoping to see deeper corrections. But ultimately, we need this D1 candle on these ***USD setups to close red. Back on that heavy $80/b psychological price

Could we get a $10 drop in OilIf we get a good NFP number tomorrow, does that mean the US jobs market is strong? What will the Fed do? Raise rates, increase QT?
Fundamentally we should be seeing lower GDP, lower wages, lower demand and with that lower Oil.
Technically, we have higher GDP, stable wages, mixed changes in demand and lower oil.
This EOD strategy has been set, and now we just forget until we get to TP 1. Then for the remainder of the position, we get to BE and start trailling.
Todays stronger dollar on the back of ADP numbers, will repeat tomorrow on strong NFP numbers, or reverse if NFP comes in under the consensus.
Lower oil, on stronger USD, is also very bullish for Japan's economy as they are an energy importer. You will have to pick a side if trading USDJPY but it could be messy.

brent shortIf we see the entry signal in this zone with the set loss limit, we will enter the matter of the degree of ascent, but keep in mind that this signal is used in the upper periods, so you must be patient enough, but if the goals are achieved, there will be a good profit.
UKOIL Due for 4X Growth in Value Over 4 to 5 YearsBased on the macro wavemap for UKOIL, its fairly safe to assume that the value of this commodity will increase by 396% over the next 4 to 5 years. Seemingly in a Flat corrective wave, the new all-time high near $324 should send price to retest the $60 range (at the highest).

🛢Brent oil: wave III target remains $150+●● Preferred count
● CFDs on Brent Crude Oil (TVC) , 🕐TF: 1M
Fig.1
The three-wave movement within the framework of wave III of (V) is not completed. The minimum target is the same — to exceed the wavelength of wave II , which will lead to a rise in the price to $ 150+ . The subsequent wave IV will return the price to the current levels.
______________________________
● Brent Crude Oil (OANDA) , 🕐TF: 2D
Fig.2
From July 2022 , a correction Ⓧ is predicted.
Upon completion of the consolidation in wave (B) , a decline will follow within wave (C) in the form of an impulse. This forecast is based on the norm of the alternation of waves " A " and " C " within a zigzag.
______________________________
● Brent Crude Oil (OANDA) , 🕐TF: 4h
Fig.3
Correction (B) is expected to take the form of a triangle, but other sideways correction are not excluded. The option of counting in the form of a triangle is schematically indicated by a red dotted line. Black color marks an alternative count with a completed wave (B) in the form of a running flat. With the breakdown of the top of wave B , the activation of the alternative marking will follow.
📚 Elliott Wave Guide & Ellott Wave Archive ⬇️⬇️

USOILOil prints this great weekly candle, which suggests that price is going to revert back into Value, and deems the excessively high oil prices as a tad overpriced, which is great. We have this big weekly pin inside the range of the previous candle, and typically these produce some great trades as the bearish pressure starts to build, we can look to aim for three trade points from here. Enjoy.

USOIL - Getting Slippery 💧Hello TradingView Family / Fellow Traders. This is Richard, as known as theSignalyst.
on MONTHLY: Left Chart
USOIL is sitting around a strong support zone 70.0 - 75.0 , so we will be looking for buy setups on lower timeframes.
🏹 on H1: Right Chart
For the bulls to take over, we need a break above the previous major high in gray.
Meanwhile, until the buy is activated, USOIL can still trade lower inside the monthly resistance zone till around the 70.0 where we will be looking for new buy setups.
📚 Always follow your trading plan regarding entry, risk management, and trade management.
Good luck!
All Strategies Are Good; If Managed Properly!
~Rich
