Brent

OPEC and Whales - What next? This graph is a representation of my point of you of the futures market (USD).

MARKET UPDATE!!! WHAT TO EXPECT THIS WEEK?Hi Snipers,
Please refer to the recording for the next price levels and scenarios.
Thanks
MS

CFDSHello guys i want to share my analysis of CRUDE OIL on daily timeframe Thank you
if you like my work please like and follow Thank you
Turtle Trader

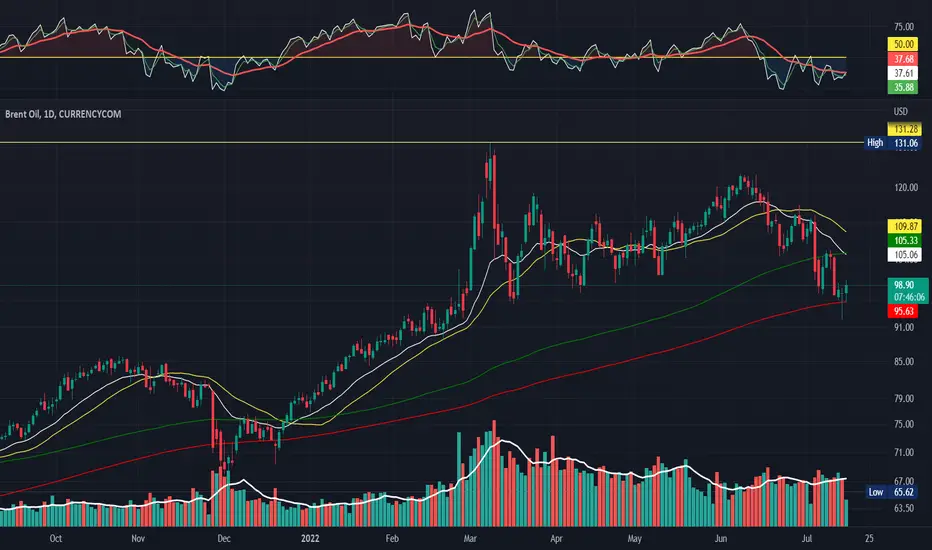
BRENT CRUDE OIL BEARISH PREDICTIONSPrices of petroleum are declining due to increased output by OPEC and United States and weakening demand by the Chinese economy.
RSI index of the Daily graph of BRENT is below the neutral line of 50, and MACD histogram, although still above 0 line, is declining.
If the price keeps falling, it might test its previous support at 91.50 and if it breaks it, it might target levels of 84. Alternatively, it might try to reach levels of 105.5
Risk Disclosure: Trading Foreign Exchange (Forex) and Contracts of Difference (CFD's) carries a high level of risk. By registering and signing up, any client affirms their understanding of their own personal accountability for all transactions performed within their account and recognizes the risks associated with trading on such markets and on such sites. Furthermore, one understands that the company carries zero influence over transactions, markets, and trading signals, therefore, cannot be held liable nor guarantee any profits or losses.

GSC - Goldman Sachs Commodity Index - Bullish UpTrend intactGSC - Goldman Sachs Commodity Index - Bullish UpTrend intact.
Broken red long term DownTrend line.
Reverse yellow Head & Shoulders reversal pattern.
New Green UpTrend line being adhered too.

$angs.l Angus Energy PLC Price Change % Change Share Price Bid Price Offer Price High Price Low Price Open Price Shares Traded Last Trade
0.26 12.68% 2.31 2.25 2.30 2.475 2.075 2.075 252,253,435 16:35:09
great fundamentals, expecting positive rns September. active oil wells and ownership. im buying for long term, 30p target

CRUDE OIL (WTI) Detailed Technical Outlook 🛢
Price action analysis on WTI Crude Oil.
Structure & key levels.
Potential scenarios and thoughts.
❤️If you have any questions, please, ask me in the comment section.
Please, support my work with like, thank you!❤️

#Brent crude oil cleared 200dma again - bullishChart speaks for itself.. after failing below the 200dma oil has managed to climb back and hold above the 200dma (green).. it has also broken a downtrend which has kept price action moving lower. over the last couple of weeks. odds are for higher oil prices from here.. I have seasonality only peaking at the end of September so it would then suggest we can expect a move higher throughout September

USOIL - The downtrend continuesIn the first quarter of 2022, we warned market participants about the peaking conditions in the oil bull market. Since then, our predictions came true, and USOIL dropped over 30% from its highs, hitting our 100 USD and 90 USD price targets. At the moment, we still remain bearish on WTI oil with a medium-term price target of 80 USD. Our views are based on technical and fundamental factors.
Technical analysis - daily time frame
RSI, MACD, Stochastic, DM+, and DM- are all bearish. Overall, the daily time frame is bearish.
Illustration 1.01
Illustration 1.01 shows USOIL down approximately 33% from its 2022 highs. At the moment, we pay close attention to the sloping resistance; a breakout above it will be a bullish sign, potentially hinting at the correction of the downtrend.
Technical analysis - weekly time frame
RSI, MACD, Stochastic, DM+, and DM- are all bearish. Overall, the weekly time frame is bearish.
Please feel free to express your ideas and thoughts in the comment section.
DISCLAIMER: This analysis is not intended to encourage any buying or selling of any particular securities. Furthermore, it should not be a basis for taking any trade action by an individual investor. Therefore, your own due diligence is highly advised before entering a trade.

uk oil Hello guys i want to share my analysis of CRUDE OIL on 4H timeframe Thank you
if you like my work please like and follow Thank you
Turtle Trader

📈BRENT 08/26/2022: medium-term growth❗️📈 Priority direction: Up .
📝 Description: Oil is in the resistance area near the $100 level, trying to break up. The medium-term view is directed upwards, however, there is a possibility that the instrument will not break through the indicated resistance immediately and before that it will roll back to $98.55. The target for growth is the level of $104 and $106 can be considered a little higher.
--------------------------
Thank you for your support, subscribe and share your ideas here 👇
--------------------------

📉GOLD 08/25/2022: stop❗️📉 Priority direction: Down .
📝 Description: Already today, the metal is trading at $1764, thus being at the local resistance. Probably here the promotion of buyers will slow down a little or stop altogether. Most expected is a stop at current levels and consolidation.
--------------------------
Thank you for your support, subscribe and share your ideas here 👇
--------------------------

USOILUSOIL long idea based on current PA. We could see Yen continuation to the downside if Oil makes a rally higher here, due to the amount of Oil importing into Japan, it backs up my thinking of JPY falling and CADJPY rising if we see an impulsive move upwards here.

Inverse W on Oil i see inverse W pattern on oil,WTI on big TF for next weeks i mean. and we are on bullish momentum now.

Brent Crude Could Retest the Top of $138A large sideways consolidation could be over with an Ending Diagonal in the wave C.
The minimum target is to retest the previous top of $138.
RSI is breaking above the 50 "waterline" into a bullish area.

#UKOIL (Brent Oil) : 08.23.22 This is the possible trend of #UkOil (Brent) and there's 3 scenario that i indicated them on the chart , everything is clear , but just in case if you had any questions please feel free to ask !
Follow us for more analysis & Feel free to ask any questions you have, we are here to help.
⚠️ This Analysis will be updated ...
👤 Arman Shaban : @ArmanShabanTrading
📅 08.23.2022
⚠️(DYOR)
❤️ If you apperciate my work , Please like and comment , It Keeps me motivated to do better ❤️

📈BRENT 08/23/2022: buyers in action❗️📈 Priority direction: Up .
📝 Description: There is interest in oil around the $95 level (on average) and most likely further events will develop above this level. The approach of the level to $98.55 is expected. Globally (medium and long term) as long as oil is above $91.70, buy-priority to $100 and above remains.
--------------------------
Thank you for your support, subscribe and share your ideas here 👇
--------------------------

USOILUSOIL looks likely to continue the downtrend on the 4H timeframe after making this huge wick and it looks like sellers are starting to gain momentum.

USDCAD - BUYPrice is under bullish pressure. A close above 1.2860 today will increase the chances of hitting 1.2988 soon.

OXYBuffett's ongoing purchase of large volumes of OXY, as well as buyouts by the Bill & Melinda Gates Foundation should lead to the growth of the paper, which is still quite attractive in terms of financial performance.

📈BRENT 08/19/2022: positive attitude❗️📈 Priority direction: Up .
📝 Description: The price of oil still broke through the resistance line, which was indicated yesterday, and yesterday's alternative buy scenario automatically worked. Today and in the near future, growth is expected to continue towards $98.55. There is resistance at the levels of $96-$97, and as a result of passing the indicated value, the instrument is more likely to acquire an upward character again.
--------------------------
Thank you for your support, subscribe and share your ideas here 👇
--------------------------
