x22. BrentBeta-R:Journal. Risk Management: Compound .Level : PA . Time: Short-term - Intermediate . This is just my view follow if it aligns with yours. Ideas are not repeated rather updated.
Brentcrude

USDBRO bounced from support, potential for a further rise!
USDBRO bounced off 62.20 where it could potentially rise further to 64.80.
*Disclaimer.*
Trading leveraged products carries a high level of risk and may result in you losing substantially more than your initial investment. Pepperstone Group Limited is licensed and regulated by the Australian Securities and Investments Commission (AFSL 414530). Pepperstone Limited is authorised and regulated by the United Kingdom Financial Conduct Authority (FRN 684312). This information is not intended for distribution to, or use by, any person in any country or jurisdiction where such distribution or use would be contrary to local law or regulation.


...as Buyers looks to push the Price of BRENT higher.When there is a will, there will always be a way! Buyers are aiming to get Prices as high as 70.00 for UKOIL aka BRENT(XBRUSD) medium term.
Longer term - Invariably the overall goal for Buyers is to get Prices for this sweet juice trading above $100 per barrel, actually up to around $108.00 mark, all this culminating from activities of the early days in 2016 with precise origins at the beginning of the year before(2015) but this motive was not supported throughout that year.
Mavintrades - Only the Technicals are considered at Mavintrades and no single thoughts/interest afforded to any sort of Fundamentals in all our study..


BRENT OILBRN
BRENT OIL
BRENT CRUDE
BREBT OIL ANALYSIS
--------------------
Be Different ...
Hamid Rahathagh

USDBRO reversed from resistance, potential drop!
USDBRO reversed off its resistance at 59.71 where it could potentially drop further to 58.50.
*Disclaimer.*
Trading leveraged products carries a high level of risk and may result in you losing substantially more than your initial investment. Pepperstone Group Limited is licensed and regulated by the Australian Securities and Investments Commission (AFSL 414530). Pepperstone Limited is authorised and regulated by the United Kingdom Financial Conduct Authority (FRN 684312). This information is not intended for distribution to, or use by, any person in any country or jurisdiction where such distribution or use would be contrary to local law or regulation.


USDBRO bounced from support, potential for a further rise!
USDBRO bounced off 58.95 where it could potentially rise further to 61.40.
*Disclaimer.*
Trading leveraged products carries a high level of risk and may result in you losing substantially more than your initial investment. Pepperstone Group Limited is licensed and regulated by the Australian Securities and Investments Commission (AFSL 414530). Pepperstone Limited is authorised and regulated by the United Kingdom Financial Conduct Authority (FRN 684312). This information is not intended for distribution to, or use by, any person in any country or jurisdiction where such distribution or use would be contrary to local law or regulation.


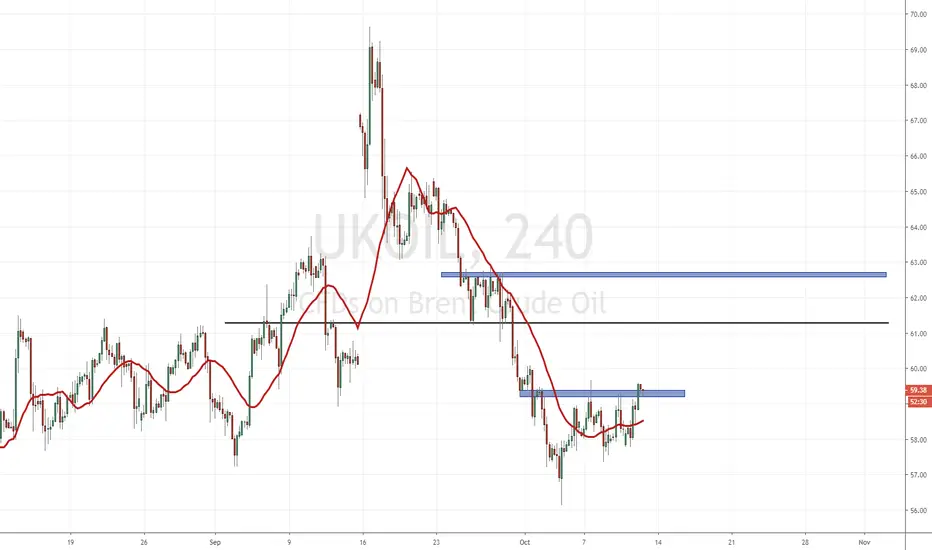
Brent Crude Oil Breakout. Stock Market Signal?We had a break out on UK Oil here on the 4 hour chart. US Oil is at the breakout point:
Oil has been in a prolonged downtrend with lower highs and lower lows. We began basing at the 57.50 zone on Brent.
From here, we began to show exhaustion of the trend and it appears we have made our first higher low here with the higher high. For those that are more conservative, perhaps see how price reacts at 60.
For our target, it would be the 62.75 zone although be sure to see how price reacts at the 61.30 zone.
A lot of talk about the Turkey Syria situation, however as I discuss in my post regarding Aramco, Oil is bearish due to recession fears however any geopolitical events will prop Oil.
In fact, it seems Oil must be propped. When Oil fell below 25 in the last down move, Oil companies were about to go under. Governments basically forced the banks to loan money to these Oil companies...the banks knew these Oil companies would never be able to pay back. They are essentially "zombie" companies.
So is Oil does fall a large percentage, not only will these Oil companies be in trouble, but also the banks which loaned to them.
For the US markets, Energy and Finance are the two largest components. If those two sectors are up, the overall markets are likely to be up. If we see a move higher in Oil as expected from these set ups, expect equities to follow.
No more free markets folks. everything really needs to be managed due to financial engineering our central banks used to generate growth...rather than growth from underlying fundamentals.
USDBRO bounced from support, potential for a further rise!
USDBRO bounced off 58.95 where it could potentially rise further to 61.40.
*Disclaimer.*
Trading leveraged products carries a high level of risk and may result in you losing substantially more than your initial investment. Pepperstone Group Limited is licensed and regulated by the Australian Securities and Investments Commission (AFSL 414530). Pepperstone Limited is authorised and regulated by the United Kingdom Financial Conduct Authority (FRN 684312). This information is not intended for distribution to, or use by, any person in any country or jurisdiction where such distribution or use would be contrary to local law or regulation.

BrentCrude Oil (BCO)Price cannot seem to close below support levels. In an attempt to push below toward the downside, price creates a bullish pin off daily support levels. Great buying opportunity for bulls.

BRENT CRUDE POWERFUL BULLISH REVERSAL PATTERNBrent crude is formed a double bottom pattern with a strong pinbar pattern and a bullish reversal pattern.
Brent has previously made a fresh higher high and failed to form a new lower low, signaling a possible trend reversal to the upside. Also, notice the (slight) bullish divergence in the RSI.
Could we see a retest of the recent high near the $70 mark?

Short Opportunities Brewing...Oil has fallen to pre-crisis (Houthi rebels/Iran attack) and filled in the original gap.
Price has closed just above the start of a large support zone (~400 pips)
The RSI2 is approaching oversold conditions
Whilst the dominant trend is certainly to the downside, this support zone has been defended by bulls in the past. This should give many opportunities to get short with a maximum tp level of $56.

Buy opportunityWe tested the bottom of the white channel and bounced - I'm waiting for the growth to its top or to the top of the current sideways motion and then short the bounce.

BCOUSD OVERSOLD! Trade for pullbackOANDA:BCOUSD
CRUDE OIL INVENTORIES REPORT OUT LATER
Current outlook: LONG
Oversold under:
RSI : 30 Mins
RSI : 60 Mins
RSI : 4 Hours.
Price range now is also near support level.
Market looks dangerous to go long but will be entering it to try and get pullback profit.
TP: 63.30
Position duration: ~14 days


GLOBALISTS AT IT AGAIN, OIL PRIMED TO RUN (BCOUSD)Hello traders.
This weekend, YEMENI REBELS have taken credit for a MAJOR DRONE STRIKE on Saudi Oil production, affecting their total output by HALF and therefore decreasing global supply by 2.5%.
Shortly thereafter, American officials turned to IRAN to place blame. The American government has been pining for this conflict for a very long time. With any luck, whatever your political leaning might be, President Trump will see through this facade and keep the brave American military OUT of such a conflict. There is no excuse for the exchange of human life for profit!!!!
All this to say, BAD FOR EARTH, GOOD FOR OIL SPECULATION.
The technicals on Brent Crude, though somewhat 50/50 in my eyes, show CLEARLY that oil indeed has room to run here. This Black Swan event could be the perfect catalyst to cause a major spike in price.
There isn't much more to say. I will be taking a market trade here with a relatively tight stop. This will be a low Risk high Reward trade.
Good luck everyone.
Most importantly, stay safe my friends.

BRENT CRUDE OIL BREAKOUT?Brent Crude Oil looks likely to break out of the trendline resistance as the risk-on sentiment remains.
Technically price is working within a channel and if price closes above confirming the breakout the sentiment
on oil will likely change. The USD weakness will help oil find higher prices so keep an eye on the USD Index.

Brent Crude Breakout?Awaiting for the close to confirm this breakout. Of course this would be a trade. I am still of the opinion that a recession is coming (or we are already in one) and oil will struggle. Really only geopolitics can change that.
However, on Brent crude, we had a downtrend and failed to make more lower lows. Indicating that the buyers were stepping in and the trend was changing.
We appear to be getting a confirmed break above this resistance level. Just awaiting the close.
There is a flip zone at the 64.10 zone so watch how price reacts there.Otherwise 65 may be in the cards.

BRENT CRUDE OIL BREAKING LOWSBrent Crude Oil is breaking through the weekly lows and with oil production increases the price of
oil is likely to continue to fall. Now the weekly lows have been broken we can look for further shorting
opportunities down to the demand zone of 52.00.

